
Cytokine Inducible SH2-containing protein (CIS-1) is a 29 kDa protein found in a variety of cell types. Mono or polyubiquitination generally results in a 37 or 45 kDa molecule. CIS-1 binds to phosphorylated cytokine receptors IL-3 R beta and EPO-R and blocks downstream activation of STAT5 via receptor internalization and ubiquitin‑mediated proteosomal degradation. Human CIS-1 is a 258 aa peptide that contains one SH2 domain (aa 82‑163) and one SOCS box (aa 218‑258). There are two known alternatively spliced variants with a 7- or 13-aa substitution for the 7 N-terminal amino acid residues. Over the region used as immunogen, human CIS-1 is 91% identical to the corresponding mouse and canine protein sequences.


Scientific images may be resized, cropped, or adjusted for brightness or contrast for presentation purposes. These updates are limited to presentation and do not affect the underlying scientific interpretation of the data. Where available, additional source data may be provided upon request.
Key Product Details
Species Reactivity
Validated:
Human
Cited:
Human
Applications
Validated:
Western Blot, Immunocytochemistry, Simple Western
Cited:
Western Blot
Label
Unconjugated
Antibody Source
Polyclonal Goat IgG
Loading...
Product Specifications
Immunogen
E. coli-derived recombinant human CIS-1
Leu11-Leu258
Accession # Q9NSE2
Leu11-Leu258
Accession # Q9NSE2
Specificity
Detects human CIS-1 in direct ELISAs and Western blots.
Clonality
Polyclonal
Host
Goat
Isotype
IgG
Scientific Data Images for Human CIS-1 Antibody
Detection of Human CIS-1 by Western Blot.
Western blot shows lysates of Nalm-6 human Pre-B acute lymphocytic leukemia cell line. PVDF membrane was probed with 1 µg/mL of Goat Anti-Human CIS-1 Antigen Affinity-purified Polyclonal Antibody (Catalog # AF3194) followed by HRP-conjugated Anti-Goat IgG Secondary Antibody (Catalog # HAF019). A specific band was detected for CIS-1 at approximately 35-40 kDa (as indicated). This experiment was conducted under reducing conditions and using Immunoblot Buffer Group 8.
CIS‑1 in HDLM‑2 Human Cell Line.
CIS‑1 was detected in immersion fixed HDLM‑2 human Hodgkin’s lymphoma cell line using Goat Anti-Human CIS‑1 Antigen Affinity-purified Polyclonal Antibody (Catalog # AF3194) at 15 µg/mL for 3 hours at room temperature. Cells were stained using the NorthernLights™ 557-conjugated Anti-Goat IgG Secondary Antibody (red; NL001) and counterstained with DAPI (blue). Specific staining was localized to cytoplasm. Staining was performed using our protocol for Fluorescent ICC Staining of Non-adherent Cells.
Detection of Human CIS‑1 by Simple WesternTM.
Simple Western lane view shows lysates of NK human natural killer lymphoma cell line, loaded at 0.2 mg/mL. Specific bands were detected for CIS‑1 at approximately 37 and 42 kDa (as indicated) using 10 µg/mL of Goat Anti-Human CIS‑1 Antigen Affinity-purified Polyclonal Antibody (Catalog # AF3194). This experiment was conducted under reducing conditions and using the 12-230 kDa separation system.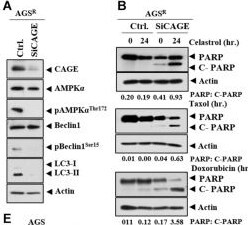
Detection of CIS-1 by Western Blot
CAGE regulates anticancer drug resistance and autophagic flux. (A) After 48 h of transfection with the indicated siRNA (each at 10 nM), immunoblot was performed. Representative blots of three independent experiments are shown. Ctrl. denotes control siRNA. (B) After 24 h of transfection, cells were treated with the indicated anticancer drug for 24 h. Quantification of band intensity was represented by the ratio of cleaved/full-length PARP normalized to actin. (C) Same as (A) except that immunofluorescence staining was performed. ***, p < 0.001. (D) After 48 h of transfection with the indicated construct, immunoblot was performed. Representative blots of three independent experiments are shown. (E) After 24 h of transfection, the cells were treated with the indicated anticancer drug (each at 1 μM) for 24 h. (F) Same as (D) except for the immunofluorescence staining. Image collected and cropped by CiteAb from the following open publication (https://pubmed.ncbi.nlm.nih.gov/34113619), licensed under a CC-BY license. Not internally tested by R&D Systems.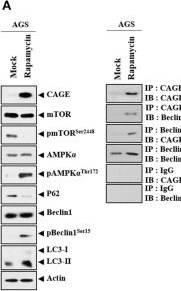
Detection of CIS-1 by Western Blot
CAGE expression is regulated by autophagy regulators. (A) AGS cells were treated with or without rapamycin for 24 h. Representative blots of three independent experiments are shown. (B) AGS cells were treated with or without rapamycin for 24 h, followed by immunofluorescence staining. ***, p < 0.001. (C) AGS cells were treated with or without rapamycin (5 μM) for 24 h, followed by treatment with celastrol (1 μM), Taxol (1 μM), or doxorubicin (1 μM) for 24 h. Representative blots of three independent experiments are shown. (D) AGSR cells were treated with or without chloroquine (CQ) (100 μM) for 24 h. Representative blots of three independent experiments are shown. (E) AGSR cells were treated with or without CQ (100 μM) for 24 h, followed by treatment with the indicated anticancer drug for 24 h. Representative blots of three independent experiments are shown. Image collected and cropped by CiteAb from the following open publication (https://pubmed.ncbi.nlm.nih.gov/34113619), licensed under a CC-BY license. Not internally tested by R&D Systems.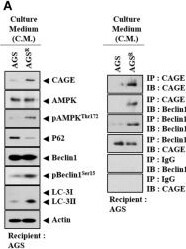
Detection of CIS-1 by Western Blot
Soluble factors regulate autophagic flux. (A) Culture medium of AGSR cells were added to AGS cells for 24 h. Representative blots of three independent experiments are shown. (B) Same as (A) except that the number of LC3 puncta was determined. ***, p < 0.001. (C) Cytokine array analysis was performed. (D) Matrigel plug assays using culture medium were performed. (E) Immunoblot was performed. Representative blots of three independent experiments are shown. (F) After 48 h of transfection with the indicated siRNA (each at 10 nM), culture medium was added to AGS cells for 24 h. Representative blots of three independent experiments are shown. (G) Culture medium of the indicated cancer cells was added to the CAGE CRISPR–Cas9 cell line for 24 h. Representative blots of three independent experiments are shown. Image collected and cropped by CiteAb from the following open publication (https://pubmed.ncbi.nlm.nih.gov/34113619), licensed under a CC-BY license. Not internally tested by R&D Systems.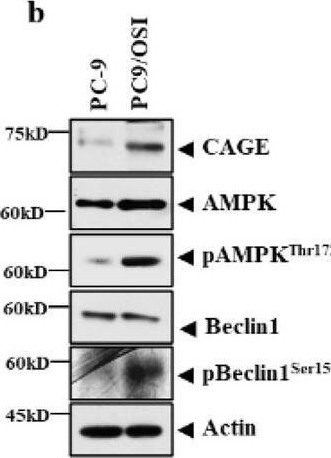
Detection of CIS-1 by Western Blot
CAGE regulates tumorigenic potential in vivo. (a) The indicated cancer cells (each at 1 × 10⁶) were injected into the dorsal flanks of athymic nude mice. Tumor volumes were measured as described. Significance determined by one-way ANOVA.***, p < 0.001. Each experimental group consisted of five athymic nude mice. (b) Tumor tissue lysates were subjected to immunoblot. Representative blots of three independent experiments were shown. The uncropped blots are shown in Supplementary Materials. (c) The indicated cancer cells (each at 1 × 10⁶) were injected into the dorsal flanks of nude mice. Each experimental group consisted of five nude mice. Data are presented as a mean ± SEM. Tumor volumes were measured as described. Significance determined by one-way ANOVA. *, p < 0.05; ***, p < 0.001. (d) Tumor tissue lysates were subjected to immunoblot and immunohistochemical staining. Representative images of three independent experiments were shown. Data are presented as mean ± SEM. Significance determined by one-way ANOVA. *, p < 0.05; **, p < 0.01; ***, p < 0.001. The uncropped blots are shown in Supplementary Materials. Image collected and cropped by CiteAb from the following open publication (https://pubmed.ncbi.nlm.nih.gov/37735252), licensed under a CC-BY license. Not internally tested by R&D Systems.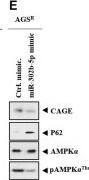
Detection of CIS-1 by Western Blot
MiR-302b-5p regulates autophagic flux and anticancer drug resistance. (A) After 48 h of transfection with the indicated inhibitor (each at 10 nM), immunoblot and immunoprecipitation were performed. Representative blots of three independent experiments are shown. (B) Same as (A) except that immunofluorescence staining was performed. **, p < 0.01. (C) qRT-PCR was performed. **, p < 0.01. Average values of three independent experiments are shown. (D) AGS cells were transfected with the indicated inhibitor (each at 10 nM). The following day, cells were then treated with or without celastrol (1 μM), Taxol (1 μM), or doxorubicin (1 μM) for 24 h. Representative blots of three independent experiments are shown. (E) After 48 h of transfection with the indicated mimic (each at 10 nM), immunoblot and immunoprecipitation were performed. Representative blots of three independent experiments are shown. (F) Same as (E) except that the number of LC3 puncta was determined. **, p < 0.01. (G) qRT-PCR analysis was performed. ***, p < 0.001. Average values of three independent experiments are shown. (H) AGSR cells were transfected with the indicated mimic (each at 10 nM). The next day, cells were then treated with or without celastrol (1 μM), Taxol (1 μM), or doxorubicin (1 μM) for 24 h. Representative blots of three independent experiments are shown. Image collected and cropped by CiteAb from the following open publication (https://pubmed.ncbi.nlm.nih.gov/34113619), licensed under a CC-BY license. Not internally tested by R&D Systems.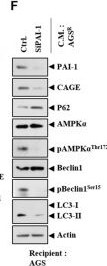
Detection of CIS-1 by Western Blot
Soluble factors regulate autophagic flux. (A) Culture medium of AGSR cells were added to AGS cells for 24 h. Representative blots of three independent experiments are shown. (B) Same as (A) except that the number of LC3 puncta was determined. ***, p < 0.001. (C) Cytokine array analysis was performed. (D) Matrigel plug assays using culture medium were performed. (E) Immunoblot was performed. Representative blots of three independent experiments are shown. (F) After 48 h of transfection with the indicated siRNA (each at 10 nM), culture medium was added to AGS cells for 24 h. Representative blots of three independent experiments are shown. (G) Culture medium of the indicated cancer cells was added to the CAGE CRISPR–Cas9 cell line for 24 h. Representative blots of three independent experiments are shown. Image collected and cropped by CiteAb from the following open publication (https://pubmed.ncbi.nlm.nih.gov/34113619), licensed under a CC-BY license. Not internally tested by R&D Systems.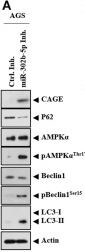
Detection of CIS-1 by Western Blot
MiR-302b-5p regulates autophagic flux and anticancer drug resistance. (A) After 48 h of transfection with the indicated inhibitor (each at 10 nM), immunoblot and immunoprecipitation were performed. Representative blots of three independent experiments are shown. (B) Same as (A) except that immunofluorescence staining was performed. **, p < 0.01. (C) qRT-PCR was performed. **, p < 0.01. Average values of three independent experiments are shown. (D) AGS cells were transfected with the indicated inhibitor (each at 10 nM). The following day, cells were then treated with or without celastrol (1 μM), Taxol (1 μM), or doxorubicin (1 μM) for 24 h. Representative blots of three independent experiments are shown. (E) After 48 h of transfection with the indicated mimic (each at 10 nM), immunoblot and immunoprecipitation were performed. Representative blots of three independent experiments are shown. (F) Same as (E) except that the number of LC3 puncta was determined. **, p < 0.01. (G) qRT-PCR analysis was performed. ***, p < 0.001. Average values of three independent experiments are shown. (H) AGSR cells were transfected with the indicated mimic (each at 10 nM). The next day, cells were then treated with or without celastrol (1 μM), Taxol (1 μM), or doxorubicin (1 μM) for 24 h. Representative blots of three independent experiments are shown. Image collected and cropped by CiteAb from the following open publication (https://pubmed.ncbi.nlm.nih.gov/34113619), licensed under a CC-BY license. Not internally tested by R&D Systems.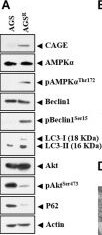
Detection of CIS-1 by Western Blot
Anticancer drug resistance is correlated with enhanced autophagy and antiapoptotic effects. (A) Cell lysates were subjected to immunoblot and immunoprecipitation. Representative blots of three independent experiments are shown. Immunofluorescence staining of LC3 (B) and cancer-associated gene (CAGE) (C) was performed. ***, p < 0.001. (D) Representative electron micrograph of AGS cells and AGSR cells is shown. The black arrows indicate autolysosomes. The white arrows indicate multivesicular bodies. (E) After 48 h of treatment, immunoblot was performed. C-PARP denotes cleaved PARP. Representative blots of three independent experiments are shown. Image collected and cropped by CiteAb from the following open publication (https://pubmed.ncbi.nlm.nih.gov/34113619), licensed under a CC-BY license. Not internally tested by R&D Systems.Applications for Human CIS-1 Antibody
Application
Recommended Usage
Immunocytochemistry
5-15 µg/mL
Sample: Immersion fixed HDLM‑2 human Hodgkin's lymphoma cell line
Sample: Immersion fixed HDLM‑2 human Hodgkin's lymphoma cell line
Simple Western
10 µg/mL
Sample: NK human natural killer lymphoma cell line
Sample: NK human natural killer lymphoma cell line
Western Blot
1 µg/mL
Sample: Nalm‑6 human Pre‑B acute lymphocytic leukemia cell line
Sample: Nalm‑6 human Pre‑B acute lymphocytic leukemia cell line
Reviewed Applications
Read 1 review rated 1 using AF3194 in the following applications:
Formulation, Preparation, and Storage
Purification
Antigen Affinity-purified
Reconstitution
Reconstitute at 0.2 mg/mL in sterile PBS. For liquid material, refer to CoA for concentration.
Loading...
Formulation
Lyophilized from a 0.2 μm filtered solution in PBS with Trehalose. *Small pack size (SP) is supplied either lyophilized or as a 0.2 µm filtered solution in PBS.
Shipping
Lyophilized product is shipped at ambient temperature. Liquid small pack size (-SP) is shipped with polar packs. Upon receipt, store immediately at the temperature recommended below.
Stability & Storage
Use a manual defrost freezer and avoid repeated freeze-thaw cycles.
- 12 months from date of receipt, -20 to -70 °C as supplied.
- 1 month, 2 to 8 °C under sterile conditions after reconstitution.
- 6 months, -20 to -70 °C under sterile conditions after reconstitution.
Calculators
Background: CIS-1
Long Name
Cytokine Inducible SH2-containing Protein
Alternate Names
CISH
Gene Symbol
CISH
UniProt
Additional CIS-1 Products
Product Documents for Human CIS-1 Antibody
Certificate of Analysis
To download a Certificate of Analysis, please enter a lot or batch number in the search box below.
Note: Certificate of Analysis not available for kit components.
Product Specific Notices for Human CIS-1 Antibody
For research use only
Related Research Areas
Citations for Human CIS-1 Antibody
 Powered by Bioz
Customer Reviews for Human CIS-1 Antibody (1)
1 out of 5
1 Customer Rating
Have you used Human CIS-1 Antibody?
Submit a review and receive an Amazon gift card!
$25/€18/£15/$25CAN/¥2500 for a review with an image
$10/€7/£6/$10CAN/¥1110 for a review without an image
Submit a review
Customer Images

Showing
1
-
1 of
1 review
Showing All
Filter By:
-
Application: Simple WesternSample Tested: Hek 293T cell lysateSpecies: HumanVerified Customer | Posted 08/06/2021HEK937T transfected with SOCS1 WT lysates 4 types of lysis : NP40/LAEMMLI/CHAPS/TRITON
 Bio-Techne ResponseThis review was submitted through the legacy Novus Innovators Program, reflecting a new species or application tested on a primary antibody.
There are no reviews that match your criteria.
Protocols
Find general support by application which include: protocols, troubleshooting, illustrated assays, videos and webinars.
- Appropriate Fixation of IHC/ICC Samples
- Cellular Response to Hypoxia Protocols
- ClariTSA™ Fluorophore Kits
- Detection & Visualization of Antibody Binding
- ICC Cell Smear Protocol for Suspension Cells
- ICC Immunocytochemistry Protocol Videos
- ICC for Adherent Cells
- Immunocytochemistry (ICC) Protocol
- Immunocytochemistry Troubleshooting
- Immunofluorescence of Organoids Embedded in Cultrex Basement Membrane Extract
- Immunohistochemistry (IHC) and Immunocytochemistry (ICC) Protocols
- Preparing Samples for IHC/ICC Experiments
- Preventing Non-Specific Staining (Non-Specific Binding)
- Primary Antibody Selection & Optimization
- Protocol for VisUCyte™ HRP Polymer Detection Reagent
- Protocol for the Fluorescent ICC Staining of Cell Smears - Graphic
- Protocol for the Fluorescent ICC Staining of Cultured Cells on Coverslips - Graphic
- Protocol for the Preparation and Fluorescent ICC Staining of Cells on Coverslips
- Protocol for the Preparation and Fluorescent ICC Staining of Non-adherent Cells
- Protocol for the Preparation and Fluorescent ICC Staining of Stem Cells on Coverslips
- Protocol for the Preparation of a Cell Smear for Non-adherent Cell ICC - Graphic
- R&D Systems Quality Control Western Blot Protocol
- TUNEL and Active Caspase-3 Detection by IHC/ICC Protocol
- The Importance of IHC/ICC Controls
- Troubleshooting Guide: Western Blot Figures
- Western Blot Conditions
- Western Blot Protocol
- Western Blot Protocol for Cell Lysates
- Western Blot Troubleshooting
- Western Blot Troubleshooting Guide
- View all Protocols, Troubleshooting, Illustrated assays and Webinars
Loading...