
Human Hemoglobin Antibody
R&D Systems | Catalog # G-134-C

Scientific images may be resized, cropped, or adjusted for brightness or contrast for presentation purposes. These updates are limited to presentation and do not affect the underlying scientific interpretation of the data. Where available, additional source data may be provided upon request.
Key Product Details
Species Reactivity
Validated:
Cited:
Applications
Label
Antibody Source
Product Specifications
Immunogen
Clonality
Host
Isotype
Scientific Data Images for Human Hemoglobin Antibody
Detection of Human Hemoglobin by Immunohistochemistry
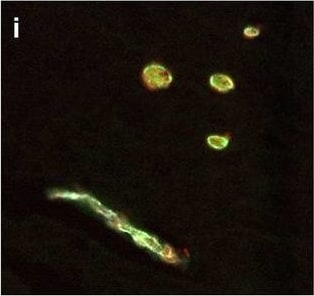
Neurovascular unit component expression in leaked versus non-leaked vessels along the spinal cord axis. Immunohistochemical labelling of neurovascular unit markers in ALS spinal cord (a–l); tight junctions claudin-5 (a, g) and ZO-1 (b, h), efflux pump P-glycoprotein (c, i), basement membrane marker collagen IV (d, j), and astrocyte markers aquaporin 4 (e, k) and GFAP (f, l), in spinal cord vessels with or without hemoglobin leakage. Scale bar = 50 µm. Automated quantification of average intensity staining of neurovascular unit markers was carried out in all ALS cases (n = 13) or in a subset of ALS cases with high hemoglobin leakage (n = 5) in leaked and non-leaked areas of the white and gray matter of the spinal cord (m–r). Composite of original images showing anti-hemoglobin immunoreactivity (red) and lectin-positive vessels (green) (m) and overlays of hemoglobin leakage analysis output (white, partly transparent) over anti-hemoglobin (red) (n). Segmentation of vessels inside (magenta) or outside (white) areas of hemoglobin leakage in the white matter (o) or gray matter (p). Dashed lines show boundaries. Scale bar = 1 mm. Perivascular astrocyte endfeet staining (green) around lectin-positive vessels (white) in (q) was isolated using an automated mask of the glia limitans (r). Scale bar = 50 µm. The average intensities of marker staining were measured in leaked and non-leaked vessels of the gray and white matter (s–x). Data shown as mean ± SD (n = 5 or 13) with statistical significance determined with a two-way repeated-measures ANOVA with Sidak’s post-test. ns = not significant Image collected and cropped by CiteAb from the following open publication (https://pubmed.ncbi.nlm.nih.gov/34446086), licensed under a CC-BY license. Not internally tested by R&D Systems.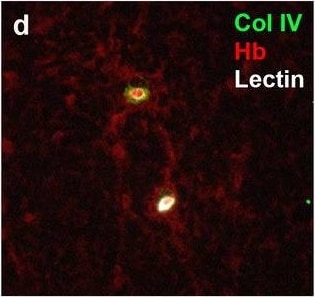
Detection of Human Hemoglobin by Immunohistochemistry
Neurovascular unit component expression in leaked versus non-leaked vessels along the spinal cord axis. Immunohistochemical labelling of neurovascular unit markers in ALS spinal cord (a–l); tight junctions claudin-5 (a, g) and ZO-1 (b, h), efflux pump P-glycoprotein (c, i), basement membrane marker collagen IV (d, j), and astrocyte markers aquaporin 4 (e, k) and GFAP (f, l), in spinal cord vessels with or without hemoglobin leakage. Scale bar = 50 µm. Automated quantification of average intensity staining of neurovascular unit markers was carried out in all ALS cases (n = 13) or in a subset of ALS cases with high hemoglobin leakage (n = 5) in leaked and non-leaked areas of the white and gray matter of the spinal cord (m–r). Composite of original images showing anti-hemoglobin immunoreactivity (red) and lectin-positive vessels (green) (m) and overlays of hemoglobin leakage analysis output (white, partly transparent) over anti-hemoglobin (red) (n). Segmentation of vessels inside (magenta) or outside (white) areas of hemoglobin leakage in the white matter (o) or gray matter (p). Dashed lines show boundaries. Scale bar = 1 mm. Perivascular astrocyte endfeet staining (green) around lectin-positive vessels (white) in (q) was isolated using an automated mask of the glia limitans (r). Scale bar = 50 µm. The average intensities of marker staining were measured in leaked and non-leaked vessels of the gray and white matter (s–x). Data shown as mean ± SD (n = 5 or 13) with statistical significance determined with a two-way repeated-measures ANOVA with Sidak’s post-test. ns = not significant Image collected and cropped by CiteAb from the following open publication (https://pubmed.ncbi.nlm.nih.gov/34446086), licensed under a CC-BY license. Not internally tested by R&D Systems.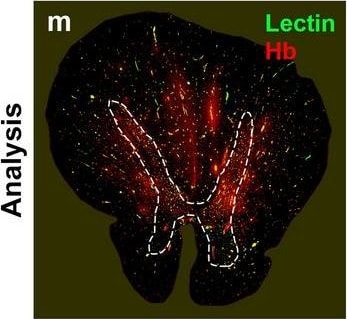
Detection of Human Hemoglobin by Immunohistochemistry
Neurovascular unit component expression in leaked versus non-leaked vessels along the spinal cord axis. Immunohistochemical labelling of neurovascular unit markers in ALS spinal cord (a–l); tight junctions claudin-5 (a, g) and ZO-1 (b, h), efflux pump P-glycoprotein (c, i), basement membrane marker collagen IV (d, j), and astrocyte markers aquaporin 4 (e, k) and GFAP (f, l), in spinal cord vessels with or without hemoglobin leakage. Scale bar = 50 µm. Automated quantification of average intensity staining of neurovascular unit markers was carried out in all ALS cases (n = 13) or in a subset of ALS cases with high hemoglobin leakage (n = 5) in leaked and non-leaked areas of the white and gray matter of the spinal cord (m–r). Composite of original images showing anti-hemoglobin immunoreactivity (red) and lectin-positive vessels (green) (m) and overlays of hemoglobin leakage analysis output (white, partly transparent) over anti-hemoglobin (red) (n). Segmentation of vessels inside (magenta) or outside (white) areas of hemoglobin leakage in the white matter (o) or gray matter (p). Dashed lines show boundaries. Scale bar = 1 mm. Perivascular astrocyte endfeet staining (green) around lectin-positive vessels (white) in (q) was isolated using an automated mask of the glia limitans (r). Scale bar = 50 µm. The average intensities of marker staining were measured in leaked and non-leaked vessels of the gray and white matter (s–x). Data shown as mean ± SD (n = 5 or 13) with statistical significance determined with a two-way repeated-measures ANOVA with Sidak’s post-test. ns = not significant Image collected and cropped by CiteAb from the following open publication (https://pubmed.ncbi.nlm.nih.gov/34446086), licensed under a CC-BY license. Not internally tested by R&D Systems.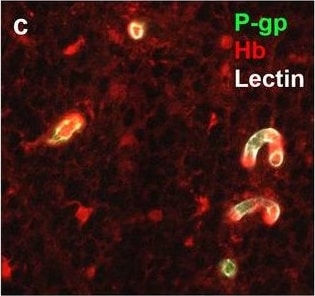
Detection of Human Hemoglobin by Immunohistochemistry
Neurovascular unit component expression in leaked versus non-leaked vessels along the spinal cord axis. Immunohistochemical labelling of neurovascular unit markers in ALS spinal cord (a–l); tight junctions claudin-5 (a, g) and ZO-1 (b, h), efflux pump P-glycoprotein (c, i), basement membrane marker collagen IV (d, j), and astrocyte markers aquaporin 4 (e, k) and GFAP (f, l), in spinal cord vessels with or without hemoglobin leakage. Scale bar = 50 µm. Automated quantification of average intensity staining of neurovascular unit markers was carried out in all ALS cases (n = 13) or in a subset of ALS cases with high hemoglobin leakage (n = 5) in leaked and non-leaked areas of the white and gray matter of the spinal cord (m–r). Composite of original images showing anti-hemoglobin immunoreactivity (red) and lectin-positive vessels (green) (m) and overlays of hemoglobin leakage analysis output (white, partly transparent) over anti-hemoglobin (red) (n). Segmentation of vessels inside (magenta) or outside (white) areas of hemoglobin leakage in the white matter (o) or gray matter (p). Dashed lines show boundaries. Scale bar = 1 mm. Perivascular astrocyte endfeet staining (green) around lectin-positive vessels (white) in (q) was isolated using an automated mask of the glia limitans (r). Scale bar = 50 µm. The average intensities of marker staining were measured in leaked and non-leaked vessels of the gray and white matter (s–x). Data shown as mean ± SD (n = 5 or 13) with statistical significance determined with a two-way repeated-measures ANOVA with Sidak’s post-test. ns = not significant Image collected and cropped by CiteAb from the following open publication (https://pubmed.ncbi.nlm.nih.gov/34446086), licensed under a CC-BY license. Not internally tested by R&D Systems.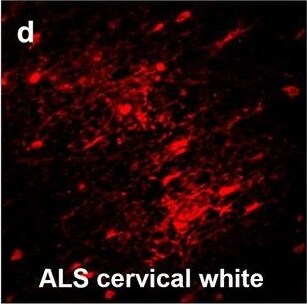
Detection of Human Hemoglobin by Immunohistochemistry
Hemoglobin localization in control and ALS spinal cord. Immunohistochemical staining of hemoglobin extravasation in cervical white matter from control (a–c) or ALS (d–f) spinal cord. Hemoglobin immunoreactivity (red) and lectin-positive vessels (green) are shown with a Hoechst nuclear counterstain (blue). Scale bars = 50 µm. Representative images of full spinal cord sections from the cervical level of a control case with no hemoglobin leakage (g), the thoracic level of an ALS case with white matter hemoglobin leakage (h), and the lumbar level of an ALS case with gray matter hemoglobin leakage (i) are shown. Dashed lines show gray matter boundary; scale bar = 1 mm. Occasional hemoglobin staining of SMI-32-positive anterior horn motor neurons was also observed (j–m). White arrowhead indicates a SMI-32-positive hemoglobin-positive motor neuron, where the red arrow indicates an SMI-32-positive hemoglobin-negative motor neuron. Scale bars = 50 µm Image collected and cropped by CiteAb from the following open publication (https://pubmed.ncbi.nlm.nih.gov/34446086), licensed under a CC-BY license. Not internally tested by R&D Systems.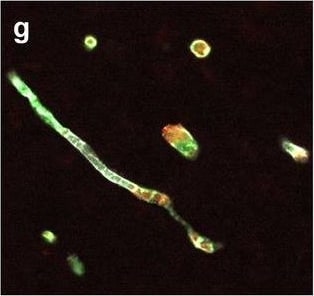
Detection of Human Hemoglobin by Immunohistochemistry
Neurovascular unit component expression in leaked versus non-leaked vessels along the spinal cord axis. Immunohistochemical labelling of neurovascular unit markers in ALS spinal cord (a–l); tight junctions claudin-5 (a, g) and ZO-1 (b, h), efflux pump P-glycoprotein (c, i), basement membrane marker collagen IV (d, j), and astrocyte markers aquaporin 4 (e, k) and GFAP (f, l), in spinal cord vessels with or without hemoglobin leakage. Scale bar = 50 µm. Automated quantification of average intensity staining of neurovascular unit markers was carried out in all ALS cases (n = 13) or in a subset of ALS cases with high hemoglobin leakage (n = 5) in leaked and non-leaked areas of the white and gray matter of the spinal cord (m–r). Composite of original images showing anti-hemoglobin immunoreactivity (red) and lectin-positive vessels (green) (m) and overlays of hemoglobin leakage analysis output (white, partly transparent) over anti-hemoglobin (red) (n). Segmentation of vessels inside (magenta) or outside (white) areas of hemoglobin leakage in the white matter (o) or gray matter (p). Dashed lines show boundaries. Scale bar = 1 mm. Perivascular astrocyte endfeet staining (green) around lectin-positive vessels (white) in (q) was isolated using an automated mask of the glia limitans (r). Scale bar = 50 µm. The average intensities of marker staining were measured in leaked and non-leaked vessels of the gray and white matter (s–x). Data shown as mean ± SD (n = 5 or 13) with statistical significance determined with a two-way repeated-measures ANOVA with Sidak’s post-test. ns = not significant Image collected and cropped by CiteAb from the following open publication (https://pubmed.ncbi.nlm.nih.gov/34446086), licensed under a CC-BY license. Not internally tested by R&D Systems.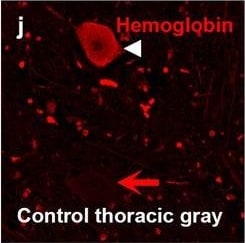
Detection of Human Hemoglobin by Immunohistochemistry
Hemoglobin localization in control and ALS spinal cord. Immunohistochemical staining of hemoglobin extravasation in cervical white matter from control (a–c) or ALS (d–f) spinal cord. Hemoglobin immunoreactivity (red) and lectin-positive vessels (green) are shown with a Hoechst nuclear counterstain (blue). Scale bars = 50 µm. Representative images of full spinal cord sections from the cervical level of a control case with no hemoglobin leakage (g), the thoracic level of an ALS case with white matter hemoglobin leakage (h), and the lumbar level of an ALS case with gray matter hemoglobin leakage (i) are shown. Dashed lines show gray matter boundary; scale bar = 1 mm. Occasional hemoglobin staining of SMI-32-positive anterior horn motor neurons was also observed (j–m). White arrowhead indicates a SMI-32-positive hemoglobin-positive motor neuron, where the red arrow indicates an SMI-32-positive hemoglobin-negative motor neuron. Scale bars = 50 µm Image collected and cropped by CiteAb from the following open publication (https://pubmed.ncbi.nlm.nih.gov/34446086), licensed under a CC-BY license. Not internally tested by R&D Systems.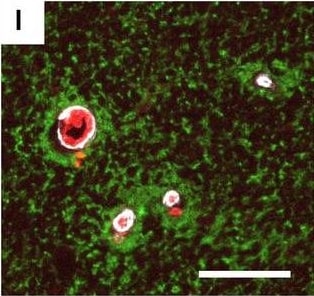
Detection of Human Hemoglobin by Immunohistochemistry
Neurovascular unit component expression in leaked versus non-leaked vessels along the spinal cord axis. Immunohistochemical labelling of neurovascular unit markers in ALS spinal cord (a–l); tight junctions claudin-5 (a, g) and ZO-1 (b, h), efflux pump P-glycoprotein (c, i), basement membrane marker collagen IV (d, j), and astrocyte markers aquaporin 4 (e, k) and GFAP (f, l), in spinal cord vessels with or without hemoglobin leakage. Scale bar = 50 µm. Automated quantification of average intensity staining of neurovascular unit markers was carried out in all ALS cases (n = 13) or in a subset of ALS cases with high hemoglobin leakage (n = 5) in leaked and non-leaked areas of the white and gray matter of the spinal cord (m–r). Composite of original images showing anti-hemoglobin immunoreactivity (red) and lectin-positive vessels (green) (m) and overlays of hemoglobin leakage analysis output (white, partly transparent) over anti-hemoglobin (red) (n). Segmentation of vessels inside (magenta) or outside (white) areas of hemoglobin leakage in the white matter (o) or gray matter (p). Dashed lines show boundaries. Scale bar = 1 mm. Perivascular astrocyte endfeet staining (green) around lectin-positive vessels (white) in (q) was isolated using an automated mask of the glia limitans (r). Scale bar = 50 µm. The average intensities of marker staining were measured in leaked and non-leaked vessels of the gray and white matter (s–x). Data shown as mean ± SD (n = 5 or 13) with statistical significance determined with a two-way repeated-measures ANOVA with Sidak’s post-test. ns = not significant Image collected and cropped by CiteAb from the following open publication (https://pubmed.ncbi.nlm.nih.gov/34446086), licensed under a CC-BY license. Not internally tested by R&D Systems.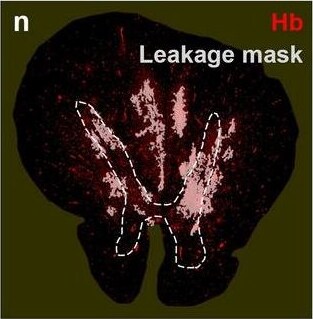
Detection of Human Hemoglobin by Immunohistochemistry
Neurovascular unit component expression in leaked versus non-leaked vessels along the spinal cord axis. Immunohistochemical labelling of neurovascular unit markers in ALS spinal cord (a–l); tight junctions claudin-5 (a, g) and ZO-1 (b, h), efflux pump P-glycoprotein (c, i), basement membrane marker collagen IV (d, j), and astrocyte markers aquaporin 4 (e, k) and GFAP (f, l), in spinal cord vessels with or without hemoglobin leakage. Scale bar = 50 µm. Automated quantification of average intensity staining of neurovascular unit markers was carried out in all ALS cases (n = 13) or in a subset of ALS cases with high hemoglobin leakage (n = 5) in leaked and non-leaked areas of the white and gray matter of the spinal cord (m–r). Composite of original images showing anti-hemoglobin immunoreactivity (red) and lectin-positive vessels (green) (m) and overlays of hemoglobin leakage analysis output (white, partly transparent) over anti-hemoglobin (red) (n). Segmentation of vessels inside (magenta) or outside (white) areas of hemoglobin leakage in the white matter (o) or gray matter (p). Dashed lines show boundaries. Scale bar = 1 mm. Perivascular astrocyte endfeet staining (green) around lectin-positive vessels (white) in (q) was isolated using an automated mask of the glia limitans (r). Scale bar = 50 µm. The average intensities of marker staining were measured in leaked and non-leaked vessels of the gray and white matter (s–x). Data shown as mean ± SD (n = 5 or 13) with statistical significance determined with a two-way repeated-measures ANOVA with Sidak’s post-test. ns = not significant Image collected and cropped by CiteAb from the following open publication (https://pubmed.ncbi.nlm.nih.gov/34446086), licensed under a CC-BY license. Not internally tested by R&D Systems.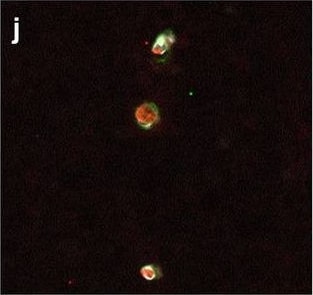
Detection of Human Hemoglobin by Immunohistochemistry
Neurovascular unit component expression in leaked versus non-leaked vessels along the spinal cord axis. Immunohistochemical labelling of neurovascular unit markers in ALS spinal cord (a–l); tight junctions claudin-5 (a, g) and ZO-1 (b, h), efflux pump P-glycoprotein (c, i), basement membrane marker collagen IV (d, j), and astrocyte markers aquaporin 4 (e, k) and GFAP (f, l), in spinal cord vessels with or without hemoglobin leakage. Scale bar = 50 µm. Automated quantification of average intensity staining of neurovascular unit markers was carried out in all ALS cases (n = 13) or in a subset of ALS cases with high hemoglobin leakage (n = 5) in leaked and non-leaked areas of the white and gray matter of the spinal cord (m–r). Composite of original images showing anti-hemoglobin immunoreactivity (red) and lectin-positive vessels (green) (m) and overlays of hemoglobin leakage analysis output (white, partly transparent) over anti-hemoglobin (red) (n). Segmentation of vessels inside (magenta) or outside (white) areas of hemoglobin leakage in the white matter (o) or gray matter (p). Dashed lines show boundaries. Scale bar = 1 mm. Perivascular astrocyte endfeet staining (green) around lectin-positive vessels (white) in (q) was isolated using an automated mask of the glia limitans (r). Scale bar = 50 µm. The average intensities of marker staining were measured in leaked and non-leaked vessels of the gray and white matter (s–x). Data shown as mean ± SD (n = 5 or 13) with statistical significance determined with a two-way repeated-measures ANOVA with Sidak’s post-test. ns = not significant Image collected and cropped by CiteAb from the following open publication (https://pubmed.ncbi.nlm.nih.gov/34446086), licensed under a CC-BY license. Not internally tested by R&D Systems.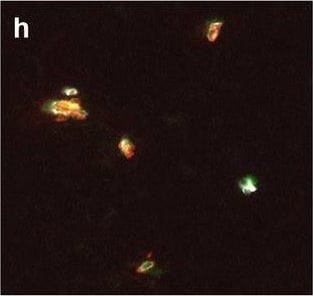
Detection of Human Hemoglobin by Immunohistochemistry
Neurovascular unit component expression in leaked versus non-leaked vessels along the spinal cord axis. Immunohistochemical labelling of neurovascular unit markers in ALS spinal cord (a–l); tight junctions claudin-5 (a, g) and ZO-1 (b, h), efflux pump P-glycoprotein (c, i), basement membrane marker collagen IV (d, j), and astrocyte markers aquaporin 4 (e, k) and GFAP (f, l), in spinal cord vessels with or without hemoglobin leakage. Scale bar = 50 µm. Automated quantification of average intensity staining of neurovascular unit markers was carried out in all ALS cases (n = 13) or in a subset of ALS cases with high hemoglobin leakage (n = 5) in leaked and non-leaked areas of the white and gray matter of the spinal cord (m–r). Composite of original images showing anti-hemoglobin immunoreactivity (red) and lectin-positive vessels (green) (m) and overlays of hemoglobin leakage analysis output (white, partly transparent) over anti-hemoglobin (red) (n). Segmentation of vessels inside (magenta) or outside (white) areas of hemoglobin leakage in the white matter (o) or gray matter (p). Dashed lines show boundaries. Scale bar = 1 mm. Perivascular astrocyte endfeet staining (green) around lectin-positive vessels (white) in (q) was isolated using an automated mask of the glia limitans (r). Scale bar = 50 µm. The average intensities of marker staining were measured in leaked and non-leaked vessels of the gray and white matter (s–x). Data shown as mean ± SD (n = 5 or 13) with statistical significance determined with a two-way repeated-measures ANOVA with Sidak’s post-test. ns = not significant Image collected and cropped by CiteAb from the following open publication (https://pubmed.ncbi.nlm.nih.gov/34446086), licensed under a CC-BY license. Not internally tested by R&D Systems.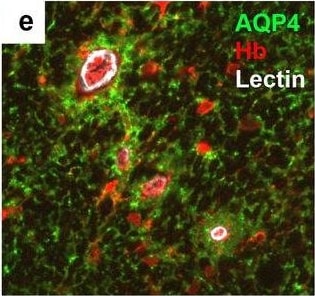
Detection of Human Hemoglobin by Immunohistochemistry
Neurovascular unit component expression in leaked versus non-leaked vessels along the spinal cord axis. Immunohistochemical labelling of neurovascular unit markers in ALS spinal cord (a–l); tight junctions claudin-5 (a, g) and ZO-1 (b, h), efflux pump P-glycoprotein (c, i), basement membrane marker collagen IV (d, j), and astrocyte markers aquaporin 4 (e, k) and GFAP (f, l), in spinal cord vessels with or without hemoglobin leakage. Scale bar = 50 µm. Automated quantification of average intensity staining of neurovascular unit markers was carried out in all ALS cases (n = 13) or in a subset of ALS cases with high hemoglobin leakage (n = 5) in leaked and non-leaked areas of the white and gray matter of the spinal cord (m–r). Composite of original images showing anti-hemoglobin immunoreactivity (red) and lectin-positive vessels (green) (m) and overlays of hemoglobin leakage analysis output (white, partly transparent) over anti-hemoglobin (red) (n). Segmentation of vessels inside (magenta) or outside (white) areas of hemoglobin leakage in the white matter (o) or gray matter (p). Dashed lines show boundaries. Scale bar = 1 mm. Perivascular astrocyte endfeet staining (green) around lectin-positive vessels (white) in (q) was isolated using an automated mask of the glia limitans (r). Scale bar = 50 µm. The average intensities of marker staining were measured in leaked and non-leaked vessels of the gray and white matter (s–x). Data shown as mean ± SD (n = 5 or 13) with statistical significance determined with a two-way repeated-measures ANOVA with Sidak’s post-test. ns = not significant Image collected and cropped by CiteAb from the following open publication (https://pubmed.ncbi.nlm.nih.gov/34446086), licensed under a CC-BY license. Not internally tested by R&D Systems.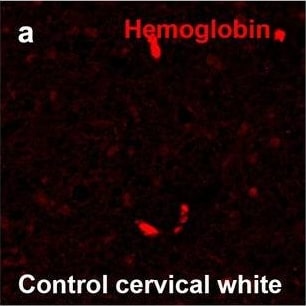
Detection of Human Hemoglobin by Immunohistochemistry
Hemoglobin localization in control and ALS spinal cord. Immunohistochemical staining of hemoglobin extravasation in cervical white matter from control (a–c) or ALS (d–f) spinal cord. Hemoglobin immunoreactivity (red) and lectin-positive vessels (green) are shown with a Hoechst nuclear counterstain (blue). Scale bars = 50 µm. Representative images of full spinal cord sections from the cervical level of a control case with no hemoglobin leakage (g), the thoracic level of an ALS case with white matter hemoglobin leakage (h), and the lumbar level of an ALS case with gray matter hemoglobin leakage (i) are shown. Dashed lines show gray matter boundary; scale bar = 1 mm. Occasional hemoglobin staining of SMI-32-positive anterior horn motor neurons was also observed (j–m). White arrowhead indicates a SMI-32-positive hemoglobin-positive motor neuron, where the red arrow indicates an SMI-32-positive hemoglobin-negative motor neuron. Scale bars = 50 µm Image collected and cropped by CiteAb from the following open publication (https://pubmed.ncbi.nlm.nih.gov/34446086), licensed under a CC-BY license. Not internally tested by R&D Systems.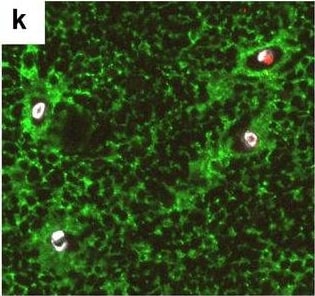
Detection of Human Hemoglobin by Immunohistochemistry
Neurovascular unit component expression in leaked versus non-leaked vessels along the spinal cord axis. Immunohistochemical labelling of neurovascular unit markers in ALS spinal cord (a–l); tight junctions claudin-5 (a, g) and ZO-1 (b, h), efflux pump P-glycoprotein (c, i), basement membrane marker collagen IV (d, j), and astrocyte markers aquaporin 4 (e, k) and GFAP (f, l), in spinal cord vessels with or without hemoglobin leakage. Scale bar = 50 µm. Automated quantification of average intensity staining of neurovascular unit markers was carried out in all ALS cases (n = 13) or in a subset of ALS cases with high hemoglobin leakage (n = 5) in leaked and non-leaked areas of the white and gray matter of the spinal cord (m–r). Composite of original images showing anti-hemoglobin immunoreactivity (red) and lectin-positive vessels (green) (m) and overlays of hemoglobin leakage analysis output (white, partly transparent) over anti-hemoglobin (red) (n). Segmentation of vessels inside (magenta) or outside (white) areas of hemoglobin leakage in the white matter (o) or gray matter (p). Dashed lines show boundaries. Scale bar = 1 mm. Perivascular astrocyte endfeet staining (green) around lectin-positive vessels (white) in (q) was isolated using an automated mask of the glia limitans (r). Scale bar = 50 µm. The average intensities of marker staining were measured in leaked and non-leaked vessels of the gray and white matter (s–x). Data shown as mean ± SD (n = 5 or 13) with statistical significance determined with a two-way repeated-measures ANOVA with Sidak’s post-test. ns = not significant Image collected and cropped by CiteAb from the following open publication (https://pubmed.ncbi.nlm.nih.gov/34446086), licensed under a CC-BY license. Not internally tested by R&D Systems.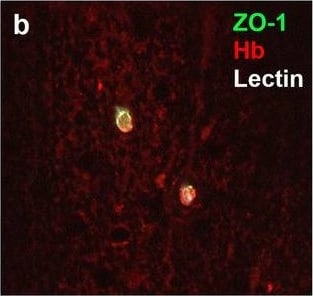
Detection of Human Hemoglobin by Immunohistochemistry
Neurovascular unit component expression in leaked versus non-leaked vessels along the spinal cord axis. Immunohistochemical labelling of neurovascular unit markers in ALS spinal cord (a–l); tight junctions claudin-5 (a, g) and ZO-1 (b, h), efflux pump P-glycoprotein (c, i), basement membrane marker collagen IV (d, j), and astrocyte markers aquaporin 4 (e, k) and GFAP (f, l), in spinal cord vessels with or without hemoglobin leakage. Scale bar = 50 µm. Automated quantification of average intensity staining of neurovascular unit markers was carried out in all ALS cases (n = 13) or in a subset of ALS cases with high hemoglobin leakage (n = 5) in leaked and non-leaked areas of the white and gray matter of the spinal cord (m–r). Composite of original images showing anti-hemoglobin immunoreactivity (red) and lectin-positive vessels (green) (m) and overlays of hemoglobin leakage analysis output (white, partly transparent) over anti-hemoglobin (red) (n). Segmentation of vessels inside (magenta) or outside (white) areas of hemoglobin leakage in the white matter (o) or gray matter (p). Dashed lines show boundaries. Scale bar = 1 mm. Perivascular astrocyte endfeet staining (green) around lectin-positive vessels (white) in (q) was isolated using an automated mask of the glia limitans (r). Scale bar = 50 µm. The average intensities of marker staining were measured in leaked and non-leaked vessels of the gray and white matter (s–x). Data shown as mean ± SD (n = 5 or 13) with statistical significance determined with a two-way repeated-measures ANOVA with Sidak’s post-test. ns = not significant Image collected and cropped by CiteAb from the following open publication (https://pubmed.ncbi.nlm.nih.gov/34446086), licensed under a CC-BY license. Not internally tested by R&D Systems.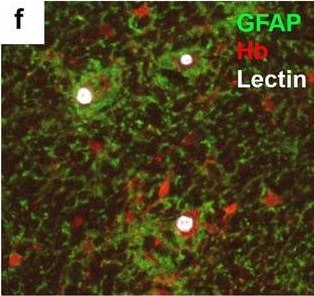
Detection of Human Hemoglobin by Immunohistochemistry
Neurovascular unit component expression in leaked versus non-leaked vessels along the spinal cord axis. Immunohistochemical labelling of neurovascular unit markers in ALS spinal cord (a–l); tight junctions claudin-5 (a, g) and ZO-1 (b, h), efflux pump P-glycoprotein (c, i), basement membrane marker collagen IV (d, j), and astrocyte markers aquaporin 4 (e, k) and GFAP (f, l), in spinal cord vessels with or without hemoglobin leakage. Scale bar = 50 µm. Automated quantification of average intensity staining of neurovascular unit markers was carried out in all ALS cases (n = 13) or in a subset of ALS cases with high hemoglobin leakage (n = 5) in leaked and non-leaked areas of the white and gray matter of the spinal cord (m–r). Composite of original images showing anti-hemoglobin immunoreactivity (red) and lectin-positive vessels (green) (m) and overlays of hemoglobin leakage analysis output (white, partly transparent) over anti-hemoglobin (red) (n). Segmentation of vessels inside (magenta) or outside (white) areas of hemoglobin leakage in the white matter (o) or gray matter (p). Dashed lines show boundaries. Scale bar = 1 mm. Perivascular astrocyte endfeet staining (green) around lectin-positive vessels (white) in (q) was isolated using an automated mask of the glia limitans (r). Scale bar = 50 µm. The average intensities of marker staining were measured in leaked and non-leaked vessels of the gray and white matter (s–x). Data shown as mean ± SD (n = 5 or 13) with statistical significance determined with a two-way repeated-measures ANOVA with Sidak’s post-test. ns = not significant Image collected and cropped by CiteAb from the following open publication (https://pubmed.ncbi.nlm.nih.gov/34446086), licensed under a CC-BY license. Not internally tested by R&D Systems.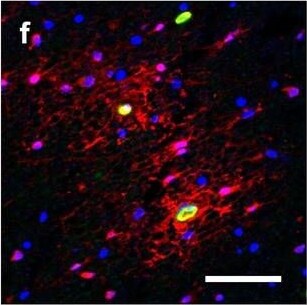
Detection of Human Hemoglobin by Immunohistochemistry
Hemoglobin localization in control and ALS spinal cord. Immunohistochemical staining of hemoglobin extravasation in cervical white matter from control (a–c) or ALS (d–f) spinal cord. Hemoglobin immunoreactivity (red) and lectin-positive vessels (green) are shown with a Hoechst nuclear counterstain (blue). Scale bars = 50 µm. Representative images of full spinal cord sections from the cervical level of a control case with no hemoglobin leakage (g), the thoracic level of an ALS case with white matter hemoglobin leakage (h), and the lumbar level of an ALS case with gray matter hemoglobin leakage (i) are shown. Dashed lines show gray matter boundary; scale bar = 1 mm. Occasional hemoglobin staining of SMI-32-positive anterior horn motor neurons was also observed (j–m). White arrowhead indicates a SMI-32-positive hemoglobin-positive motor neuron, where the red arrow indicates an SMI-32-positive hemoglobin-negative motor neuron. Scale bars = 50 µm Image collected and cropped by CiteAb from the following open publication (https://pubmed.ncbi.nlm.nih.gov/34446086), licensed under a CC-BY license. Not internally tested by R&D Systems.Formulation, Preparation, and Storage
Purification
Reconstitution
Reconstitute with sterile PBS. If 0.5 mL of PBS is used, the antibody concentration will be 0.2 mg/mL.
Formulation
Shipping
Stability & Storage
- 12 months from date of receipt, -20 to -70 °C as supplied.
- 1 month, 2 to 8 °C under sterile conditions after reconstitution.
- 6 months, -20 to -70 °C under sterile conditions after reconstitution.
Calculators
Background: Hemoglobin
Alternate Names
Additional Hemoglobin Products
Product Documents for Human Hemoglobin Antibody
Certificate of Analysis
To download a Certificate of Analysis, please enter a lot or batch number in the search box below.
Note: Certificate of Analysis not available for kit components.
Product Specific Notices for Human Hemoglobin Antibody
For research use only
Related Research Areas
Citations for Human Hemoglobin Antibody
 Powered by Bioz
Customer Reviews for Human Hemoglobin Antibody
There are currently no reviews for this product. Be the first to review Human Hemoglobin Antibody and earn rewards!
Have you used Human Hemoglobin Antibody?
Submit a review and receive an Amazon gift card!
$25/€18/£15/$25CAN/¥2500 for a review with an image
$10/€7/£6/$10CAN/¥1110 for a review without an image
Submit a review