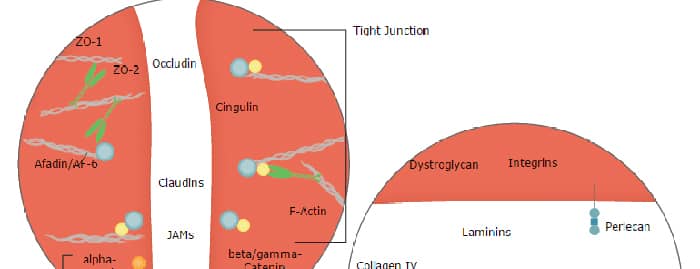
The Integrin alpha 6 subunit, also known as CD49f and VLA-6 alpha subunit, forms a heterodimer with Integrin beta 1 (CD29) or beta 4 (CD104) subunits and recognizes laminin as a ligand.
Integrin alpha 6/CD49f Antibody (GoH3)
R&D Systems | Catalog # MAB13501
Clone GoH3 was used by HLDA to establish CD designation

Scientific images may be resized, cropped, or adjusted for brightness or contrast for presentation purposes. These updates are limited to presentation and do not affect the underlying scientific interpretation of the data. Where available, additional source data may be provided upon request.
Key Product Details
Species Reactivity
Validated:
Human, Mouse, Bovine
Cited:
Human, Mouse, Porcine, Transgenic Mouse
Applications
Validated:
Immunohistochemistry, Blockade of Receptor-ligand Interaction, Flow Cytometry, CyTOF-reported
Cited:
Immunohistochemistry, Immunohistochemistry-Paraffin, Immunohistochemistry-Frozen, Neutralization, Flow Cytometry, Immunocytochemistry, Bioassay, Functional Assay
Label
Unconjugated
Antibody Source
Monoclonal Rat IgG2A Clone # GoH3
Loading...
Product Specifications
Immunogen
Mouse mammary tumor cells
Specificity
Detects human, mouse, and bovine Integrin alpha 6/CD49f. Recognizes an epitope in the extracellular domain of the Integrin alpha 6 subunit.
Clonality
Monoclonal
Host
Rat
Isotype
IgG2A
Endotoxin Level
<0.10 EU per 1 μg of the antibody by the LAL method.
Scientific Data Images for Integrin alpha 6/CD49f Antibody (GoH3)
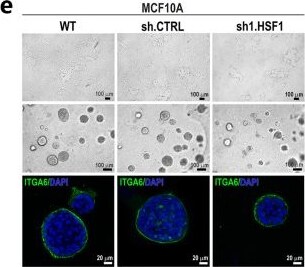
Detection of bnosnryjaefcltnlovp2.jpg by Immunocytochemistry/ Immunofluorescence
Effect of HSF1 down-regulation on the growth and ability to differentiate of MCF10A and MCF12A cells. (a) Western blot analysis of HSF1 expression in either unmodified (WT) cells and cells transduced with lentiviruses containing shRNAs: control (sh.CTRL) or targeting HSF1 (sh1.HSF1, sh2.HSF1). Actin (ACTB) was used as a protein loading control. The graphs below show the results of densitometric analyses (n = 3). (b) Proliferation rates (assessed with crystal violet staining) of MCF10A (n = 5) and MCF12A (n = 3) cell variants. (c) The number of Ki-67 positive cells in MCF10A cell variants (n = 3). (d) Senescence-associated beta -galactosidase activity (yielding blue color) analyzed in MCF10A cell variants (n = 3). Scale bar 50 μm. Morphology of MCF10A (e) MCF12A (g) cell variants cultured in 2D (upper panels) and Matrigel (middle and bottom panels). Phase-contrast images (upper and middle panels; scale bar 100 µm) and confocal images of spheroids stained for ITGA6 and DNA (bottom panel; scale bar 20 µm). Arrows point to representative acini with disruptive morphology, and arrowheads indicate representative acini with multi-acinar morphology. (f) The volume of spheroids formed in Matrigel by MCF10A cell variants. Boxplots represent the median, upper and lower quartiles, maximum and minimum. Statistically significant differences between unmodified cells, cells with empty vector or cells overexpressing HSF1 are marked. (h) Morphology of spheroids formed by MCF12A cell variants was distinguished as normal, disruptive and multi-acinar, as described by Ref [20]. *** p < 0.001, ** p < 0.01, * p < 0.05 (significance of differences). Original western blots are presented in File S1. Image collected and cropped by CiteAb from the following open publication (https://pubmed.ncbi.nlm.nih.gov/37894333), licensed under a CC-BY license. Not internally tested by R&D Systems.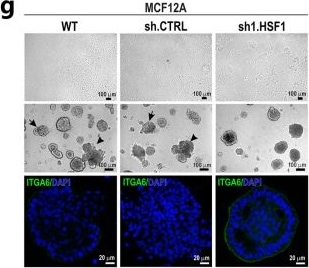
Detection of cbahzowni61yztxplzxs.jpg by Immunocytochemistry/ Immunofluorescence
Effect of HSF1 down-regulation on the growth and ability to differentiate of MCF10A and MCF12A cells. (a) Western blot analysis of HSF1 expression in either unmodified (WT) cells and cells transduced with lentiviruses containing shRNAs: control (sh.CTRL) or targeting HSF1 (sh1.HSF1, sh2.HSF1). Actin (ACTB) was used as a protein loading control. The graphs below show the results of densitometric analyses (n = 3). (b) Proliferation rates (assessed with crystal violet staining) of MCF10A (n = 5) and MCF12A (n = 3) cell variants. (c) The number of Ki-67 positive cells in MCF10A cell variants (n = 3). (d) Senescence-associated beta -galactosidase activity (yielding blue color) analyzed in MCF10A cell variants (n = 3). Scale bar 50 μm. Morphology of MCF10A (e) MCF12A (g) cell variants cultured in 2D (upper panels) and Matrigel (middle and bottom panels). Phase-contrast images (upper and middle panels; scale bar 100 µm) and confocal images of spheroids stained for ITGA6 and DNA (bottom panel; scale bar 20 µm). Arrows point to representative acini with disruptive morphology, and arrowheads indicate representative acini with multi-acinar morphology. (f) The volume of spheroids formed in Matrigel by MCF10A cell variants. Boxplots represent the median, upper and lower quartiles, maximum and minimum. Statistically significant differences between unmodified cells, cells with empty vector or cells overexpressing HSF1 are marked. (h) Morphology of spheroids formed by MCF12A cell variants was distinguished as normal, disruptive and multi-acinar, as described by Ref [20]. *** p < 0.001, ** p < 0.01, * p < 0.05 (significance of differences). Original western blots are presented in File S1. Image collected and cropped by CiteAb from the following open publication (https://pubmed.ncbi.nlm.nih.gov/37894333), licensed under a CC-BY license. Not internally tested by R&D Systems.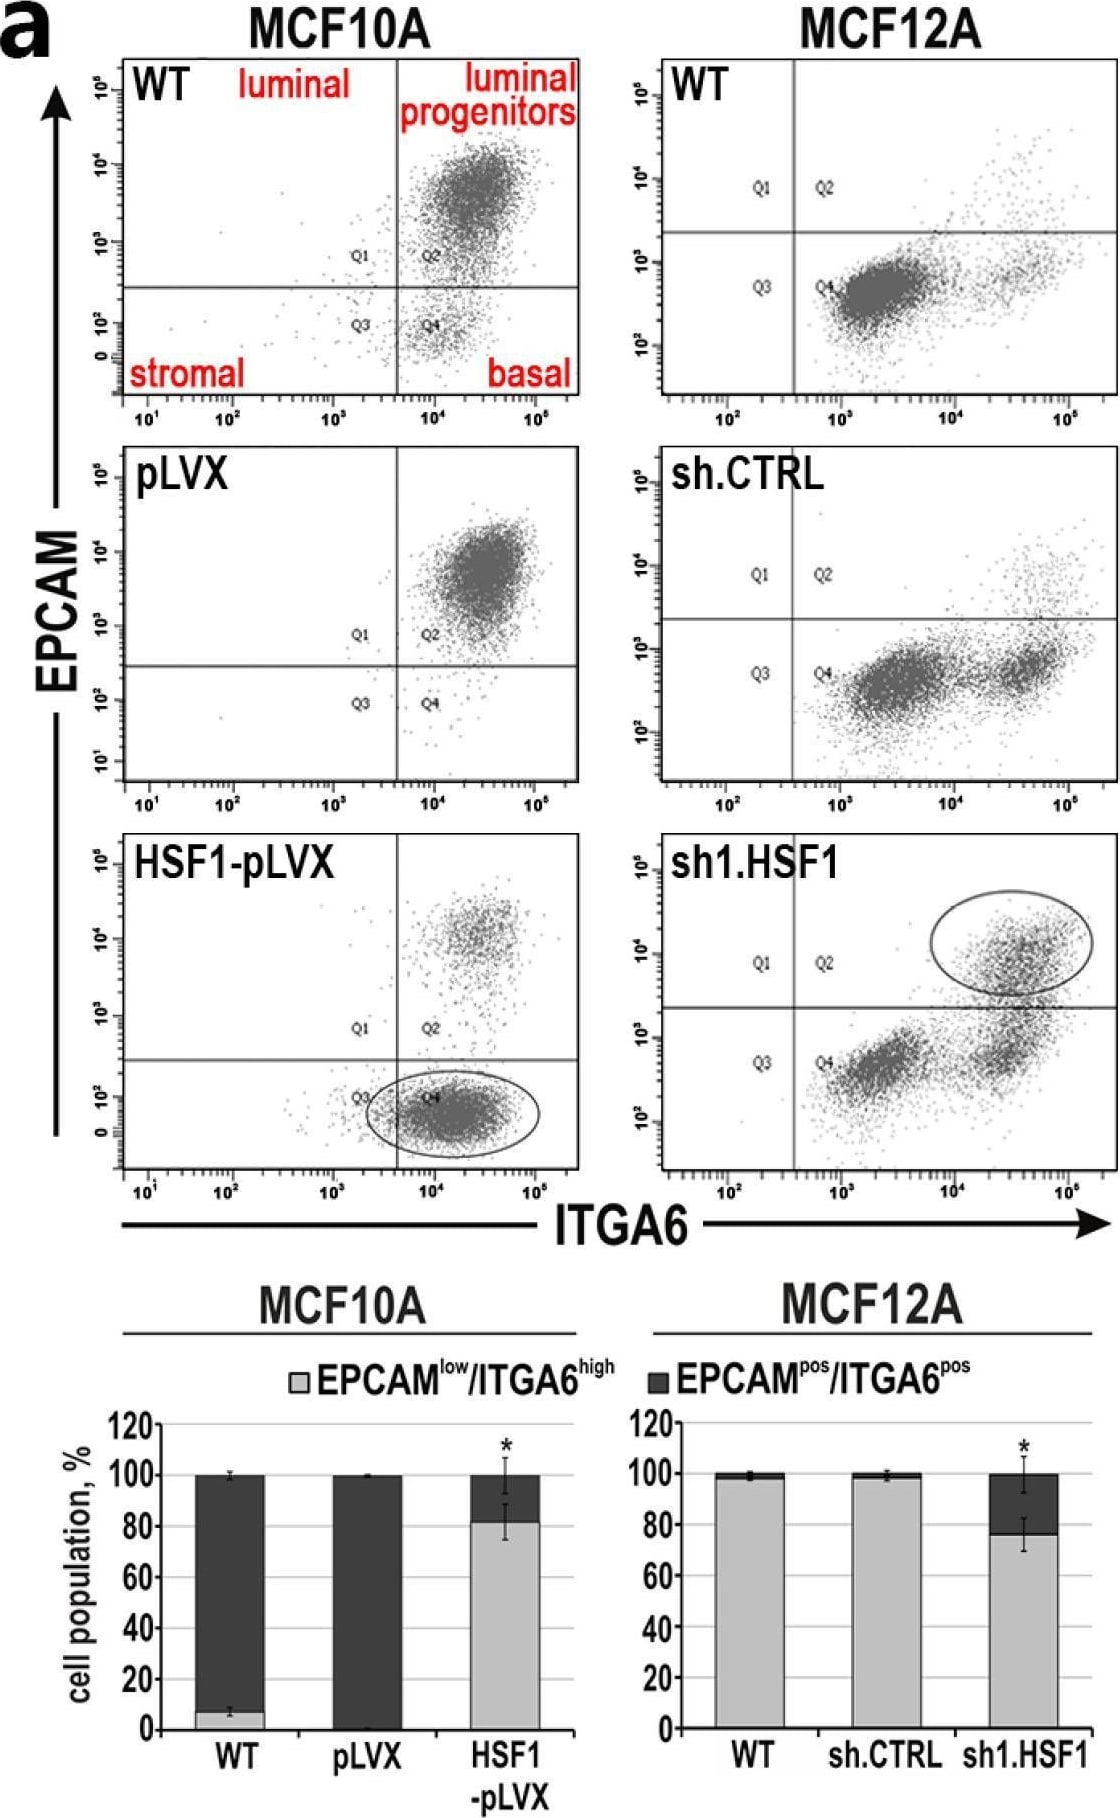
Detection of h0b3jom1ydnycg1hftz3.jpg by Flow Cytometry
Mesenchymal and stem cell-like characteristics of MCF10A and MCF12A cell variants with altered HSF1 expression. (a) Subpopulations defined by expression of EPCAM and ITGA6 or (b) CD24 and CD44 using flow cytometry. The percentages of subpopulations shown in the bar graphs are the mean ± SEM of three independent experiments. Ovals point out cell populations, which are enriched when HSF1 expression levels are altered. * p < 0.05 (significance of differences). Image collected and cropped by CiteAb from the following open publication (https://pubmed.ncbi.nlm.nih.gov/37894333), licensed under a CC-BY license. Not internally tested by R&D Systems.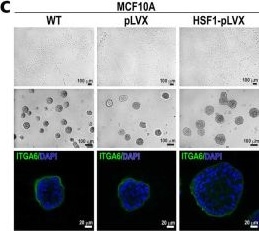
Detection of hbztgz90jr62iigxkbjk.jpg by Immunocytochemistry/ Immunofluorescence
HSF1 levels affect the expression of EMT markers and phenotype of MCF10A and MCF12A cells. (a) Western blot analysis of HSF1 and EMT markers in cells with overexpression (MCF10A) or knockdown (MCF12A) of HSF1. WT, unmodified cells; pLVX or shCTRL, cells transduced with lentiviruses containing the empty vector or control shRNA; HSF1-pLVX or sh1.HSF1, cells transduced with lentiviruses containing the HSF1 cDNA or shRNA targeting HSF1. ACTB and HSPA8 were used as loading controls. Graphs show the results of densitometric analyses (n = 3). (b) Proliferation rates assessed through crystal violet staining in MCF10A cell variants (n = 5). (c) Morphology of MCF10A cell variants in 2D culture (subconfluent; upper panel) and Matrigel (middle and bottom panels). Phase-contrast images (upper and middle panels; scale bar 100 µm) and confocal images of spheroids stained for ITGA6 and DNA (bottom panel). (d) The volume of spheroids formed in Matrigel by MCF10A cell variants. Boxplots represent the median, upper and lower quartiles, maximum and minimum. (e,f) Confocal images of spheroids grown in Matrigel for 14 or 21 days and stained for CDH1 and DNA (scale bar 20 µm and 50 µm, respectively). (g) Migratory capacity of MCF10A cell variants analyzed with Boyden chamber assay (n = 3). (h) Time of cell detachment from the plastic surface by trypsinization. Boxplots represent the median, upper and lower quartiles, maximum and minimum. *** p < 0.001, ** p < 0.01, * p < 0.05 (significance of differences). Original western blots are presented in File S1. Image collected and cropped by CiteAb from the following open publication (https://pubmed.ncbi.nlm.nih.gov/37894333), licensed under a CC-BY license. Not internally tested by R&D Systems.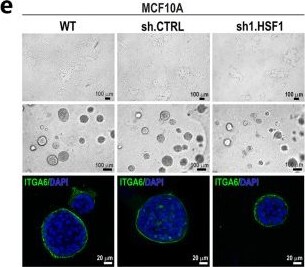
Detection of Integrin alpha 6/CD49f by Immunocytochemistry/ Immunofluorescence
Effect of HSF1 down-regulation on the growth and ability to differentiate of MCF10A and MCF12A cells. (a) Western blot analysis of HSF1 expression in either unmodified (WT) cells and cells transduced with lentiviruses containing shRNAs: control (sh.CTRL) or targeting HSF1 (sh1.HSF1, sh2.HSF1). Actin (ACTB) was used as a protein loading control. The graphs below show the results of densitometric analyses (n = 3). (b) Proliferation rates (assessed with crystal violet staining) of MCF10A (n = 5) and MCF12A (n = 3) cell variants. (c) The number of Ki-67 positive cells in MCF10A cell variants (n = 3). (d) Senescence-associated beta -galactosidase activity (yielding blue color) analyzed in MCF10A cell variants (n = 3). Scale bar 50 μm. Morphology of MCF10A (e) MCF12A (g) cell variants cultured in 2D (upper panels) and Matrigel (middle and bottom panels). Phase-contrast images (upper and middle panels; scale bar 100 µm) and confocal images of spheroids stained for ITGA6 and DNA (bottom panel; scale bar 20 µm). Arrows point to representative acini with disruptive morphology, and arrowheads indicate representative acini with multi-acinar morphology. (f) The volume of spheroids formed in Matrigel by MCF10A cell variants. Boxplots represent the median, upper and lower quartiles, maximum and minimum. Statistically significant differences between unmodified cells, cells with empty vector or cells overexpressing HSF1 are marked. (h) Morphology of spheroids formed by MCF12A cell variants was distinguished as normal, disruptive and multi-acinar, as described by Ref [20]. *** p < 0.001, ** p < 0.01, * p < 0.05 (significance of differences). Original western blots are presented in File S1. Image collected and cropped by CiteAb from the following open publication (https://pubmed.ncbi.nlm.nih.gov/37894333), licensed under a CC-BY license. Not internally tested by R&D Systems.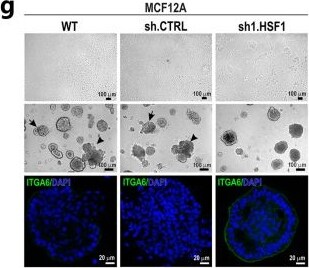
Detection of Integrin alpha 6/CD49f by Immunocytochemistry/ Immunofluorescence
Effect of HSF1 down-regulation on the growth and ability to differentiate of MCF10A and MCF12A cells. (a) Western blot analysis of HSF1 expression in either unmodified (WT) cells and cells transduced with lentiviruses containing shRNAs: control (sh.CTRL) or targeting HSF1 (sh1.HSF1, sh2.HSF1). Actin (ACTB) was used as a protein loading control. The graphs below show the results of densitometric analyses (n = 3). (b) Proliferation rates (assessed with crystal violet staining) of MCF10A (n = 5) and MCF12A (n = 3) cell variants. (c) The number of Ki-67 positive cells in MCF10A cell variants (n = 3). (d) Senescence-associated beta -galactosidase activity (yielding blue color) analyzed in MCF10A cell variants (n = 3). Scale bar 50 μm. Morphology of MCF10A (e) MCF12A (g) cell variants cultured in 2D (upper panels) and Matrigel (middle and bottom panels). Phase-contrast images (upper and middle panels; scale bar 100 µm) and confocal images of spheroids stained for ITGA6 and DNA (bottom panel; scale bar 20 µm). Arrows point to representative acini with disruptive morphology, and arrowheads indicate representative acini with multi-acinar morphology. (f) The volume of spheroids formed in Matrigel by MCF10A cell variants. Boxplots represent the median, upper and lower quartiles, maximum and minimum. Statistically significant differences between unmodified cells, cells with empty vector or cells overexpressing HSF1 are marked. (h) Morphology of spheroids formed by MCF12A cell variants was distinguished as normal, disruptive and multi-acinar, as described by Ref [20]. *** p < 0.001, ** p < 0.01, * p < 0.05 (significance of differences). Original western blots are presented in File S1. Image collected and cropped by CiteAb from the following open publication (https://pubmed.ncbi.nlm.nih.gov/37894333), licensed under a CC-BY license. Not internally tested by R&D Systems.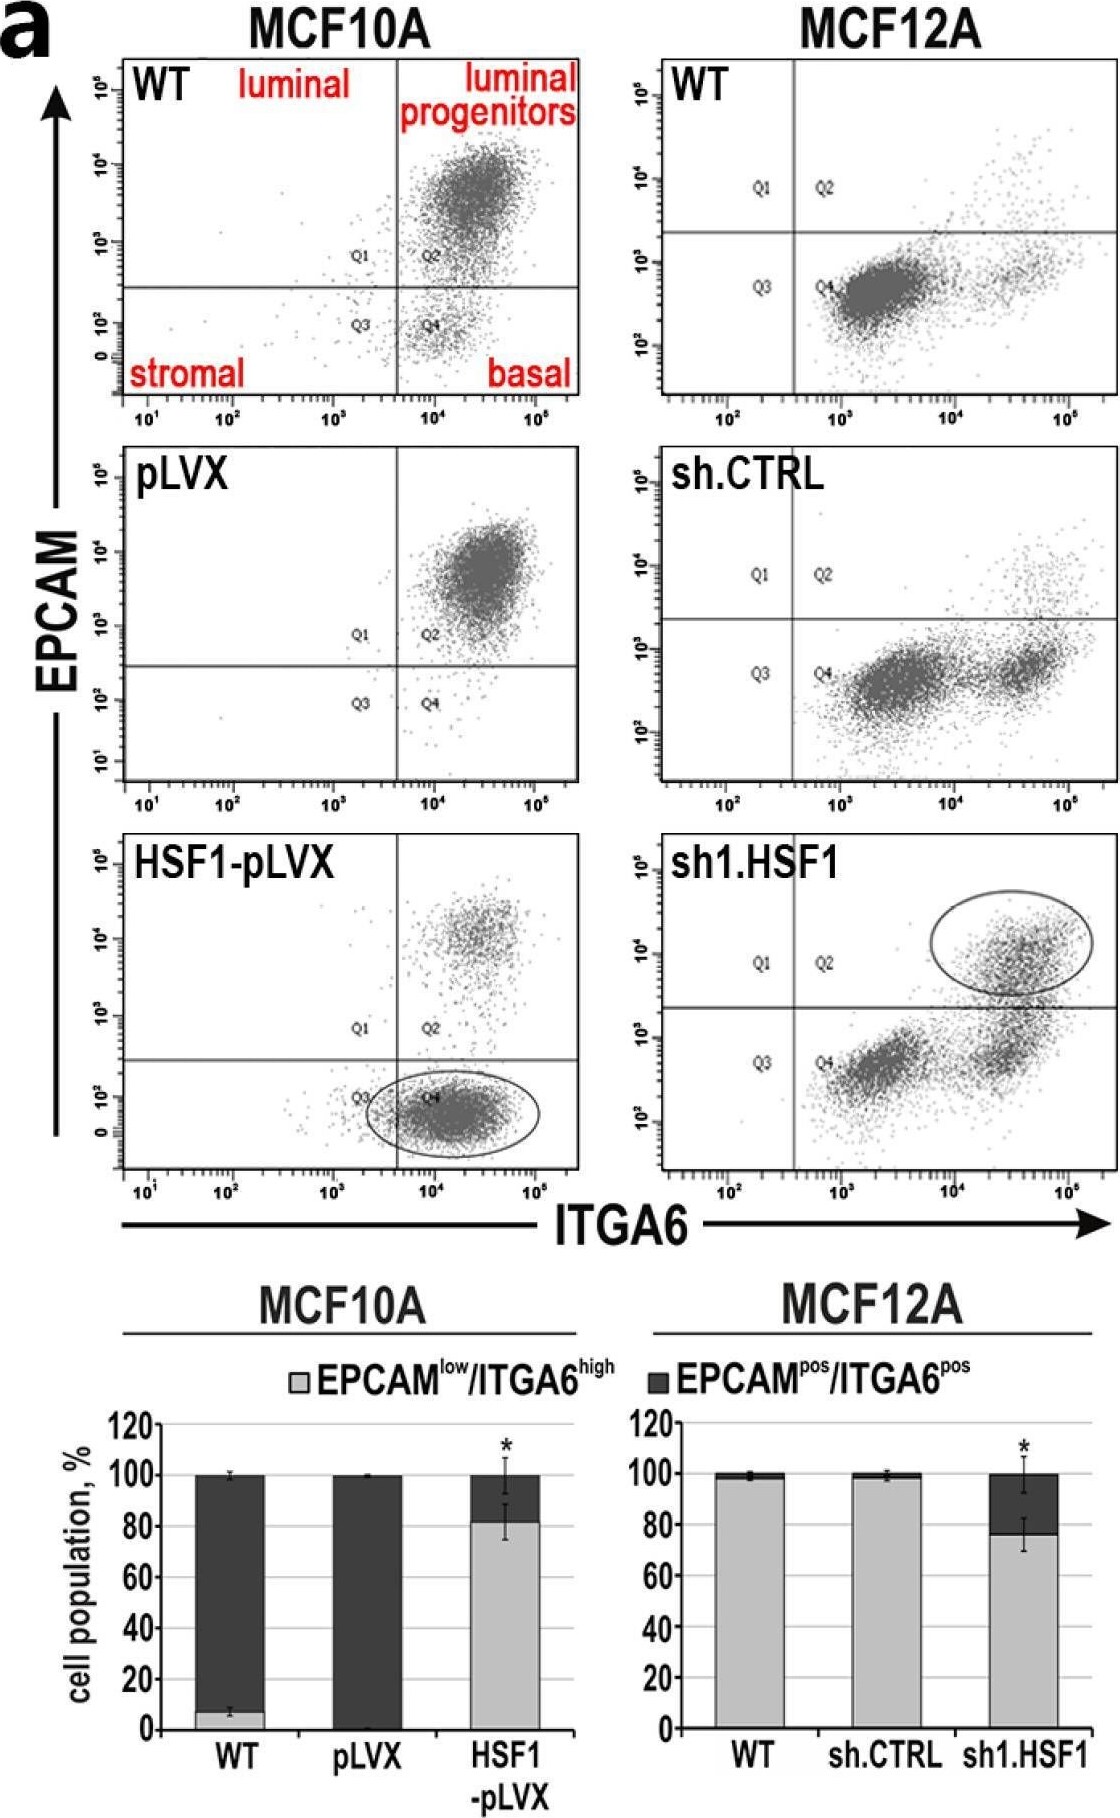
Detection of Integrin alpha 6/CD49f by Flow Cytometry
Mesenchymal and stem cell-like characteristics of MCF10A and MCF12A cell variants with altered HSF1 expression. (a) Subpopulations defined by expression of EPCAM and ITGA6 or (b) CD24 and CD44 using flow cytometry. The percentages of subpopulations shown in the bar graphs are the mean ± SEM of three independent experiments. Ovals point out cell populations, which are enriched when HSF1 expression levels are altered. * p < 0.05 (significance of differences). Image collected and cropped by CiteAb from the following open publication (https://pubmed.ncbi.nlm.nih.gov/37894333), licensed under a CC-BY license. Not internally tested by R&D Systems.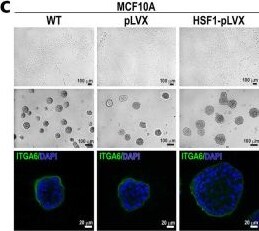
Detection of Integrin alpha 6/CD49f by Immunocytochemistry/ Immunofluorescence
HSF1 levels affect the expression of EMT markers and phenotype of MCF10A and MCF12A cells. (a) Western blot analysis of HSF1 and EMT markers in cells with overexpression (MCF10A) or knockdown (MCF12A) of HSF1. WT, unmodified cells; pLVX or shCTRL, cells transduced with lentiviruses containing the empty vector or control shRNA; HSF1-pLVX or sh1.HSF1, cells transduced with lentiviruses containing the HSF1 cDNA or shRNA targeting HSF1. ACTB and HSPA8 were used as loading controls. Graphs show the results of densitometric analyses (n = 3). (b) Proliferation rates assessed through crystal violet staining in MCF10A cell variants (n = 5). (c) Morphology of MCF10A cell variants in 2D culture (subconfluent; upper panel) and Matrigel (middle and bottom panels). Phase-contrast images (upper and middle panels; scale bar 100 µm) and confocal images of spheroids stained for ITGA6 and DNA (bottom panel). (d) The volume of spheroids formed in Matrigel by MCF10A cell variants. Boxplots represent the median, upper and lower quartiles, maximum and minimum. (e,f) Confocal images of spheroids grown in Matrigel for 14 or 21 days and stained for CDH1 and DNA (scale bar 20 µm and 50 µm, respectively). (g) Migratory capacity of MCF10A cell variants analyzed with Boyden chamber assay (n = 3). (h) Time of cell detachment from the plastic surface by trypsinization. Boxplots represent the median, upper and lower quartiles, maximum and minimum. *** p < 0.001, ** p < 0.01, * p < 0.05 (significance of differences). Original western blots are presented in File S1. Image collected and cropped by CiteAb from the following open publication (https://pubmed.ncbi.nlm.nih.gov/37894333), licensed under a CC-BY license. Not internally tested by R&D Systems.Applications for Integrin alpha 6/CD49f Antibody (GoH3)
Application
Recommended Usage
Blockade of Receptor-ligand Interaction
Sonnenberg, A. et al. (1986) J. Histochem. Cytochem. 34:1037. Knapp, W.B. et al. Eds. (1989) Leukocyte Typing IV: White Cell Differentiation Antigens, Oxford University Press, New York. Aumailley, M.R. et al. (1990) Exp. Cell Res. 188:55.
CyTOF-reported
This clone has been commercially reported for use in CyTOF®. Ready to be labeled using established conjugation methods. No BSA or other carrier proteins that could interfere with conjugation.
Flow Cytometry
2.5 µg/106 cells
Sample: Human peripheral blood mononuclear cells
Sample: Human peripheral blood mononuclear cells
Immunohistochemistry
Sonnenberg, A. et al. (1986) J. Histochem. Cytochem. 34:1037.
Reviewed Applications
Read 4 reviews rated 5 using MAB13501 in the following applications:
Flow Cytometry Panel Builder
Bio-Techne Knows Flow Cytometry
Save time and reduce costly mistakes by quickly finding compatible reagents using the Panel Builder Tool.
Advanced Features
- Spectra Viewer - Custom analysis of spectra from multiple fluorochromes
- Spillover Popups - Visualize the spectra of individual fluorochromes
- Antigen Density Selector - Match fluorochrome brightness with antigen density

Formulation, Preparation, and Storage
Purification
Protein A or G purified from hybridoma culture supernatant
Reconstitution
Reconstitute at 0.5 mg/mL in sterile PBS. For liquid material, refer to CoA for concentration.
Loading...
Formulation
Lyophilized from a 0.2 μm filtered solution in PBS with Trehalose. *Small pack size (SP) is supplied either lyophilized or as a 0.2 µm filtered solution in PBS.
Shipping
Lyophilized product is shipped at ambient temperature. Liquid small pack size (-SP) is shipped with polar packs. Upon receipt, store immediately at the temperature recommended below.
Stability & Storage
Use a manual defrost freezer and avoid repeated freeze-thaw cycles.
- 12 months from date of receipt, -20 to -70 °C as supplied.
- 1 month, 2 to 8 °C under sterile conditions after reconstitution.
- 6 months, -20 to -70 °C under sterile conditions after reconstitution.
Calculators
Background: Integrin alpha 6/CD49f
Alternate Names
CD49f, ITGA6, Platelet gpl, VLA-6
Gene Symbol
ITGA6
Additional Integrin alpha 6/CD49f Products
Product Documents for Integrin alpha 6/CD49f Antibody (GoH3)
Certificate of Analysis
To download a Certificate of Analysis, please enter a lot or batch number in the search box below.
Note: Certificate of Analysis not available for kit components.
Product Specific Notices for Integrin alpha 6/CD49f Antibody (GoH3)
For research use only
Citations for Integrin alpha 6/CD49f Antibody (GoH3)
 Powered by Bioz
Customer Reviews for Integrin alpha 6/CD49f Antibody (GoH3) (4)
5 out of 5
4 Customer Ratings
Have you used Integrin alpha 6/CD49f Antibody (GoH3)?
Submit a review and receive an Amazon gift card!
$25/€18/£15/$25CAN/¥2500 for a review with an image
$10/€7/£6/$10CAN/¥1110 for a review without an image
Submit a review
Customer Images


Showing
1
-
4 of
4 reviews
Showing All
Filter By:
-
Application: Immunocytochemistry/ImmunofluorescenceSample Tested: Embryonic retina and retinaSpecies: HumanVerified Customer | Posted 03/01/2022

-
Application: Western BlotSample Tested: Peritoneal macrophagesSpecies: MouseVerified Customer | Posted 09/09/2021
-
Application: Western BlotSample Tested: U937 human histiocytic lymphoma cell lineSpecies: HumanVerified Customer | Posted 05/20/2019
-
Application: Flow CytometrySample Tested: Peritoneal macrophagesSpecies: MouseVerified Customer | Posted 09/30/2018
There are no reviews that match your criteria.
Protocols
Find general support by application which include: protocols, troubleshooting, illustrated assays, videos and webinars.
- 7-Amino Actinomycin D (7-AAD) Cell Viability Flow Cytometry Protocol
- Antigen Retrieval Protocol (PIER)
- Antigen Retrieval for Frozen Sections Protocol
- Appropriate Fixation of IHC/ICC Samples
- Cellular Response to Hypoxia Protocols
- Chromogenic IHC Staining of Formalin-Fixed Paraffin-Embedded (FFPE) Tissue Protocol
- Chromogenic Immunohistochemistry Staining of Frozen Tissue
- ClariTSA™ Fluorophore Kits
- Detection & Visualization of Antibody Binding
- Extracellular Membrane Flow Cytometry Protocol
- Flow Cytometry Protocol for Cell Surface Markers
- Flow Cytometry Protocol for Staining Membrane Associated Proteins
- Flow Cytometry Staining Protocols
- Flow Cytometry Troubleshooting Guide
- Fluorescent IHC Staining of Frozen Tissue Protocol
- Graphic Protocol for Heat-induced Epitope Retrieval
- Graphic Protocol for the Preparation and Fluorescent IHC Staining of Frozen Tissue Sections
- Graphic Protocol for the Preparation and Fluorescent IHC Staining of Paraffin-embedded Tissue Sections
- Graphic Protocol for the Preparation of Gelatin-coated Slides for Histological Tissue Sections
- IHC Sample Preparation (Frozen sections vs Paraffin)
- Immunofluorescent IHC Staining of Formalin-Fixed Paraffin-Embedded (FFPE) Tissue Protocol
- Immunohistochemistry (IHC) and Immunocytochemistry (ICC) Protocols
- Immunohistochemistry Frozen Troubleshooting
- Immunohistochemistry Paraffin Troubleshooting
- Intracellular Flow Cytometry Protocol Using Alcohol (Methanol)
- Intracellular Flow Cytometry Protocol Using Detergents
- Intracellular Nuclear Staining Flow Cytometry Protocol Using Detergents
- Intracellular Staining Flow Cytometry Protocol Using Alcohol Permeabilization
- Intracellular Staining Flow Cytometry Protocol Using Detergents to Permeabilize Cells
- Preparing Samples for IHC/ICC Experiments
- Preventing Non-Specific Staining (Non-Specific Binding)
- Primary Antibody Selection & Optimization
- Propidium Iodide Cell Viability Flow Cytometry Protocol
- Protocol for Heat-Induced Epitope Retrieval (HIER)
- Protocol for Liperfluo
- Protocol for Making a 4% Formaldehyde Solution in PBS
- Protocol for VisUCyte™ HRP Polymer Detection Reagent
- Protocol for the Characterization of Human Th22 Cells
- Protocol for the Characterization of Human Th9 Cells
- Protocol for the Preparation & Fixation of Cells on Coverslips
- Protocol for the Preparation and Chromogenic IHC Staining of Frozen Tissue Sections
- Protocol for the Preparation and Chromogenic IHC Staining of Frozen Tissue Sections - Graphic
- Protocol for the Preparation and Chromogenic IHC Staining of Paraffin-embedded Tissue Sections
- Protocol for the Preparation and Chromogenic IHC Staining of Paraffin-embedded Tissue Sections - Graphic
- Protocol for the Preparation and Fluorescent IHC Staining of Frozen Tissue Sections
- Protocol for the Preparation and Fluorescent IHC Staining of Paraffin-embedded Tissue Sections
- Protocol for the Preparation of Gelatin-coated Slides for Histological Tissue Sections
- Protocol: Annexin V and PI Staining by Flow Cytometry
- Protocol: Annexin V and PI Staining for Apoptosis by Flow Cytometry
- TUNEL and Active Caspase-3 Detection by IHC/ICC Protocol
- The Importance of IHC/ICC Controls
- Troubleshooting Guide: Fluorokine Flow Cytometry Kits
- Troubleshooting Guide: Immunohistochemistry
- View all Protocols, Troubleshooting, Illustrated assays and Webinars
Loading...
Associated Pathways