
The human polymeric immunoglobulin receptor (pIgR; also known as membrane secretory component) is a 100 kDa type I transmembrane glycoprotein that is synthesized as a 764 amino acid (aa) precursor. It includes a signal sequence (aa 1-18), an extracellular region (aa 19-638), a transmembrane segment (aa 639-661), and a cytoplasmic domain (aa 662-764) (1-3). The extracellular region consists of five Ig-like domains and a sixth non-Ig domain that connects to the membrane region. pIgR is expressed on secretory epithelial cells of exocrine tissues. Immunoglobulin isotypes consist of two heavy (H) and two light (L) chains. For IgA and IgM, this H2L2 monomer can form larger polymers through association with a joining chain (J chain). The Fc regions of IgA and IgM have a carboxy-terminal extension called a secretory tailpiece that binds the J chain (4). pIgR functions as a carrier that transports IgA and IgM across epithelium (5). On the basolateral surface of epithelial cells, the receptor initially binds non-covalently to IgA via a docking site on the J chain. This initiates a rearrangement in which a disulfide bond forms between pIgR and an IgA heavy chain (2). The complexes are then internalized and transcytosed to the apical surface. A soluble covalent complex called secretory IgA (SIgA) is now generated by proteolytic cleavage of the sixth extracellular domain of pIgR and released into the lumen (6). This IgA-bound and proteolytically generated pIgR fragment is referred to as secretory component (SC). Notably, human pIgR transcytoses constitutively, with or without ligand, creating both bound and free, 78 kDa SC following cleavage (3). The extracellular region of pIgR is 64%, 65%, and 70% aa identical to the equivalent region in rat, mouse and porcine, respectively. The receptor component of the complex anchors the SIgA molecule to mucous (7). SIgA is a crucial component of the mucosal immune system serving to protect the large expanse of mucous membranes that form a barrier between the interior of the body and the external environment (8).

Scientific images may be resized, cropped, or adjusted for brightness or contrast for presentation purposes. These updates are limited to presentation and do not affect the underlying scientific interpretation of the data. Where available, additional source data may be provided upon request.
Key Product Details
Species Reactivity
Validated:
Cited:
Applications
Validated:
Cited:
Label
Antibody Source
Product Specifications
Immunogen
Lys19-Arg638
Accession # CAA51532
Specificity
Clonality
Host
Isotype
Endotoxin Level
Scientific Data Images for Human pIgR Antibody
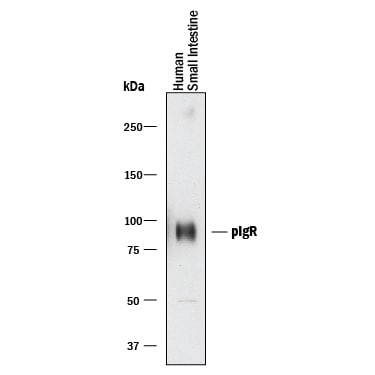
Detection of Human pIgR by Western Blot.
Western blot shows lysates of human small intestine tissue. PVDF membrane was probed with 0.2 µg/mL of Goat Anti-Human pIgR Antigen Affinity-purified Polyclonal Antibody (Catalog # AF2717) followed by HRP-conjugated Anti-Goat IgG Secondary Antibody (Catalog # HAF017). A specific band was detected for pIgR at approximately 85-100 kDa (as indicated). This experiment was conducted under reducing conditions and using Immunoblot Buffer Group 1.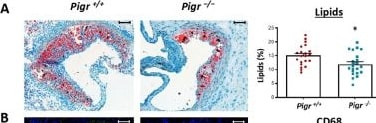
Detection of pIgR by Immunohistochemistry
Pigr deficiency decreases intralesional lipids and macrophage infiltration in Ldlr knockout mice. Representative photographs and quantification of ORO (A), CD68 (B), alpha -SMA (C) and collagen (D) in the aortic root from Ldlr−/− Pigr−/− (n=22) and Ldlr−/− Pigr+/+ (n=21) mice. Data represent means ± SEM. Mann-Whitney U test. *p<0,05, ***p<0,001. Scale bars, 100 µm. Image collected and cropped by CiteAb from the following open publication (https://pubmed.ncbi.nlm.nih.gov/42112342), licensed under a CC-BY license. Not internally tested by R&D Systems.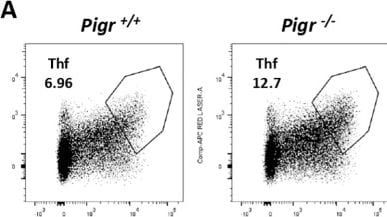
Detection of pIgR by Flow Cytometry
TfH and Tregs in spleen of Pigr deficient mice under hypercholesterolemic conditions. Representative FACS plots and quantification of TfH cells (A, B) and Tregs (C, D) from Ldlr−/− Pigr−/− (n=14-15) and Ldlr−/− Pigr+/+ (n=14-15). Each dot in the graphs represents a biological replicate (individual mouse). Population percentages in FACS graphs indicate the frequency of live cells. Mann-Whitney U test. **p < 0.01. Image collected and cropped by CiteAb from the following open publication (https://pubmed.ncbi.nlm.nih.gov/42112342), licensed under a CC-BY license. Not internally tested by R&D Systems.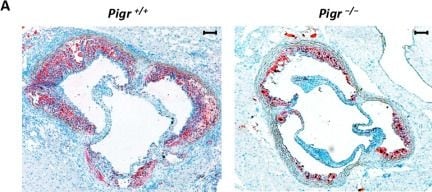
Detection of pIgR by Immunohistochemistry
Representative photographs (A) and quantification of lesion area (μm2), (B), maximum atherosclerotic lesion area (μm2) as a function of distance (μm) (C), and area under the curve (AUC) values, representing total plaque volume (μm3) (D), in the aortic root from Ldlr−/− Pigr−/− (n=22) and Ldlr−/− Pigr+/+ (n=21) mice. Data represent means ± SEM. Mann-Whitney U test. *p<0,05, **p<0,01. Scale bars, 100 µm. Image collected and cropped by CiteAb from the following open publication (https://pubmed.ncbi.nlm.nih.gov/42112342), licensed under a CC-BY license. Not internally tested by R&D Systems.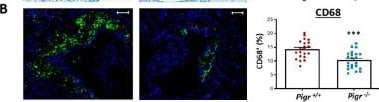
Detection of pIgR by Immunohistochemistry
Pigr deficiency decreases intralesional lipids and macrophage infiltration in Ldlr knockout mice. Representative photographs and quantification of ORO (A), CD68 (B), alpha -SMA (C) and collagen (D) in the aortic root from Ldlr−/− Pigr−/− (n=22) and Ldlr−/− Pigr+/+ (n=21) mice. Data represent means ± SEM. Mann-Whitney U test. *p<0,05, ***p<0,001. Scale bars, 100 µm. Image collected and cropped by CiteAb from the following open publication (https://pubmed.ncbi.nlm.nih.gov/42112342), licensed under a CC-BY license. Not internally tested by R&D Systems.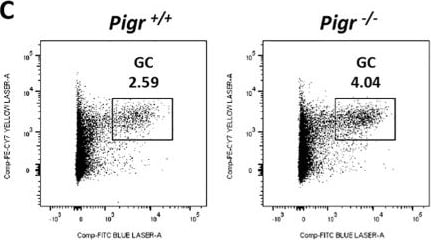
Detection of pIgR by Flow Cytometry
Germinal center response in Pigr deficient mice under hypercholesterolemic conditions. Quantification by ELISA of IgA (A) and IgM (B) levels in serum from Ldlr−/− Pigr−/− (n=22) and Ldlr−/− Pigr+/+ (n=21) mice subjected to 10 weeks of western-diet. Representative FACS plots and quantification of GC B cells in spleen (C, D) and Peyer´s patches (E, F) from Ldlr−/− Pigr−/− (n=15) and Ldlr−/− Pigr+/+ (n=14-15). Each dot in the graphs represents a biological replicate (individual mouse). Population percentages in FACS graphs indicate the frequency of live cells. Mann-Whitney U test. ***p < 0.001 and ****p < 0.0001. Image collected and cropped by CiteAb from the following open publication (https://pubmed.ncbi.nlm.nih.gov/42112342), licensed under a CC-BY license. Not internally tested by R&D Systems.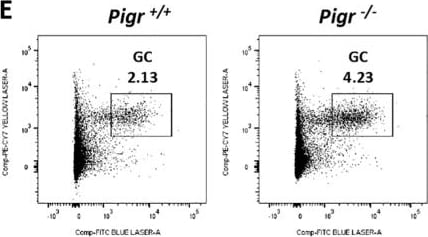
Detection of pIgR by Flow Cytometry
Germinal center response in Pigr deficient mice under hypercholesterolemic conditions. Quantification by ELISA of IgA (A) and IgM (B) levels in serum from Ldlr−/− Pigr−/− (n=22) and Ldlr−/− Pigr+/+ (n=21) mice subjected to 10 weeks of western-diet. Representative FACS plots and quantification of GC B cells in spleen (C, D) and Peyer´s patches (E, F) from Ldlr−/− Pigr−/− (n=15) and Ldlr−/− Pigr+/+ (n=14-15). Each dot in the graphs represents a biological replicate (individual mouse). Population percentages in FACS graphs indicate the frequency of live cells. Mann-Whitney U test. ***p < 0.001 and ****p < 0.0001. Image collected and cropped by CiteAb from the following open publication (https://pubmed.ncbi.nlm.nih.gov/42112342), licensed under a CC-BY license. Not internally tested by R&D Systems.Applications for Human pIgR Antibody
Blockade of Receptor-ligand Interaction
Western Blot
Sample: Human small intestine tissue
Formulation, Preparation, and Storage
Purification
Reconstitution
Reconstitute at 0.2 mg/mL in sterile PBS. For liquid material, refer to CoA for concentration.
Formulation
Shipping
Stability & Storage
- 12 months from date of receipt, -20 to -70 °C as supplied.
- 1 month, 2 to 8 °C under sterile conditions after reconstitution.
- 6 months, -20 to -70 °C under sterile conditions after reconstitution.
Calculators
Background: pIgR
References
- Krajci, P. et al. (1989) Biochem. Biophys. Res. Commun. 158:783.
- Piskurich, J. et al. (1995) J. Immunol. 154:1735.
- Brandtzaeg, P. and F-E. Johansen (2001) Trends Immunol. 22:545.
- Braathen, R. et al. (2002) J. Biol. Chem. 277:42755.
- Ben-Hur, H. et al. (2004) Int. J. Mol. Med. 14:35.
- Asano, M. et al. (2004) Immunology 112:583.
- Phalipon, A. and B. Corthesy (2003) Trends Immunol. 24:55.
- Uren, T. et al. (2003) J. Immunol. 170:2531.
Long Name
Alternate Names
Gene Symbol
UniProt
Additional pIgR Products
Product Documents for Human pIgR Antibody
Certificate of Analysis
To download a Certificate of Analysis, please enter a lot or batch number in the search box below.
Note: Certificate of Analysis not available for kit components.
Product Specific Notices for Human pIgR Antibody
For research use only
Citations for Human pIgR Antibody
 Powered by Bioz
Customer Reviews for Human pIgR Antibody
There are currently no reviews for this product. Be the first to review Human pIgR Antibody and earn rewards!
Have you used Human pIgR Antibody?
Submit a review and receive an Amazon gift card!
$25/€18/£15/$25CAN/¥2500 for a review with an image
$10/€7/£6/$10CAN/¥1110 for a review without an image
Submit a review
Protocols
Find general support by application which include: protocols, troubleshooting, illustrated assays, videos and webinars.
- Cellular Response to Hypoxia Protocols
- R&D Systems Quality Control Western Blot Protocol
- Troubleshooting Guide: Western Blot Figures
- Western Blot Conditions
- Western Blot Protocol
- Western Blot Protocol for Cell Lysates
- Western Blot Troubleshooting
- Western Blot Troubleshooting Guide
- View all Protocols, Troubleshooting, Illustrated assays and Webinars