
Thrombospondin-1 (TSP-1) is a 150‑180 kDa charter member of the thrombospondin family of extracellular matrix proteins. Human TSP‑1 is synthesized as an 1170 amino acid (aa) precursor that contains an 18 aa signal sequence and 1152 aa mature molecule. The mature molecule has been described as containing three distinct regions that create the shape of a dumbbell. There is an intital, 140 aa N-terminal laminin G-like globular region that binds heparin (aa 19‑258). This is followed by an extended, central collagen-binding region that contains one type C von Willebrand factor domain, plus three TSP type I and three TSP type II (or EGF-like) domains (aa 259‑712). The C‑terminus (aa 713‑1170) appears as a large globule with two halves; one calcium‑binding region (aa 713‑950) with seven Asp‑rich TSP type III domains, and one terminal region (aa 951‑1170) with TSP‑unique motifs (1). This C-terminal region is believed to mediate CD47 and cell binding (2‑5). The TSP type I repeats have multiple functions. They bind to type V collagen, laminin, fibronectin and CD36. They also contain a recognition site for C‑mannosylation on Trp. Finally, a type I KRFK motif induces the release of mature TGF-b from LAP. This is an effect not found in TSP-2. The function of the type II repeats in unclear. TSP‑1 is secreted as a disulfide-linked 450 kDa homotrimer. The cysteines responsible lie just N‑terminal to the first type I TSP repeat. Mature human TSP-1 is 61% aa identical to human TSP-2. It is also 95%, 97% and 95% aa identical to mouse, dog and rat TSP-1, respectively.

Scientific images may be resized, cropped, or adjusted for brightness or contrast for presentation purposes. These updates are limited to presentation and do not affect the underlying scientific interpretation of the data. Where available, additional source data may be provided upon request.
Key Product Details
Species Reactivity
Validated:
Cited:
Applications
Validated:
Cited:
Label
Antibody Source
Product Specifications
Immunogen
Asn19-Pro1170
Accession # CAA32889
Specificity
Clonality
Host
Isotype
Scientific Data Images for Human Thrombospondin-1 Antibody
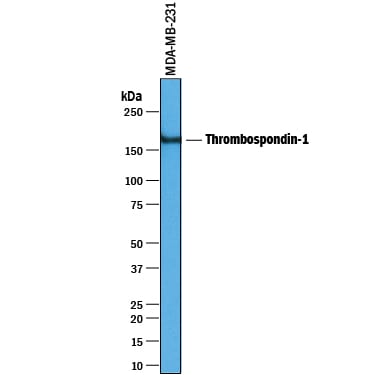
Detection of Human Thrombospondin‑1 by Western Blot.
Western blot shows lysates of MDA-MB-231 human breast cancer cell line. PVDF membrane was probed with 1 µg/mL of Goat Anti-Human Thrombospondin-1 Antigen Affinity-purified Polyclonal Antibody (Catalog # AF3074) followed by HRP-conjugated Anti-Goat IgG Secondary Antibody (Catalog # HAF019). A specific band was detected for Thrombospondin-1 at approximately 160 kDa (as indicated). This experiment was conducted under reducing conditions and using Immunoblot Buffer Group 1.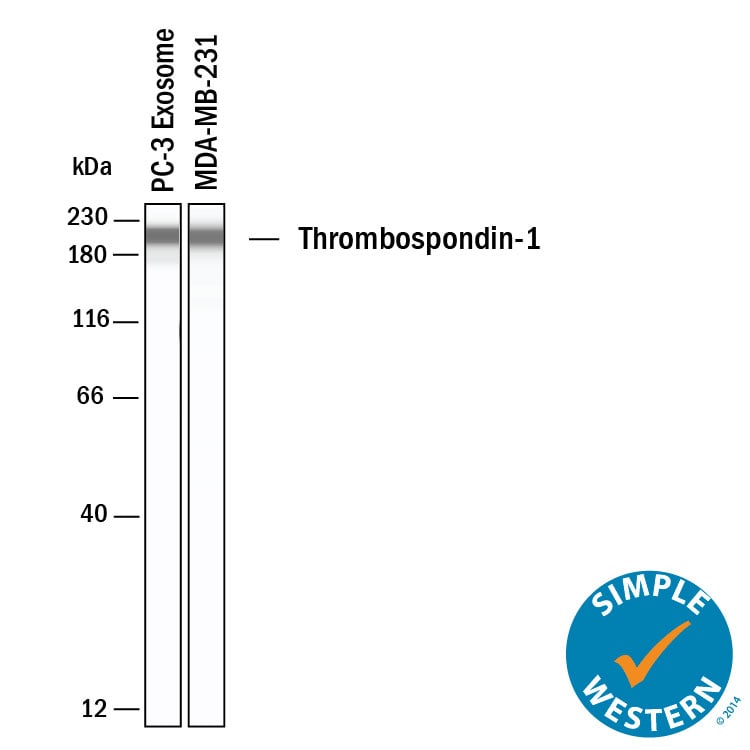
Detection of Human Thrombospondin‑1 by Simple WesternTM.
Simple Western lane view shows lysates of Exosome Standards (PC‑3) (NBP2-49856) and MDA‑MB‑231 human breast cancer cell line, loaded at 0.5 mg/ml. A specific band was detected for Thrombospondin‑1 at approximately 210 kDa (as indicated) using 10 µg/ml of Goat Anti-Human Thrombospondin‑1 Antigen Affinity-purified Polyclonal Antibody (Catalog # AF3074) followed by 1:50 dilution of HRP-conjugated Anti-Goat IgG Secondary Antibody (Catalog # HAF017). This experiment was conducted under reducing conditions and using the 12-230kDa separation system.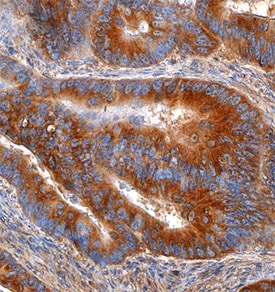
Thrombospondin‑1 in Human Colon.
Thrombospondin-1 was detected in immersion fixed paraffin-embedded sections of human colon using Goat Anti-Human Thrombospondin-1 Antigen Affinity-purified Polyclonal Antibody (Catalog # AF3074) at 1.7 µg/mL overnight at 4 °C. Tissue was stained using the Anti-Goat HRP-DAB Cell & Tissue Staining Kit (brown; Catalog # CTS008) and counterstained with hematoxylin (blue). Specific staining was localized to the cytoplasm of epithelial cells. View our protocol for Chromogenic IHC Staining of Paraffin-embedded Tissue Sections.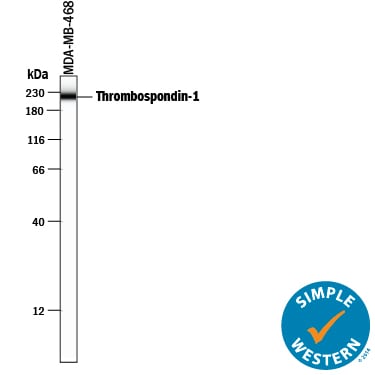
Detection of Human Thrombospondin‑1 by Simple WesternTM.
Simple Western lane view shows lysates of MBA-MB-468 human breast cancer cell line, loaded at 0.2 mg/mL. A specific band was detected for Thrombospondin-1 at approximately 221 kDa (as indicated) using 10 µg/mL of Goat Anti-Human Thrombospondin-1 Antigen Affinity-purified Polyclonal Antibody (Catalog # AF3074) followed by 1:50 dilution of HRP-conjugated Anti-Goat IgG Secondary Antibody (Catalog # HAF109). This experiment was conducted under reducing conditions and using the 12-230 kDa separation system.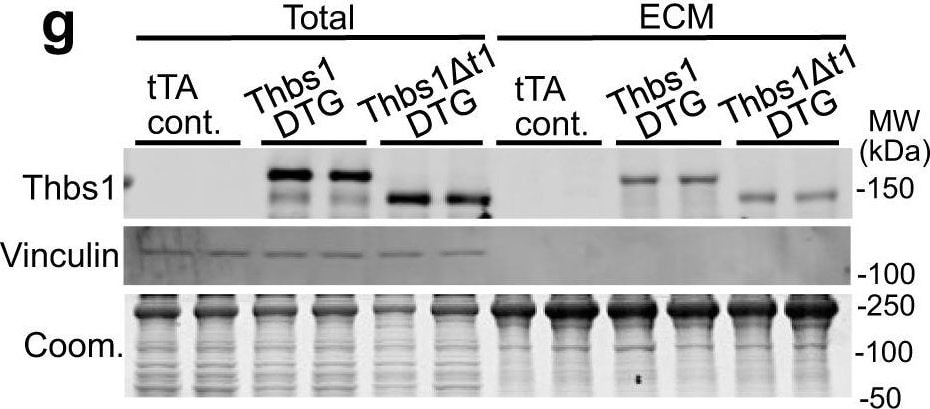
Detection of Mouse Thrombospondin-1 by Western Blot
Endothelial cells and TGF beta are not affected by cardiac Thbs1 overexpression.a Quantification of capillary number per mm2 of tissue from histological sections of tTA cont. and Thbs1 DTG hearts stained with isolectin B4 at 6 weeks of age. b Quantification of endothelial cell proliferation as measured by EdU incorporation co-labeled with CD31 in tTA cont. and Thbs1 DTG hearts at 6 weeks of age. c Quantification of endothelial cell apoptosis detected by TUNEL staining co-labeled with isolectin B4 in tTA cont. and Thbs1 DTG hearts at 6 weeks of age. d ELISA-based quantification of total TGF beta and e active TGF beta in protein extracts from tTA cont. or Thbs1 DTG hearts at 6 weeks of age. f Schematic diagram of WT Thbs1 domain structure and the Thbs1 delta t1 mutant lacking the Thbs1 type-1 repeat domain region. g Representative western blot analysis for Thbs1 from total protein extracts (Total) and extracellular matrix (ECM) extracts from hearts of tTA cont., Thbs1 DTG, and Thbs1 DTG delta t1 mice at 4 weeks of age. Vinculin is presented as cytosolic control. Coomassie stained (Coom.) gel is shown as loading control. h VW/BW ratio at 4 weeks of age in the indicated groups of mice. *P < 0.0001 versus tTA cont.; statistical analysis was performed using one-way ANOVA and Tukey multiple comparisons test. i Kaplan–Meier survival plot of tTA cont., Thbs1 DTG, and Thbs1 delta t1 DTG animals. *P < 0.0001 vs tTA cont. #P < 0.0001 vs Thbs1 DTG; both analyzed by two-tailed log-rank test. The same data from Fig. 2e are shown again here for tTA cont. and Thbs1 DTG mice (same strain and ages and sex ratio mix). j Representative western blots for Thbs2 and Gapdh as loading control, from heart protein extracts from tTA cont. and Thbs2 DTG mice at 8 weeks of age. k Heart weight (HW)/BW ratio, and l FS percentage at 8 weeks of age from tTA cont. and Thbs2 DTG mice. The number of biologically independent animals analyzed is indicated on each graph. Error bars are ±standard error of the mean. Source data are prov
Human Thrombospondin-1 ELISA Standard Curve
Recombinant Human Thrombospondin‑1 (Catalog # 3074-TH) was serially diluted and captured by Mouse Anti-Human Thrombospondin‑1 Monoclonal Antibody (Catalog # MAB3074) coated on a Clear Polystyrene Microplate (Catalog # DY990). Goat Anti-Human Thrombospondin‑1 Antigen Affinity-purified Polyclonal Antibody (Catalog # AF3074) was biotinylated and incubated with the protein captured on the plate. Detection of the standard curve was achieved by incubating Streptavidin-HRP (Catalog # DY998)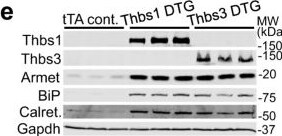
Detection of Thrombospondin-1 by Western Blot
Expression of Thbs1 is induced in diseased hearts where it mediates ER stress.a Western blotting for Thbs1 in heart tissue of mice (8–10 weeks of age) subjected to 2 weeks of TAC, that contained the activated calcineurin A transgene ( delta CnA), or are Csrp3−/−, compared to sham-operated or wild-type (WT) control. Gapdh is shown as a processing and loading control. b Representative immunohistochemistry for endogenous Thbs1 (red) and cell outlines with wheat germ agglutinin (WGA)-FITC (green) with DAPI-stained nuclei (blue) from hypertrophic delta CnA transgenic and WT control hearts at 8 weeks of age. Scale bars are 10 μm. c Immunohistochemistry for Thbs1 protein (green), vimentin (red) from sham or TAC-operated hearts, 2 weeks later. Scale bars are 50 μm. Nuclei are shown in blue with DAPI. d Schematic diagram depicting the inducible double transgenic (DTG) tetracycline-repressor system for inducible overexpression of Thbs1 in the heart. e Representative Western blots for Thbs1, Thbs3, Armet, BiP, calreticulin (calret.), and Gapdh as a loading control from hearts of tTA cont., Thbs1 DTG, and Thbs3 DTG mice at 6 weeks of age. f Representative immunohistochemistry broken into 2 channels each for overexpressed Thbs1 (green) with WGA-labeled membranes (purple), DAPI for nuclei (blue) and BiP (red) to show ER and the vesicular compartment in Thbs1 DTG hearts at 8 weeks of age. Scale bars are 50 μm. g Representative images of transmission electron microscopy of heart sections from tTA cont. and Thbs1 DTG mice at 6 weeks of age. Upper panels: arrowheads indicate ER in tTA cont., white arrows show expanded ER and vesicles only in Thbs1 DTG hearts. Lower panels: enlargement of white dotted boxed area from upper panels. Scale bars are 1 μm. Source data are provided as a Source Data File. Image collected and cropped by CiteAb from the following open publication (https://pubmed.ncbi.nlm.nih.gov/34168130), licensed under a CC-BY license. Not internally tested by R&D Systems.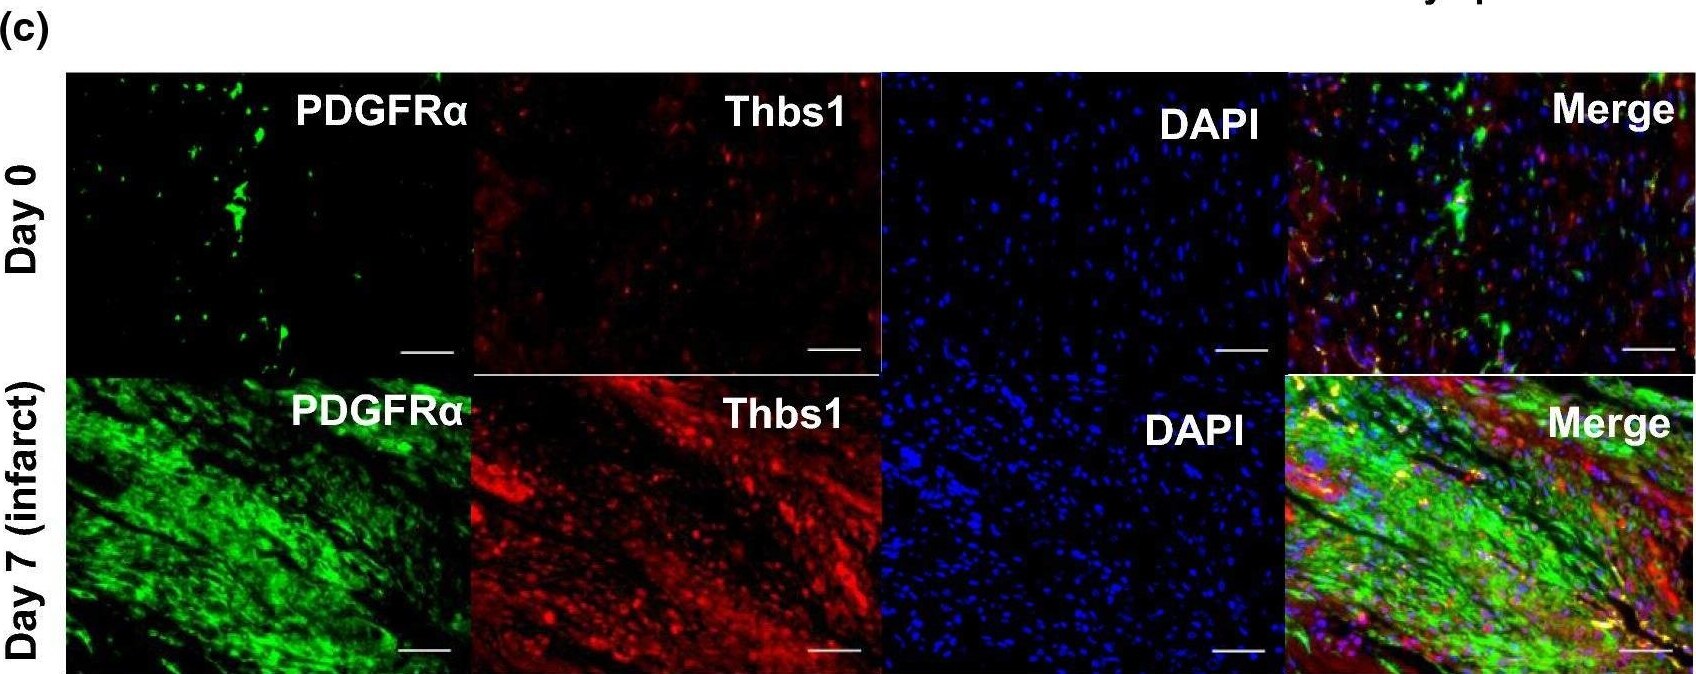
Detection of Thrombospondin-1 by Immunohistochemistry
MI day 7 fibroblasts showed an anti-angiogenic myofibroblast phenotype profile. a Volcano plot and major upregulated processes. bThbs1 expression was significantly increased; n = 3 per group. c LV infarct region from MI day 7 stained for cardiac fibroblast marker PDGFR alpha (green), Thbs1 (red), and DAPI (blue). Thbs1 was significantly increased within regions staining positive for PDGFR alpha ; n = 4 day 0, n = 5 MI day 7. d Immunoblot analysis of Thbs1 in cardiac fibroblast secretome. MI significantly increased cardiac fibroblast secretion of Thbs1 at MI day 7; n = 3 per group; densitometry normalized to total membrane stain. *p < 0.05 versus day 0; $p < 0.05 versus MI day 3 Image collected and cropped by CiteAb from the following open publication (https://pubmed.ncbi.nlm.nih.gov/30635789), licensed under a CC-BY license. Not internally tested by R&D Systems.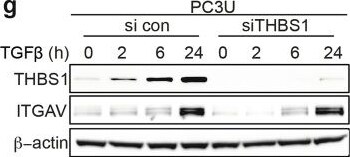
Detection of Thrombospondin-1 by Western Blot
THBS1 mediates the cell migration by forming a complex with T beta RI and ITGAV.a Co-IF staining of HA, THBS1, and ITGAV in the wild-type (WT), A9 (T beta RI deficient), A9 HA-T beta RI (A9 cells reconstituted with HA-T beta RI) cell lines with or without TGF beta treatment. Scale bar, 20 μm. b Co-IP was performed to detect the interaction of HA-T beta RI with THBS1 and ITGAV. c The correlation of T beta RI and THBS1 expression, T beta RI and ITGAV expression in prostate cancer (TCGA database). d The interaction of THBS1 and ITGAV was detected in a wound-healing assay by in situ PLA. Scale bar, 50 μm. e Invasion assay showing that knockdown of THSB1 prevented the invasion capacity of PC3U cells treated with TGF beta. Scale bar, 50 μm. f The invading cells were quantified by OD value. Shown as mean ± SD, *p < 0.05. g Western blot showing the expression of THSB1 and ITGAV in PC3U cells with THSB1 knockdown. Image collected and cropped by CiteAb from the following open publication (https://pubmed.ncbi.nlm.nih.gov/39304722), licensed under a CC-BY license. Not internally tested by R&D Systems.
Detection of Thrombospondin-1 by Western Blot
Expression of Thbs1 is induced in diseased hearts where it mediates ER stress.a Western blotting for Thbs1 in heart tissue of mice (8–10 weeks of age) subjected to 2 weeks of TAC, that contained the activated calcineurin A transgene ( delta CnA), or are Csrp3−/−, compared to sham-operated or wild-type (WT) control. Gapdh is shown as a processing and loading control. b Representative immunohistochemistry for endogenous Thbs1 (red) and cell outlines with wheat germ agglutinin (WGA)-FITC (green) with DAPI-stained nuclei (blue) from hypertrophic delta CnA transgenic and WT control hearts at 8 weeks of age. Scale bars are 10 μm. c Immunohistochemistry for Thbs1 protein (green), vimentin (red) from sham or TAC-operated hearts, 2 weeks later. Scale bars are 50 μm. Nuclei are shown in blue with DAPI. d Schematic diagram depicting the inducible double transgenic (DTG) tetracycline-repressor system for inducible overexpression of Thbs1 in the heart. e Representative Western blots for Thbs1, Thbs3, Armet, BiP, calreticulin (calret.), and Gapdh as a loading control from hearts of tTA cont., Thbs1 DTG, and Thbs3 DTG mice at 6 weeks of age. f Representative immunohistochemistry broken into 2 channels each for overexpressed Thbs1 (green) with WGA-labeled membranes (purple), DAPI for nuclei (blue) and BiP (red) to show ER and the vesicular compartment in Thbs1 DTG hearts at 8 weeks of age. Scale bars are 50 μm. g Representative images of transmission electron microscopy of heart sections from tTA cont. and Thbs1 DTG mice at 6 weeks of age. Upper panels: arrowheads indicate ER in tTA cont., white arrows show expanded ER and vesicles only in Thbs1 DTG hearts. Lower panels: enlargement of white dotted boxed area from upper panels. Scale bars are 1 μm. Source data are provided as a Source Data File. Image collected and cropped by CiteAb from the following open publication (https://pubmed.ncbi.nlm.nih.gov/34168130), licensed under a CC-BY license. Not internally tested by R&D Systems.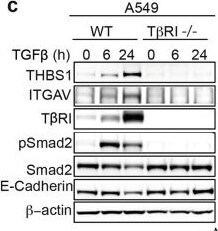
Detection of Thrombospondin-1 by Western Blot
TGF beta -induced THBS1 mediates the migration and invasion of cancer cells.a–c Expression of THBS1 and ITGAV detected by western blotting in the PC3U, DU-145, and A549 cell lines with or without a knockout or knockdown of T beta RI. d Immunofluorescent (IF) staining of THBS1 and pSmad2 in WT and A9 cells in a wound-healing assay with or without TGF beta treatment. Scale bar, 20 μm. e Invasion assay showing the invasive capacity of PC3U cells with or without knockout of T beta RI or with or without TGF beta treatment for 48 h. Scale bar, 50 μm. f Western blotting showing the overexpression of THBS1 in A9 cells. g Invasion assay showing the invasive capacity of WT, A9, and A9 cells overexpressed THBS1. Scale bar, 50 μm. h The invading cells were quantified by OD value. Shown as mean ± SD, *p < 0.05. i IF staining of THBS1 and Paxillin in PC3U cells treated with TGF beta for 6 h. Scale bar, 20 μm. j IF staining of THBS1, Paxillin, and Phalloidin in PC3U cells treated with TGF beta for 6 h. Scale bar, 20 μm. Image collected and cropped by CiteAb from the following open publication (https://pubmed.ncbi.nlm.nih.gov/39304722), licensed under a CC-BY license. Not internally tested by R&D Systems.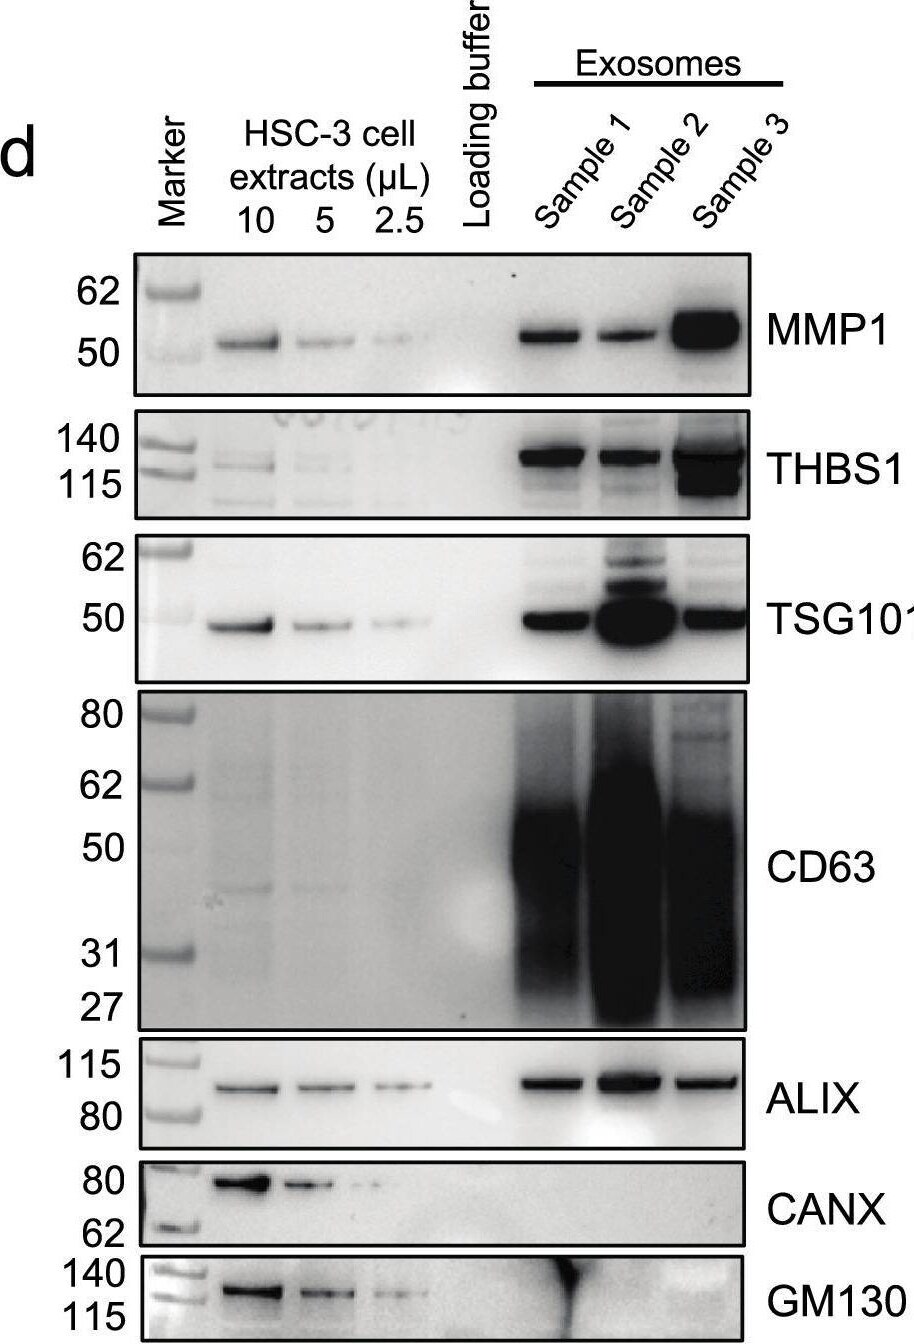
Detection of Thrombospondin-1 by Western Blot
Extracellular vesicles released by HSC-3 cells have characteristics of exosomes and carry pain and metastasis genes as cargo. (a) Representative transmission electron micrographs of EVs isolated from conditioned media of HSC-3. Images were taken at 45,000× (left) and 92,00× (right) magnification. Isolated vesicles display cup-shaped morphology and membrane layer characteristic of exosomes (arrows). (b) The diameters of vesicles from HSC-3 were measured on micrographs taken at 92,000× (4–6 fields). (c) Representative nanoparticle tracking analysis (NTA) of the distribution of measured EV hydrodynamic diameter (mode indicated above the trace). Extracellular vesicle sizes as measured from electron micrographs and by NTA are typical of exosomes. (d) Isolated EVs express exosome endocytic marker proteins TSG101 and ALIX, and tetraspanin, CD63. Calnexin (CANX, endoplasmic reticulum marker) and GM130 (cis-Golgi network marker) were not detected. Exosome samples were obtained from cells grown under normoxic conditions. Pain and metastasis gene proteins, MMP1 and THBS1 were detected in the HSC-3 EVs. Image collected and cropped by CiteAb from the following open publication (https://pubmed.ncbi.nlm.nih.gov/32895418), licensed under a CC-BY license. Not internally tested by R&D Systems.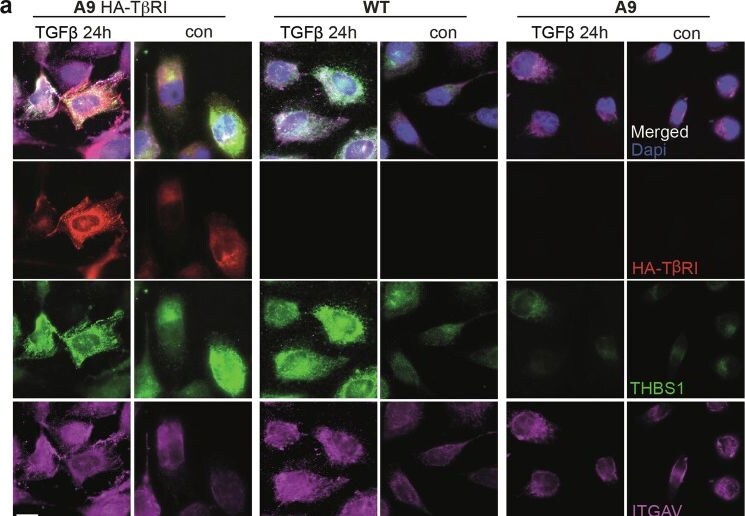
Detection of Thrombospondin-1 by Immunocytochemistry/ Immunofluorescence
THBS1 mediates the cell migration by forming a complex with T beta RI and ITGAV.a Co-IF staining of HA, THBS1, and ITGAV in the wild-type (WT), A9 (T beta RI deficient), A9 HA-T beta RI (A9 cells reconstituted with HA-T beta RI) cell lines with or without TGF beta treatment. Scale bar, 20 μm. b Co-IP was performed to detect the interaction of HA-T beta RI with THBS1 and ITGAV. c The correlation of T beta RI and THBS1 expression, T beta RI and ITGAV expression in prostate cancer (TCGA database). d The interaction of THBS1 and ITGAV was detected in a wound-healing assay by in situ PLA. Scale bar, 50 μm. e Invasion assay showing that knockdown of THSB1 prevented the invasion capacity of PC3U cells treated with TGF beta. Scale bar, 50 μm. f The invading cells were quantified by OD value. Shown as mean ± SD, *p < 0.05. g Western blot showing the expression of THSB1 and ITGAV in PC3U cells with THSB1 knockdown. Image collected and cropped by CiteAb from the following open publication (https://pubmed.ncbi.nlm.nih.gov/39304722), licensed under a CC-BY license. Not internally tested by R&D Systems.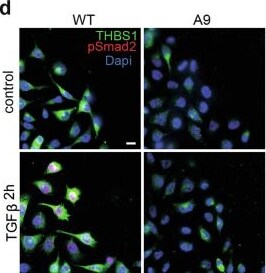
Detection of Thrombospondin-1 by Immunocytochemistry/ Immunofluorescence
TGF beta -induced THBS1 mediates the migration and invasion of cancer cells.a–c Expression of THBS1 and ITGAV detected by western blotting in the PC3U, DU-145, and A549 cell lines with or without a knockout or knockdown of T beta RI. d Immunofluorescent (IF) staining of THBS1 and pSmad2 in WT and A9 cells in a wound-healing assay with or without TGF beta treatment. Scale bar, 20 μm. e Invasion assay showing the invasive capacity of PC3U cells with or without knockout of T beta RI or with or without TGF beta treatment for 48 h. Scale bar, 50 μm. f Western blotting showing the overexpression of THBS1 in A9 cells. g Invasion assay showing the invasive capacity of WT, A9, and A9 cells overexpressed THBS1. Scale bar, 50 μm. h The invading cells were quantified by OD value. Shown as mean ± SD, *p < 0.05. i IF staining of THBS1 and Paxillin in PC3U cells treated with TGF beta for 6 h. Scale bar, 20 μm. j IF staining of THBS1, Paxillin, and Phalloidin in PC3U cells treated with TGF beta for 6 h. Scale bar, 20 μm. Image collected and cropped by CiteAb from the following open publication (https://pubmed.ncbi.nlm.nih.gov/39304722), licensed under a CC-BY license. Not internally tested by R&D Systems.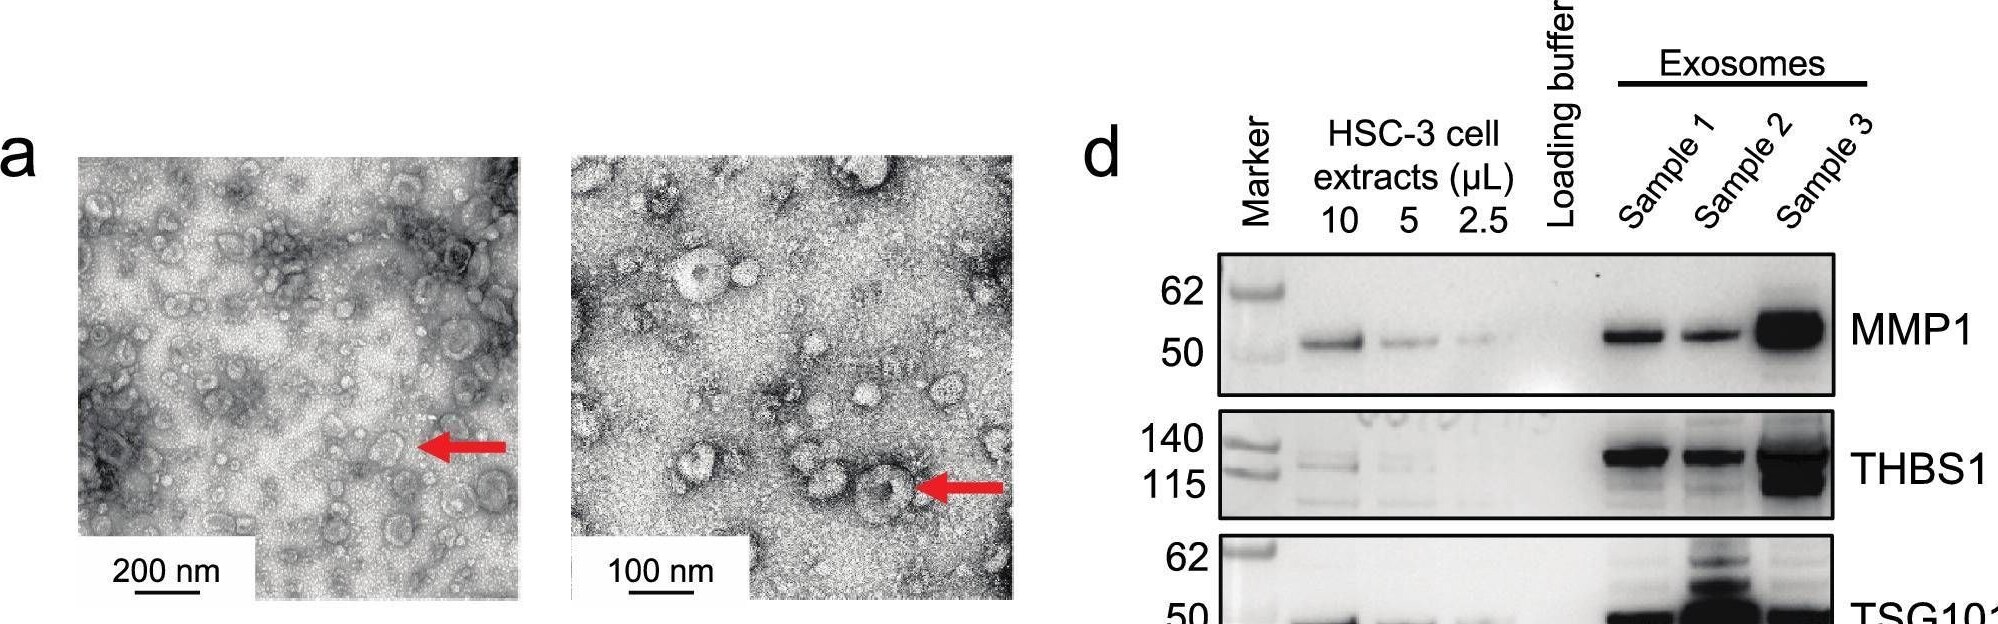
Detection of Thrombospondin-1 by Western Blot
Extracellular vesicles released by HSC-3 cells have characteristics of exosomes and carry pain and metastasis genes as cargo. (a) Representative transmission electron micrographs of EVs isolated from conditioned media of HSC-3. Images were taken at 45,000× (left) and 92,00× (right) magnification. Isolated vesicles display cup-shaped morphology and membrane layer characteristic of exosomes (arrows). (b) The diameters of vesicles from HSC-3 were measured on micrographs taken at 92,000× (4–6 fields). (c) Representative nanoparticle tracking analysis (NTA) of the distribution of measured EV hydrodynamic diameter (mode indicated above the trace). Extracellular vesicle sizes as measured from electron micrographs and by NTA are typical of exosomes. (d) Isolated EVs express exosome endocytic marker proteins TSG101 and ALIX, and tetraspanin, CD63. Calnexin (CANX, endoplasmic reticulum marker) and GM130 (cis-Golgi network marker) were not detected. Exosome samples were obtained from cells grown under normoxic conditions. Pain and metastasis gene proteins, MMP1 and THBS1 were detected in the HSC-3 EVs. Image collected and cropped by CiteAb from the following open publication (https://pubmed.ncbi.nlm.nih.gov/32895418), licensed under a CC-BY license. Not internally tested by R&D Systems.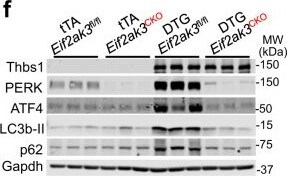
Detection of Thrombospondin-1 by Western Blot
Thbs1 induces PERK/ATF4 to facilitate cardiac atrophy.a Low magnification cardiac histological images from tTA cont. Eif2ak3fl/fl (PERK), tTA Eif2ak3fl/fl beta MHC-Cre (Eif2ak3CKO), Thbs1 DTG Eif2ak3fl/fl, and Thbs1 DTG Eif2ak3CKO mice stained with Masson’s trichrome at 8 weeks of age. Scale bar is 2 mm. b VW/BW ratio, c FS percentage and d LW/BW ratio at 8 weeks of age in the indicated groups of mice. The number of biologically independent animals analyzed and P-values are indicated on the graphs for panels “b–d”. Statistical analysis was performed using one-way ANOVA and Tukey multiple comparisons test for panels “b–d”. Error bars are ±standard error of the mean. e Kaplan–Meier survival plot from tTA cont. Eif2ak3fl/fl, Thbs1 DTG Eif2ak3fl/fl, tTA cont. Eif2ak3CKO and Thbs1 DTG Eif2ak3CKO. The number of biologically independent animals analyzed are indicated on the graph. Statistical analysis was performed using a two-tailed log-rank test. *P < 0.0001 vs tTA cont. Eif2ak3fl/fl, Eif2ak3CKO and Thbs1 DTG Eif2ak3CKO, #P = 0.0678 vs tTA cont. Eif2ak3fl/fl, and #P = 0.0404 vs Eif2ak3CKO. f Representative western blots for Thbs1, PERK, ATF4, LC3b, and p62 from cardiac protein extracts isolated from the groups shown at 8 weeks of age. Protein extracts were from dissociated adult mouse heart cardiomyocytes. Gapdh serves as a loading control. Source data are provided as a Source Data File. Image collected and cropped by CiteAb from the following open publication (https://pubmed.ncbi.nlm.nih.gov/34168130), licensed under a CC-BY license. Not internally tested by R&D Systems.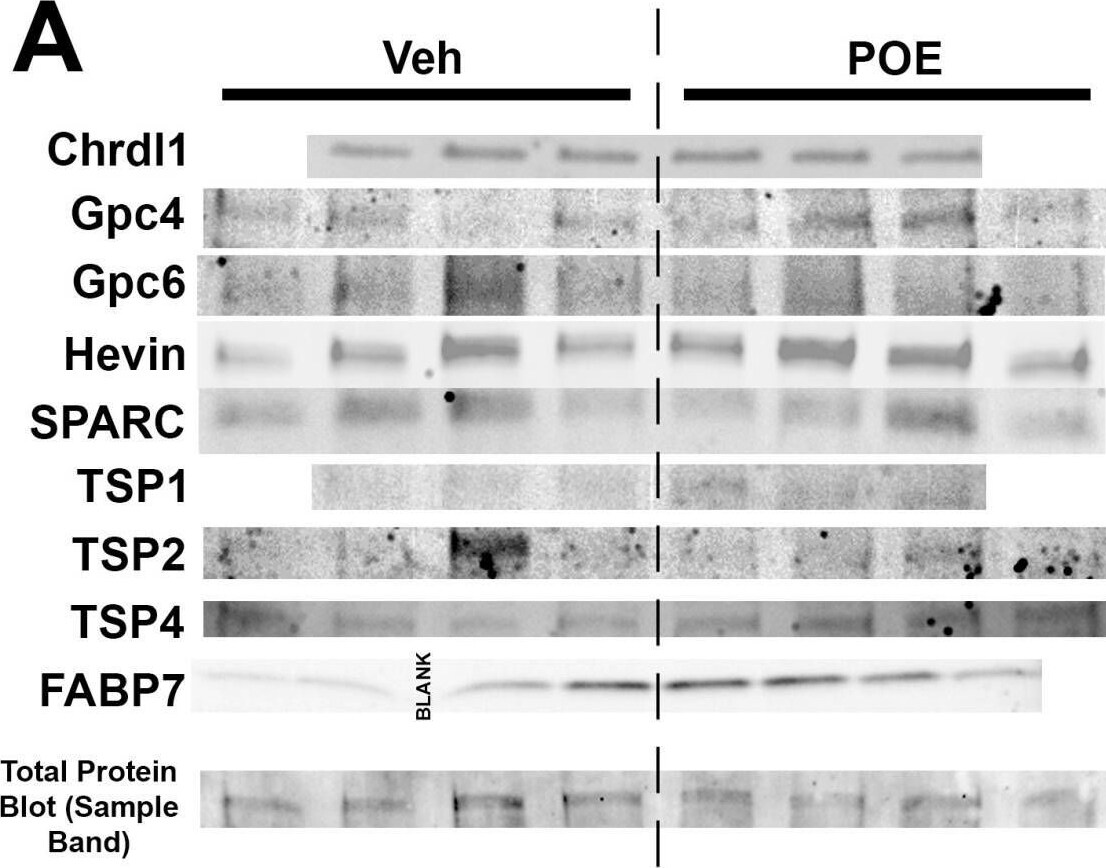
Detection of Thrombospondin-1 by Western Blot
Changes in synapse-related protein expression in POE astrocytes. (A) Western blot images reveal expression patterns of prominent synapse-associated proteins from the DIV10 vehicle and POE astrocyte lysates. Bottom row shows a representative band from one of the total protein blot images that was used for normalization purposes (full image shown in Figure S1). (B) Quantification of Western blots for proteins indicated in (A). Data shown as fold-change in band intensity values for POE astrocyte lysates compared to vehicle (n = 3–4 experimental replicates; unpaired t-test (unlabeled p values were not significant)). Image collected and cropped by CiteAb from the following open publication (https://pubmed.ncbi.nlm.nih.gov/38786059), licensed under a CC-BY license. Not internally tested by R&D Systems.Applications for Human Thrombospondin-1 Antibody
Immunohistochemistry
Sample: Immersion fixed paraffin-embedded sections of human colon
Simple Western
Sample: Exosome Standards (PC-3) (Catalog # NBP2-49856), MDA-MB-231 human breast cancer cell line and MDA‑MB‑468 human breast cancer cell line
Western Blot
Sample: MDA‑MB‑231 human breast cancer cell line
Reviewed Applications
Read 3 reviews rated 4.7 using AF3074 in the following applications:
Formulation, Preparation, and Storage
Purification
Reconstitution
Reconstitute at 0.2 mg/mL in sterile PBS. For liquid material, refer to CoA for concentration.
Formulation
Shipping
Stability & Storage
- 12 months from date of receipt, -20 to -70 °C as supplied.
- 1 month, 2 to 8 °C under sterile conditions after reconstitution.
- 6 months, -20 to -70 °C under sterile conditions after reconstitution.
Calculators
Background: Thrombospondin-1
References
- Lawler, J. and R.O. Hynes (1986) J. Cell Biol. 103:1635.
- Frazier, W.A. (1987) J. Cell Biol. 105:625.
- Sid, B. et al. (2004) Crit. Rev. Oncol. Hematol. 49:245.
- Floquet, N. et al. (2008) Anch. Biochem. Biophys. 478:103.
Alternate Names
Gene Symbol
UniProt
Additional Thrombospondin-1 Products
Product Documents for Human Thrombospondin-1 Antibody
Certificate of Analysis
To download a Certificate of Analysis, please enter a lot or batch number in the search box below.
Note: Certificate of Analysis not available for kit components.
Product Specific Notices for Human Thrombospondin-1 Antibody
For research use only
Related Research Areas
Citations for Human Thrombospondin-1 Antibody
 Powered by Bioz
Customer Reviews for Human Thrombospondin-1 Antibody (3)
Have you used Human Thrombospondin-1 Antibody?
Submit a review and receive an Amazon gift card!
$25/€18/£15/$25CAN/¥2500 for a review with an image
$10/€7/£6/$10CAN/¥1110 for a review without an image
Submit a review
Customer Images
-
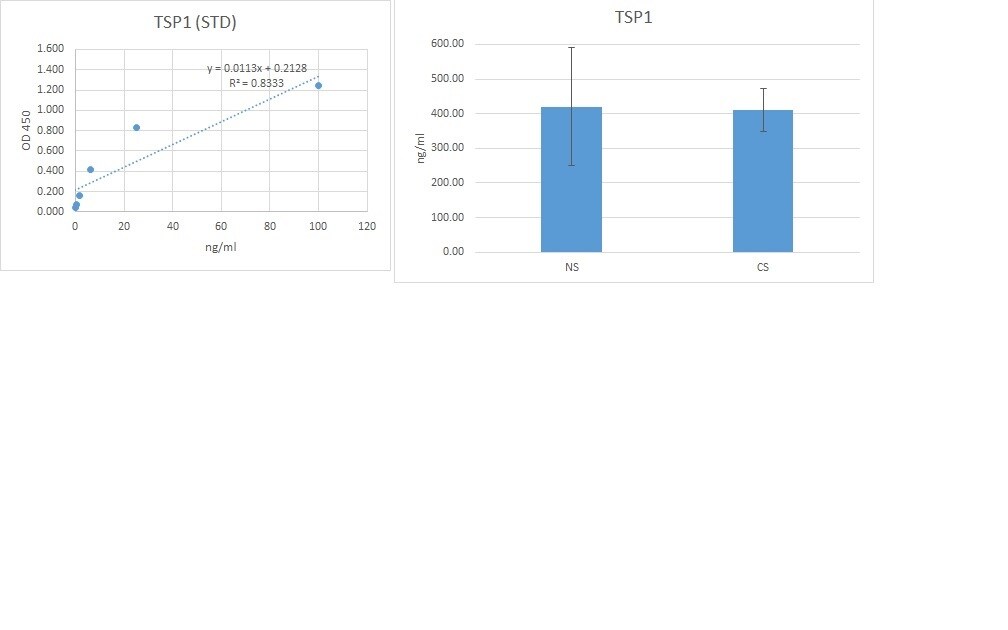
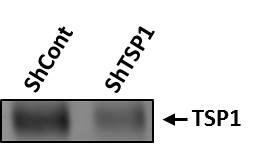
Application: ELISASample Tested: Serum and PlasmaSpecies: HumanVerified Customer | Posted 10/04/2019We used this antibody for a sandwich ELISA in combination with mAb (MAB3074)) and protein (3074-TH). This combination works very well for detecting the TSP1 in human serum and plasma samples.

-
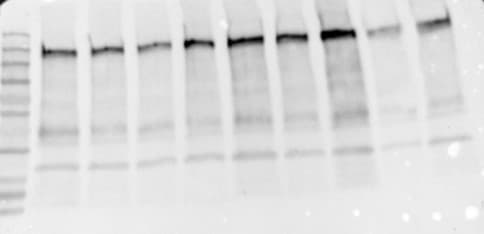
Application: Western BlotSample Tested: Trabecular meshworkSpecies: HumanVerified Customer | Posted 01/16/2018
-
Application: Western BlotSample Tested: Mesenchymal stem cellsSpecies: HumanVerified Customer | Posted 05/20/2016
There are no reviews that match your criteria.
Protocols
Find general support by application which include: protocols, troubleshooting, illustrated assays, videos and webinars.
- Antigen Retrieval Protocol (PIER)
- Antigen Retrieval for Frozen Sections Protocol
- Appropriate Fixation of IHC/ICC Samples
- Cellular Response to Hypoxia Protocols
- Chromogenic IHC Staining of Formalin-Fixed Paraffin-Embedded (FFPE) Tissue Protocol
- Chromogenic Immunohistochemistry Staining of Frozen Tissue
- ClariTSA™ Fluorophore Kits
- Detection & Visualization of Antibody Binding
- Fluorescent IHC Staining of Frozen Tissue Protocol
- Graphic Protocol for Heat-induced Epitope Retrieval
- Graphic Protocol for the Preparation and Fluorescent IHC Staining of Frozen Tissue Sections
- Graphic Protocol for the Preparation and Fluorescent IHC Staining of Paraffin-embedded Tissue Sections
- Graphic Protocol for the Preparation of Gelatin-coated Slides for Histological Tissue Sections
- IHC Sample Preparation (Frozen sections vs Paraffin)
- Immunofluorescent IHC Staining of Formalin-Fixed Paraffin-Embedded (FFPE) Tissue Protocol
- Immunohistochemistry (IHC) and Immunocytochemistry (ICC) Protocols
- Immunohistochemistry Frozen Troubleshooting
- Immunohistochemistry Paraffin Troubleshooting
- Preparing Samples for IHC/ICC Experiments
- Preventing Non-Specific Staining (Non-Specific Binding)
- Primary Antibody Selection & Optimization
- Protocol for Heat-Induced Epitope Retrieval (HIER)
- Protocol for Making a 4% Formaldehyde Solution in PBS
- Protocol for VisUCyte™ HRP Polymer Detection Reagent
- Protocol for the Preparation & Fixation of Cells on Coverslips
- Protocol for the Preparation and Chromogenic IHC Staining of Frozen Tissue Sections
- Protocol for the Preparation and Chromogenic IHC Staining of Frozen Tissue Sections - Graphic
- Protocol for the Preparation and Chromogenic IHC Staining of Paraffin-embedded Tissue Sections
- Protocol for the Preparation and Chromogenic IHC Staining of Paraffin-embedded Tissue Sections - Graphic
- Protocol for the Preparation and Fluorescent IHC Staining of Frozen Tissue Sections
- Protocol for the Preparation and Fluorescent IHC Staining of Paraffin-embedded Tissue Sections
- Protocol for the Preparation of Gelatin-coated Slides for Histological Tissue Sections
- R&D Systems Quality Control Western Blot Protocol
- TUNEL and Active Caspase-3 Detection by IHC/ICC Protocol
- The Importance of IHC/ICC Controls
- Troubleshooting Guide: Immunohistochemistry
- Troubleshooting Guide: Western Blot Figures
- Western Blot Conditions
- Western Blot Protocol
- Western Blot Protocol for Cell Lysates
- Western Blot Troubleshooting
- Western Blot Troubleshooting Guide
- View all Protocols, Troubleshooting, Illustrated assays and Webinars