
The mouse Anpep gene encodes Aminopeptidase N (APN), which is also known as microsomal aminopeptiase, alanyl aminopeptidase, Aminopeptidase M, CD13, or membrane protein p161 (1‑3). The deduced amino acid sequence of mouse APN consists of a short cytoplasmic tail (residues 2 to 8), a transmembrane region (residue 9 to 32), a Ser/Thr rich region and a zinc metalloprotease domain (residues 69 to 966). Widely expressed in many cells, tissues and species, APN cleaves the N-terminal amino acids from bioactive peptides, leading to their inactivation or degradation. The roles of APN in many fields, such as neuroscience, hematopoeitic cells, immune system, angiogenesis, cancer and viral infection, have been reviewed (4).
Mouse Aminopeptidase N/CD13 Antibody
R&D Systems | Catalog # AF2335

Scientific images may be resized, cropped, or adjusted for brightness or contrast for presentation purposes. These updates are limited to presentation and do not affect the underlying scientific interpretation of the data. Where available, additional source data may be provided upon request.
Key Product Details
Species Reactivity
Validated:
Mouse
Cited:
Human, Mouse, Rat, Transgenic Mouse
Applications
Validated:
Immunohistochemistry, Western Blot, Flow Cytometry, Immunocytochemistry, Immunoprecipitation, CyTOF-ready
Cited:
Immunohistochemistry, Immunohistochemistry-Frozen, Western Blot, Flow Cytometry, Immunocytochemistry, IHC-F, In Situ Hybridization
Label
Unconjugated
Antibody Source
Polyclonal Goat IgG
Loading...
Product Specifications
Immunogen
Mouse myeloma cell line NS0-derived recombinant mouse Aminopeptidase N/CD13
Lys69-Ser966
Accession # P97449
Lys69-Ser966
Accession # P97449
Specificity
Detects mouse Aminopeptidase N/CD13 in direct ELISAs and Western blots.
Clonality
Polyclonal
Host
Goat
Isotype
IgG
Scientific Data Images for Mouse Aminopeptidase N/CD13 Antibody
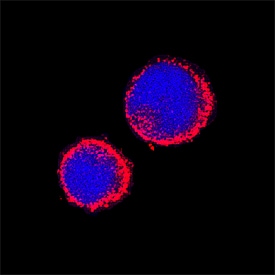
Aminopeptidase N/CD13 in Mouse Splenocytes.
Aminopeptidase N/CD13 was detected in immersion fixed mouse splenocytes using Goat Anti-Mouse Aminopeptidase N/CD13 Antigen Affinity-purified Polyclonal Antibody (Catalog # AF2335) at 15 µg/mL for 3 hours at room temperature. Cells were stained using the NorthernLights™ 557-conjugated Anti-Goat IgG Secondary Antibody (red; Catalog # NL001) and counterstained with DAPI (blue). Specific staining was localized to cytoplasm. View our protocol for Fluorescent ICC Staining of Non-adherent Cells.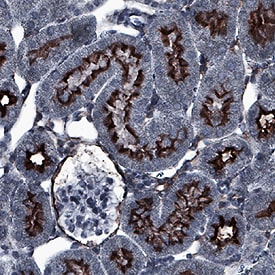
Aminopeptidase N/CD13 in Mouse Kidney.
Aminopeptidase N/CD13 was detected in immersion fixed paraffin-embedded sections of mouse kidney using Goat Anti-Mouse Aminopeptidase N/CD13 Antigen Affinity-purified Polyclonal Antibody (Catalog # AF2335) at 0.1 µg/mL for 1 hour at room temperature followed by incubation with the Anti-Goat IgG VisUCyte™ HRP Polymer Antibody (Catalog # VC004). Before incubation with the primary antibody, tissue was subjected to heat-induced epitope retrieval using Antigen Retrieval Reagent-Basic (Catalog # CTS013). Tissue was stained using DAB (brown) and counterstained with hematoxylin (blue). Specific staining was localized to apical membrane. View our protocol for IHC Staining with VisUCyte HRP Polymer Detection Reagents.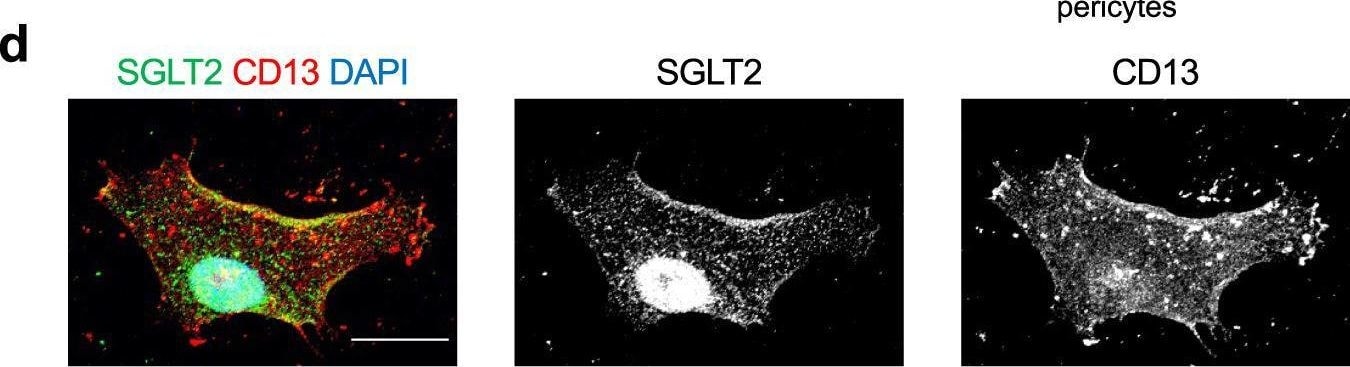
Detection of Aminopeptidase N/CD13 by Immunocytochemistry/ Immunofluorescence
Glucose uptake in brain pericytes via SGLT2.a Representative example of the expression of SLC5A2 (SGLT2) in cultured human brain microvascular pericytes, HEK-293T, and HK2 cells assessed using RT-PCR and quantification using qPCR (n = 3). The mRNA expression was normalized to that of RNA18S. b Representative immunoblottings for SGLT2, CD13, and beta -actin in cultured pericytes of total lysates or membrane fractions obtained by ultracentrifugation, which were transfected with pcDNA3 or pcDNA3-SLC5A2. Human kidney lysates were used as a positive control for SGLT2 expression. c A representative immunoblotting for SGLT2 in cultured brain pericytes after SLC5A2 overexpression with or without PNGase F treatment. The black arrowhead indicates glycosylated SGLT2 and the white arrowhead indicates unglycosylated SGLT2. d Representative images of immunofluorescence for SGLT2 (green), CD13 (red), and DAPI in a cultured brain pericyte (scale bar = 20 μm). e, f (e) Brain pericytes were incubated in Na+-containing HEPES-buffered saline, Na+-free solution, or Na+-containing solution with 100 or 1,000 nmol/L luseogliflozin for 15 min, followed by incubation with additional 200 μmol/L of 2-NBDG (scale bar = 20 μm). f Fluorescence intensity of 2-NBDG was measured using a microplate reader and normalized to that of Hoechst 33342 (n = 8). Data are presented as dot-plots of individual experiments and mean values ± SD. n.s. (not significant) P > 0.05, ***P < 0.001, ****P < 0.0001 by One-way ANOVA followed by Bonferroni’s post hoc test. SGLT2 sodium-glucose cotransporter 2, Luseo luseogliflozin, pMCAO permanent middle cerebral artery occlusion, 2-NBDG 2-deoxy-2-[(7-nitro-2,1,3-benzoxadiazol-4-yl) amino]-d-glucose. Image collected and cropped by CiteAb from the following open publication (https://www.nature.com/articles/s42003-022-03605-4), licensed under a CC-BY license. Not internally tested by R&D Systems.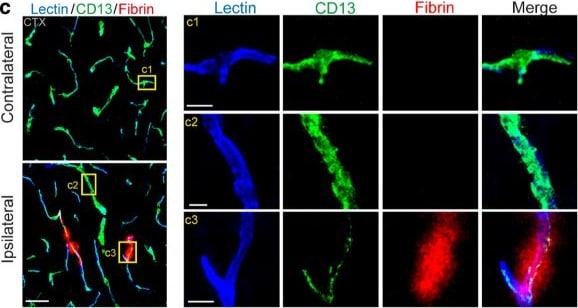
Detection of Aminopeptidase N/CD13 by Immunohistochemistry
Altered pericyte coverage in mTBI mice. a–b Representative images (a) and quantification (b) showing extravasation of plasma IgG (red) in brain parenchyma 3 days after mTBI. n = 6 mice. Dash line indicates an average value from sham-operated group (n = 5 mice). Scale bar = 50 µm. c Representative images showing CD13-positive pericyte coverage (green), lectin-positive endothelial vascular profiles (blue) and extravasation of fibrin deposits (red) in brain parenchyma of mTBI-affected ipsilateral side or contralateral side 3 days after mTBI. Scale bar = 50 µm. Insert on right: high magnification images of boxed regions in (c1–c3), Scale bar = 10 µm. d–e Quantification of CD13-positive pericyte cell bodies per mm2 (d) and pericyte coverage on lectin microvessel profiles (e) in brain parenchyma of mTBI-affected ipsilateral side and contralateral side 3 days after mTBI. n = 9 mice per group. f Pearson’s correlation plot between BBB impairment based on fibrin deposits and loss of pericyte coverage in brain parenchyma 3 days after mTBI. n = 18 hemispheres. r = Pearson's coefficient. P, significance. g Quantification of microvascular density in the cortexes of mTBI-affected ipsilateral side and contralateral side 3 days after mTBI. n = 9 mice per group. Mean ± SD in b, d–e, g; **, P < 0.01; ***, P < 0.001; NS, non-significant (P > 0.05) by Student’s t-test Image collected and cropped by CiteAb from the following open publication (https://pubmed.ncbi.nlm.nih.gov/33892818), licensed under a CC-BY license. Not internally tested by R&D Systems.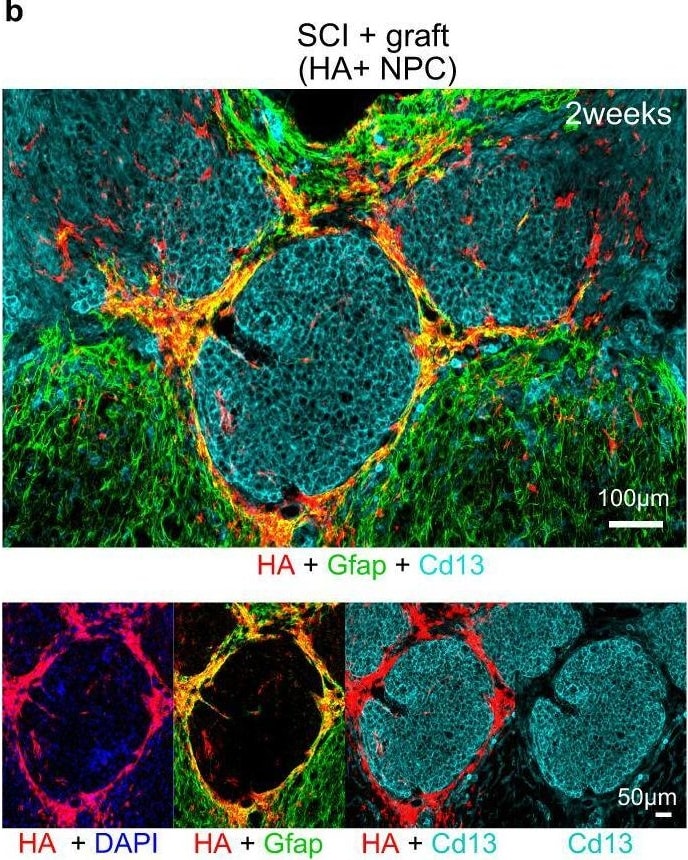
Detection of Aminopeptidase N/CD13 by Immunohistochemistry
Astroglia derived from NPC grafted into CNS lesions exhibit features of border-forming astroglia.a Detailed IHC images showing the astrocyte border phenotype of stroke lesions at 4 weeks in untreated stroke only and NPC grafted strokes. b Survey IHC of NPC grafted SCI lesions at 2 weeks showing NPC-derived astrocyte borders formed around Cd13-positive inflammatory cells. c Detailed IHC images showing the astrocyte border phenotype in SCI derived from transplanted NPC and not from host astrocytes (TK-positive). d, e Survey and detailed, higher magnification 3D IHC imaging of healthy mouse cortex and meninges showing higher expression of transcriptional regulator Id3 (inhibitor of DNA binding 3) in host astrocytes (HA+ Gfap-Cre-RiboTag) that form glia limitans at the meninges and penetrating blood vessels. f High magnification 3D IHC images showing astrocyte borders formed at stroke lesions upregulate expression of Id3. g High magnification 3D IHC images showing grafted NPC that remodel stroke lesions also express Id3. h NPC grafted into SCI lesions that form astrocyte borders also express Id3. Image collected and cropped by CiteAb from the following open publication (https://pubmed.ncbi.nlm.nih.gov/36171203), licensed under a CC-BY license. Not internally tested by R&D Systems.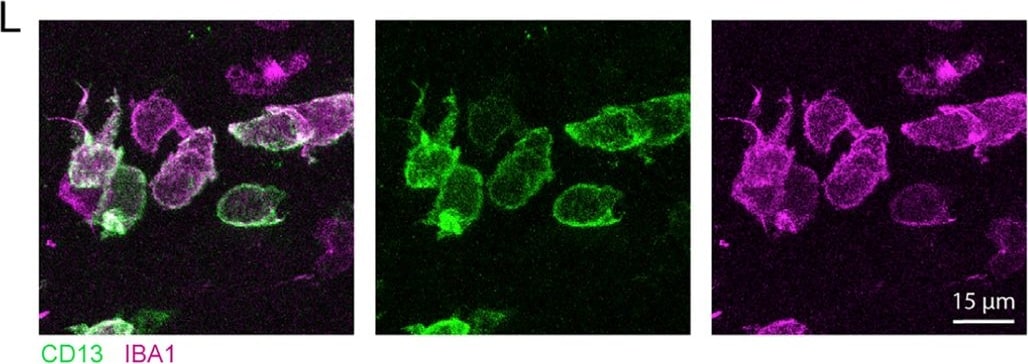
Detection of Aminopeptidase N/CD13 by Immunohistochemistry
Astrocyte ablation reduces basement membrane and mural cell coverage of vasculature in peri-infarct cortex(A) Representative confocal images of collagen IV in peri-infarct and contralateral cortex 14 days post-stroke.(B and C) High-magnification images from regions indicated in (A).(D and E) Collagen IV area fraction (D) and vessel coverage (E) were significantly reduced in peri-infarct cortex of GFAP-TK+GCV mice (n = 8/group). *t(14) ≥ 2.38, p ≤ 0.032, t tests.(F) Representative confocal images of pericytes (CD13+) in peri-infarct and contralateral cortex.(G and H) High-magnification images from regions indicated in (F). Large numbers of CD13+ cells not covering vessels were observed (arrow in H; quantified in K).(I) Peri-infarct CD13+ area fraction was not reduced by astrocyte ablation (t(14) = 0.04, p = 0.967).(J) However, peri-infarct vascular coverage by pericytes was significantly reduced in GFAP-TK+GCV mice. *t(14) = 2.92, p = 0.011.(K) Quantification of non-vessel-covering CD13+ cells, which were IBA1+ (L), consistent with a myeloid cell phenotype. *t(7.0) = 3.5, p = 0.010, Welch’s corrected t test.(L) Confocal images of non-vessel-associated CD13+ IBA1+ cells from peri-infarct cortex of a GFAP-TK+GCV mouse.Data are presented as mean ± SEM. Data points representing males are shown as filled symbols; data points representing females are shown as open symbols. Image collected and cropped by CiteAb from the following open publication (https://pubmed.ncbi.nlm.nih.gov/33910014), licensed under a CC-BY license. Not internally tested by R&D Systems.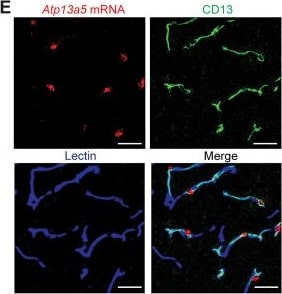
Detection of Aminopeptidase N/CD13 by Immunohistochemistry
Atp13a5 is specifically expressed by brain pericytes. A, UMAP of brain vasculature transcriptomes. Mural cells are marked by black line. PC, pericytes; capEC, capillary endothelial cells; aEC, arterial endothelial cells; vEC, venous endothelial cells; VSMC, vascular smooth muscle cells; Oligo, oligodendrocytes; FB, fibroblast; MG, microglia; AC, astrocytes; OPC, oligodendrocyte progenitor cells. B, Gene expression heatmap of the top 3 markers genes in each cluster. Pericyte markers: Vtn, Atp13a5a, and Kcnj8; capEC markers: Slc7a5, Ctla2a, and Slc38a3; aEC markers: Bmx, Alpl, and Gkn3; vEC markers: Slc38a51, Vwf, and Flrt2; VSMC markers: Sncg, Pdlim3, and Gpr20; Oligo markers: Mbp, Cldn11, and Mag; FB markers: Lum, Col1a1, and Col6a1; MG markers: Trem2, Fcgr1, and AF251705; AC markers: Ntsr2, Mlc1, and Acsbg1. Detailed gene lists are provided in Extended Data Figure 1-1 and Extended Data Tables 1-1 and 1-2. C, Violin plots showing the distribution of expression level of the top 3 pericyte markers across all nine cell types. D, Gene expression heatmap of representative genes in Allen Institute's dataset. E, Representative images for Atp13a5 mRNA expression (red) and immunostaining for CD13+ pericytes (green), and lectin+ endothelia cells (blue) in cortex. Scale bar, 50 µm. Sections: 15 µm thickness. F, Representative images for Atp13a5 mRNA expression (red) in various mouse brain regions. Scale bar, 100 µm. Sections: 10 µm thick. G, Number of Atp13a5+ cells per mm2 in different mouse brain regions. n = 3 mice. Data are presented in mean ± SEM. Image collected and cropped by CiteAb from the following open publication (https://pubmed.ncbi.nlm.nih.gov/39261008), licensed under a CC-BY license. Not internally tested by R&D Systems.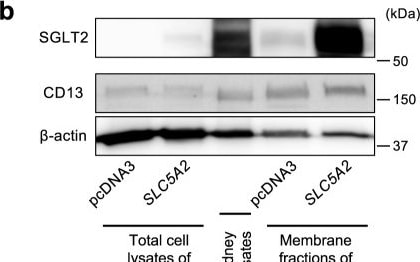
Detection of Aminopeptidase N/CD13 by Western Blot
Glucose uptake in brain pericytes via SGLT2.a Representative example of the expression of SLC5A2 (SGLT2) in cultured human brain microvascular pericytes, HEK-293T, and HK2 cells assessed using RT-PCR and quantification using qPCR (n = 3). The mRNA expression was normalized to that of RNA18S. b Representative immunoblottings for SGLT2, CD13, and beta -actin in cultured pericytes of total lysates or membrane fractions obtained by ultracentrifugation, which were transfected with pcDNA3 or pcDNA3-SLC5A2. Human kidney lysates were used as a positive control for SGLT2 expression. c A representative immunoblotting for SGLT2 in cultured brain pericytes after SLC5A2 overexpression with or without PNGase F treatment. The black arrowhead indicates glycosylated SGLT2 and the white arrowhead indicates unglycosylated SGLT2. d Representative images of immunofluorescence for SGLT2 (green), CD13 (red), and DAPI in a cultured brain pericyte (scale bar = 20 μm). e, f (e) Brain pericytes were incubated in Na+-containing HEPES-buffered saline, Na+-free solution, or Na+-containing solution with 100 or 1,000 nmol/L luseogliflozin for 15 min, followed by incubation with additional 200 μmol/L of 2-NBDG (scale bar = 20 μm). f Fluorescence intensity of 2-NBDG was measured using a microplate reader and normalized to that of Hoechst 33342 (n = 8). Data are presented as dot-plots of individual experiments and mean values ± SD. n.s. (not significant) P > 0.05, ***P < 0.001, ****P < 0.0001 by One-way ANOVA followed by Bonferroni’s post hoc test. SGLT2 sodium-glucose cotransporter 2, Luseo luseogliflozin, pMCAO permanent middle cerebral artery occlusion, 2-NBDG 2-deoxy-2-[(7-nitro-2,1,3-benzoxadiazol-4-yl) amino]-d-glucose. Image collected and cropped by CiteAb from the following open publication (https://www.nature.com/articles/s42003-022-03605-4), licensed under a CC-BY license. Not internally tested by R&D Systems.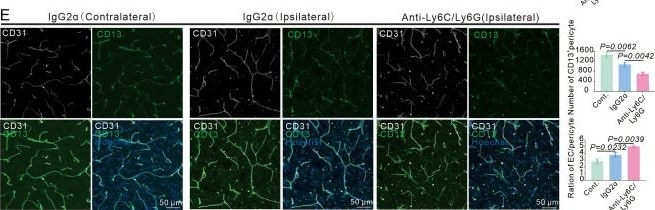
Detection of Aminopeptidase N/CD13 by Immunohistochemistry
Infiltrating myeloid cells promote vascular function recovery after stroke.(A) Flow cytometry analysis of the proportion of myeloid cells from bone marrow, blood, and ipsilateral brain after mice injected with anti-Ly6C/Ly6G at RP34D (n = 4). (B) Quantitative analysis of the proportion of monocyte and neutrophil in (A) (n = 4). (C) Image showing the change of cerebral blood flow (CBF) in wild-type (WT) mice injected with anti-Ly6C/Ly6G at RP34D after middle cerebral artery occlusion (MCAO) and quantitative analysis of the change of CBF (n = 5). (D) Flow cytometry analysis of the proportion of CD13+ cells and CD31+ cells in WT mice injected with anti-Ly6C/Ly6G at RP34D after MCAO and quantitative analysis of the percentage (n = 3). (E) Immunofluorescence analysis of the proportion of CD13+ cells and CD31+ cells in WT mice injected with anti-Ly6C/Ly6G at RP34D after MCAO and quantitative analysis of the percentage (n = 3). Data are presented as mean ± SEM, unpaired two-tailed Student’s t-test (B-E). Image collected and cropped by CiteAb from the following open publication (https://elifesciences.org/articles/105593), licensed under a CC-BY license. Not internally tested by R&D Systems.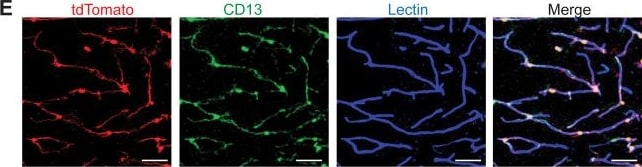
Detection of Aminopeptidase N/CD13 by Immunohistochemistry
Atp13a5-driven tdTomato reporter expression in brain pericytes. A, tdTomato expression on brain capillary of Atp13a5-2A-CreERT2-IRES-tdTomato knock-in mice, but not on VCAM1+ venules. Scale bar, 50 µm. B, Representative images from the boxed regions in A. C, tdTomato expression on brain capillary, but not on SMA+ arterioles. Scale bar, 50 µm. D, The percentage of tdTomato+ cells distributed among arterioles, capillaries, and venules in the cortex. Arteries and arterioles are identified by vessel diameter in combination with the presence of SMA. Veins and venules are identified by vessel diameter in combination with the presence of VCAM1 and the absence of SMA. Lectin+ vessels with diameters smaller than 6 µm are considered as capillaries. n = 3 mice. E, Colocalization of tdTomato with pericyte marker CD13 (green) on lectin (blue) positive endothelium. Scale bar, 50 µm. F, Quantification of the percentage of tdTomato+ cells in CD13+ pericytes. n = 9 mice. Data are presented in mean ± SEM. Additional data are provided in Extended Data Figures 3-1 and 3-2. Image collected and cropped by CiteAb from the following open publication (https://pubmed.ncbi.nlm.nih.gov/39261008), licensed under a CC-BY license. Not internally tested by R&D Systems.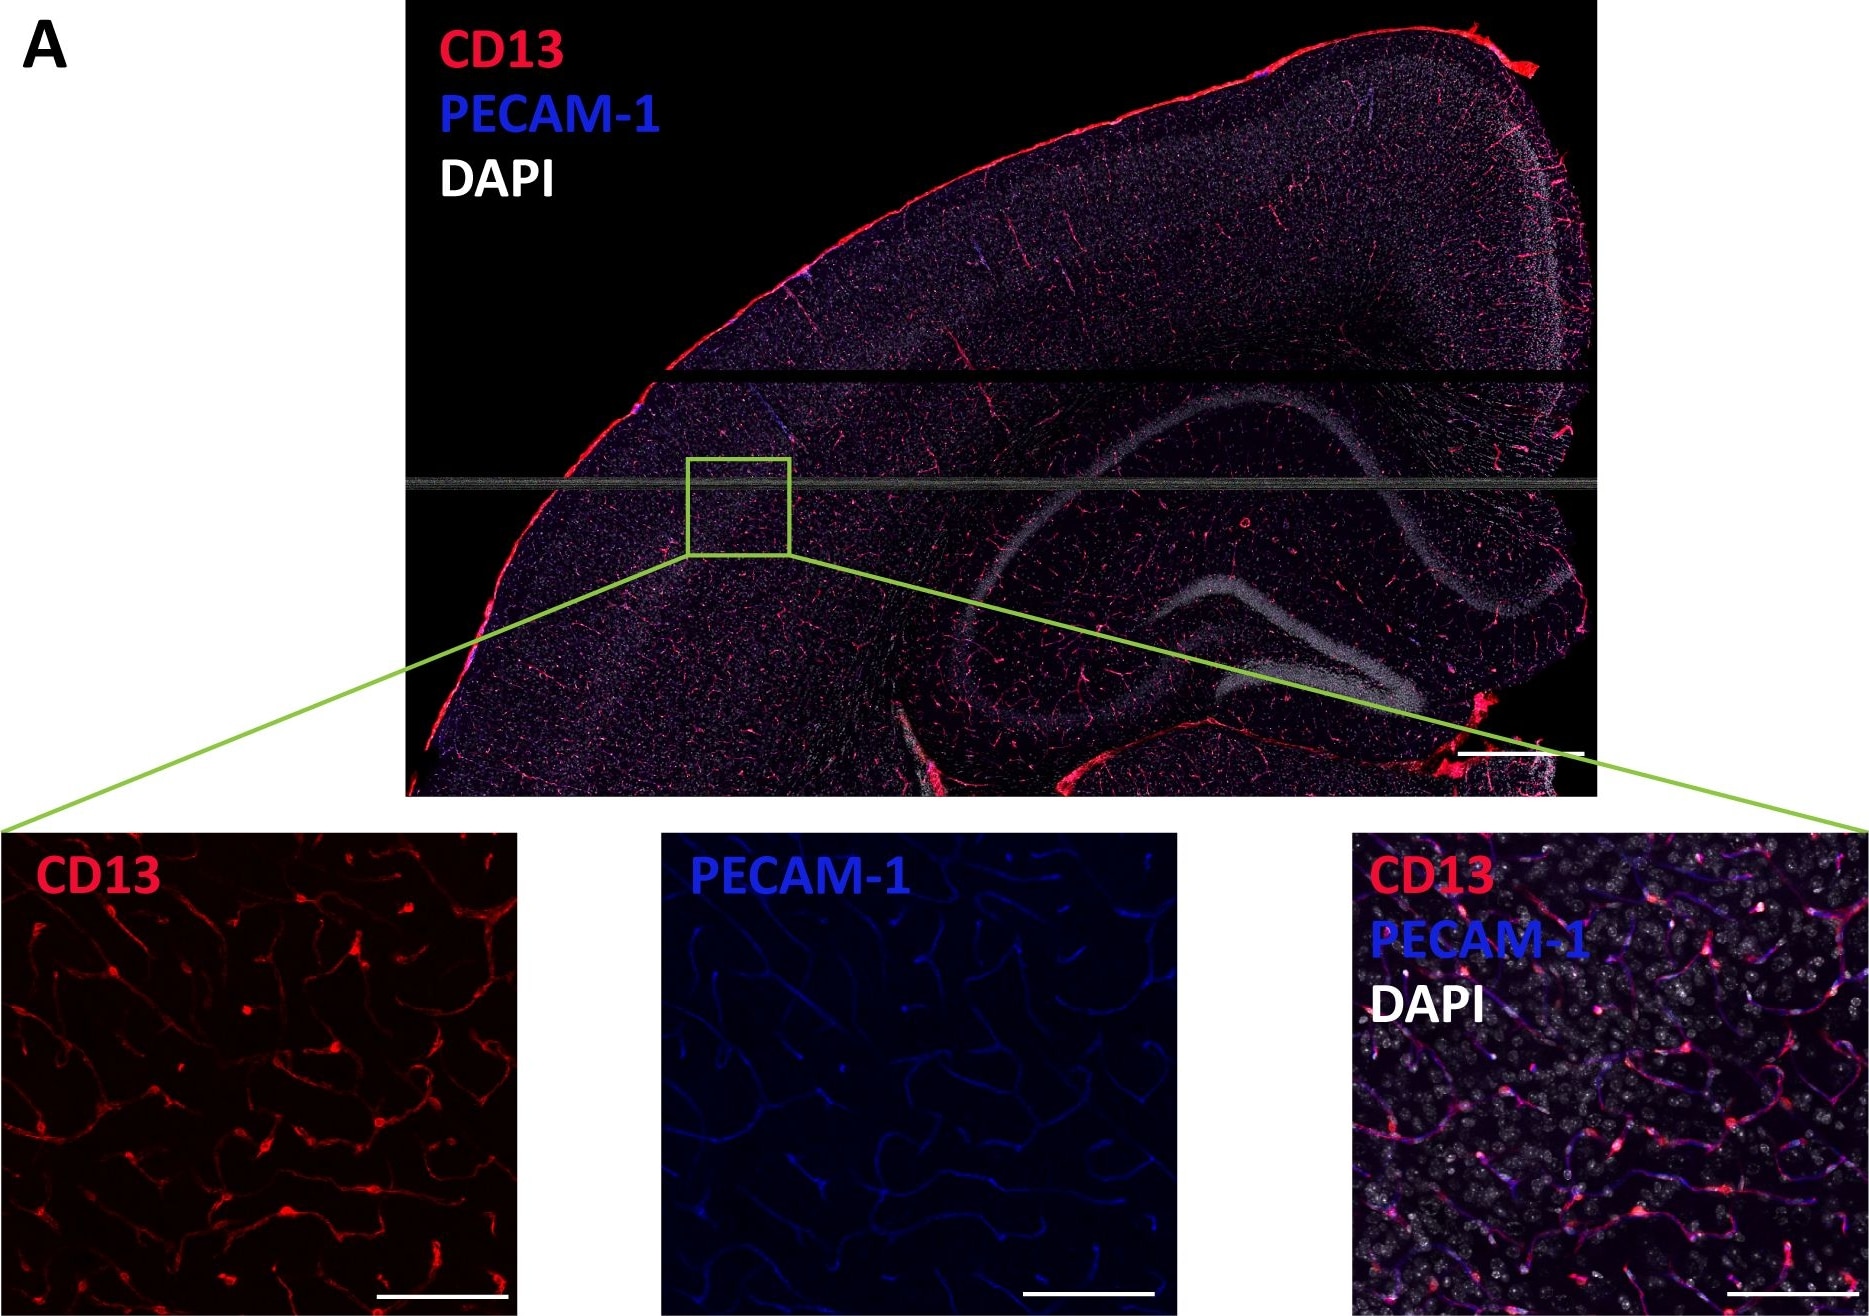
Detection of Aminopeptidase N/CD13 by Immunohistochemistry
Histological Visualization of Strain-Dependent Differences in Pericyte and Endothelial Cell Abundance in CC Mouse Cortex.(A) Representative image of a CC mouse brain section stained with CD13, PECAM-1, and DAPI (scale bar = 500 μm). Several (n = 3-4) regions of interest (ROI) per section were selected in somatosensory motor area of cortex (zoomed image on the bottom; scale bar = 100 μm) for quantification. (B-C) Representative images highlighting (B) pericytes, defined by colocalization of CD13 and DAPI, and (C) endothelial cells, defined by colocalization of PECAM-1 and DAPI, across indicated strains. Quantification was based on 3 animals per strain, 2-3 sections per animal, and 2-4 ROIs per section. Image collected and cropped by CiteAb from the following open publication (https://dx.plos.org/10.1371/journal.pone.0323827), licensed under a CC-BY license. Not internally tested by R&D Systems.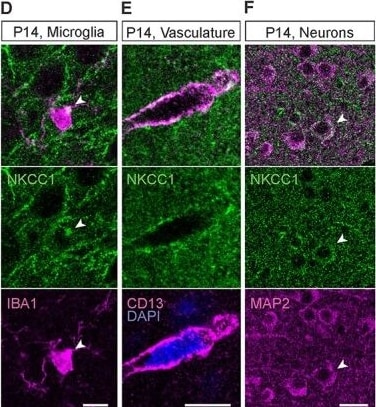
Detection of Aminopeptidase N/CD13 by Immunohistochemistry
At P14, NKCC1 is strongly expressed in oligodendrocytes, microglia, vasculature, and the progenitor cells of the DG. (A) Overview of the NKCC1 IR in the P14 cortex and hippocampus. Except for the subgranular zone of the DG, majority of the NKCC1 IR colocalizes with the oligodendrocytic markers MBP and CNPase. (B) Strong NKCC1 IR in myelinated fibers and in the OL somata. Right: Some of the NKCC1 immunoreactive somata strongly expressed CNPase and MBP (asterisk), while others only expressed MBP (pound sign), possibly indicating different maturational stages. (C) P14 astrocytes were largely immunoreactive for NKCC1. (D) Similar to adult microglia, the P14 microglia exhibited one or a few NKCC1 IR clusters in the soma, often close to a ramification. (E) Clear NKCC1 IR was visible on blood vessels, colocalizing with the pericytic marker CD13. (F) While most cortical and hippocampal neurons did not show detectable levels of NKCC1 IR, some clearly NKCC1 positive cells (shown by the arrow head) were found in the cortex. (G) In the subgranular zone of the DG, GFAP positive neuronal progenitor cells strongly expressed NKCC1 (left). The GFAP-positive radial glia-like processes of the neuronal stem cells were also strongly NKCC1 immunoreactive (right). Scale bars A: 100 μm, B: 100 μm (left) and 10 μm (right), C, D and E: 10 μm, F: 20 μm, G: 5 μm (left) and 10 μm (right). Image collected and cropped by CiteAb from the following open publication (https://pubmed.ncbi.nlm.nih.gov/36573432), licensed under a CC-BY license. Not internally tested by R&D Systems.Applications for Mouse Aminopeptidase N/CD13 Antibody
Application
Recommended Usage
CyTOF-ready
Ready to be labeled using established conjugation methods. No BSA or other carrier proteins that could interfere with conjugation.
Flow Cytometry
2.5 µg/106 cells
Sample: bEnd.3 mouse endothelioma cell line
Sample: bEnd.3 mouse endothelioma cell line
Immunocytochemistry
5-15 µg/mL
Sample: Immersion fixed mouse splenocytes
Sample: Immersion fixed mouse splenocytes
Immunohistochemistry
0.1-15 µg/mL
Sample: Immersion fixed paraffin-embedded sections of mouse kidney
Sample: Immersion fixed paraffin-embedded sections of mouse kidney
Immunoprecipitation
25 µg/mL
Sample: Conditioned cell culture medium spiked with Recombinant Mouse Aminopeptidase N/CD13 (Catalog # 2335-ZN), see our available Western blot detection antibodies
Sample: Conditioned cell culture medium spiked with Recombinant Mouse Aminopeptidase N/CD13 (Catalog # 2335-ZN), see our available Western blot detection antibodies
Western Blot
0.1 µg/mL
Sample: Recombinant Mouse Aminopeptidase N/CD13 (Catalog # 2335-ZN)
Sample: Recombinant Mouse Aminopeptidase N/CD13 (Catalog # 2335-ZN)
Reviewed Applications
Read 1 review rated 5 using AF2335 in the following applications:
Flow Cytometry Panel Builder
Bio-Techne Knows Flow Cytometry
Save time and reduce costly mistakes by quickly finding compatible reagents using the Panel Builder Tool.
Advanced Features
- Spectra Viewer - Custom analysis of spectra from multiple fluorochromes
- Spillover Popups - Visualize the spectra of individual fluorochromes
- Antigen Density Selector - Match fluorochrome brightness with antigen density

Formulation, Preparation, and Storage
Purification
Antigen Affinity-purified
Reconstitution
Reconstitute at 0.2 mg/mL in sterile PBS. For liquid material, refer to CoA for concentration.
Loading...
Formulation
Lyophilized from a 0.2 μm filtered solution in PBS with Trehalose. *Small pack size (SP) is supplied either lyophilized or as a 0.2 µm filtered solution in PBS.
Shipping
Lyophilized product is shipped at ambient temperature. Liquid small pack size (-SP) is shipped with polar packs. Upon receipt, store immediately at the temperature recommended below.
Stability & Storage
Use a manual defrost freezer and avoid repeated freeze-thaw cycles.
- 12 months from date of receipt, -20 to -70 °C as supplied.
- 1 month, 2 to 8 °C under sterile conditions after reconstitution.
- 6 months, -20 to -70 °C under sterile conditions after reconstitution.
Calculators
Background: Aminopeptidase N/CD13
References
- Chen, H. et al. (1996) J. Immunol. 157:2593.
- Larsen, S.L. et al. (1996) J. Exp. Med. 184:183.
- Hansen, A.S. et al. (1993) Eur. J. Immunol. 23:2358.
- Turner, A.J. (2004) in Handbook of Proteolytic Enzymes (ed. Barrett, et al.) p. 289 Academic Press, San Diego.
Alternate Names
Aminopeptidase M, ANPEP, APN, CD13, gp150, PEPN
Gene Symbol
ANPEP
UniProt
Additional Aminopeptidase N/CD13 Products
Product Documents for Mouse Aminopeptidase N/CD13 Antibody
Certificate of Analysis
To download a Certificate of Analysis, please enter a lot or batch number in the search box below.
Note: Certificate of Analysis not available for kit components.
Product Specific Notices for Mouse Aminopeptidase N/CD13 Antibody
For research use only
Citations for Mouse Aminopeptidase N/CD13 Antibody
 Powered by Bioz
Customer Reviews for Mouse Aminopeptidase N/CD13 Antibody (1)
5 out of 5
1 Customer Rating
Have you used Mouse Aminopeptidase N/CD13 Antibody?
Submit a review and receive an Amazon gift card!
$25/€18/£15/$25CAN/¥2500 for a review with an image
$10/€7/£6/$10CAN/¥1110 for a review without an image
Submit a review
Customer Images
Showing
1
-
1 of
1 review
Showing All
Filter By:
-
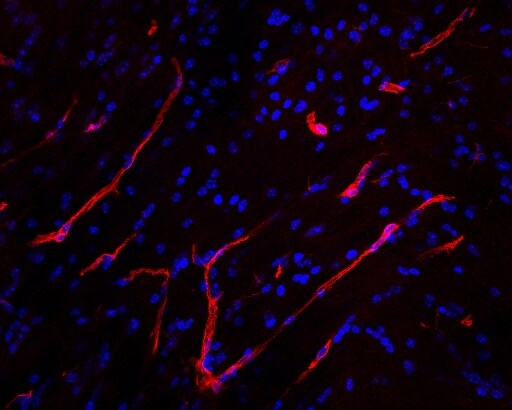
Application: Immunohistochemistry-FrozenSample Tested: Mouse brainSpecies: MouseVerified Customer | Posted 07/25/2022Brain pericytes surrounding blood vessels were stained with Mouse Aminopeptidase N/CD13 antibody.Mouse brain tissue (12 micrometer thickness) was incubated overnight with AF2335, 1:500, in PBS 1x at 4C. The day after, the slide was washed 3 x PBS 1x and then incubated with secondary anti-goat antibody AlexaFluor 568-conjugated, 1:1000 for 2 hours at r.t. After counterstaining with DAPI, image was acquired with confocal microscopy. AF2335 signal identifies brain pericytes surrounding blood vessels.

There are no reviews that match your criteria.
Protocols
Find general support by application which include: protocols, troubleshooting, illustrated assays, videos and webinars.
- 7-Amino Actinomycin D (7-AAD) Cell Viability Flow Cytometry Protocol
- Antigen Retrieval Protocol (PIER)
- Antigen Retrieval for Frozen Sections Protocol
- Appropriate Fixation of IHC/ICC Samples
- Cellular Response to Hypoxia Protocols
- Chromogenic IHC Staining of Formalin-Fixed Paraffin-Embedded (FFPE) Tissue Protocol
- Chromogenic Immunohistochemistry Staining of Frozen Tissue
- ClariTSA™ Fluorophore Kits
- Detection & Visualization of Antibody Binding
- Extracellular Membrane Flow Cytometry Protocol
- Flow Cytometry Protocol for Cell Surface Markers
- Flow Cytometry Protocol for Staining Membrane Associated Proteins
- Flow Cytometry Staining Protocols
- Flow Cytometry Troubleshooting Guide
- Fluorescent IHC Staining of Frozen Tissue Protocol
- Graphic Protocol for Heat-induced Epitope Retrieval
- Graphic Protocol for the Preparation and Fluorescent IHC Staining of Frozen Tissue Sections
- Graphic Protocol for the Preparation and Fluorescent IHC Staining of Paraffin-embedded Tissue Sections
- Graphic Protocol for the Preparation of Gelatin-coated Slides for Histological Tissue Sections
- ICC Cell Smear Protocol for Suspension Cells
- ICC Immunocytochemistry Protocol Videos
- ICC for Adherent Cells
- IHC Sample Preparation (Frozen sections vs Paraffin)
- Immunocytochemistry (ICC) Protocol
- Immunocytochemistry Troubleshooting
- Immunofluorescence of Organoids Embedded in Cultrex Basement Membrane Extract
- Immunofluorescent IHC Staining of Formalin-Fixed Paraffin-Embedded (FFPE) Tissue Protocol
- Immunohistochemistry (IHC) and Immunocytochemistry (ICC) Protocols
- Immunohistochemistry Frozen Troubleshooting
- Immunohistochemistry Paraffin Troubleshooting
- Immunoprecipitation Protocol
- Intracellular Flow Cytometry Protocol Using Alcohol (Methanol)
- Intracellular Flow Cytometry Protocol Using Detergents
- Intracellular Nuclear Staining Flow Cytometry Protocol Using Detergents
- Intracellular Staining Flow Cytometry Protocol Using Alcohol Permeabilization
- Intracellular Staining Flow Cytometry Protocol Using Detergents to Permeabilize Cells
- Preparing Samples for IHC/ICC Experiments
- Preventing Non-Specific Staining (Non-Specific Binding)
- Primary Antibody Selection & Optimization
- Propidium Iodide Cell Viability Flow Cytometry Protocol
- Protocol for Heat-Induced Epitope Retrieval (HIER)
- Protocol for Liperfluo
- Protocol for Making a 4% Formaldehyde Solution in PBS
- Protocol for VisUCyte™ HRP Polymer Detection Reagent
- Protocol for the Characterization of Human Th22 Cells
- Protocol for the Characterization of Human Th9 Cells
- Protocol for the Fluorescent ICC Staining of Cell Smears - Graphic
- Protocol for the Fluorescent ICC Staining of Cultured Cells on Coverslips - Graphic
- Protocol for the Preparation & Fixation of Cells on Coverslips
- Protocol for the Preparation and Chromogenic IHC Staining of Frozen Tissue Sections
- Protocol for the Preparation and Chromogenic IHC Staining of Frozen Tissue Sections - Graphic
- Protocol for the Preparation and Chromogenic IHC Staining of Paraffin-embedded Tissue Sections
- Protocol for the Preparation and Chromogenic IHC Staining of Paraffin-embedded Tissue Sections - Graphic
- Protocol for the Preparation and Fluorescent ICC Staining of Cells on Coverslips
- Protocol for the Preparation and Fluorescent ICC Staining of Non-adherent Cells
- Protocol for the Preparation and Fluorescent ICC Staining of Stem Cells on Coverslips
- Protocol for the Preparation and Fluorescent IHC Staining of Frozen Tissue Sections
- Protocol for the Preparation and Fluorescent IHC Staining of Paraffin-embedded Tissue Sections
- Protocol for the Preparation of Gelatin-coated Slides for Histological Tissue Sections
- Protocol for the Preparation of a Cell Smear for Non-adherent Cell ICC - Graphic
- Protocol: Annexin V and PI Staining by Flow Cytometry
- Protocol: Annexin V and PI Staining for Apoptosis by Flow Cytometry
- R&D Systems Quality Control Western Blot Protocol
- TUNEL and Active Caspase-3 Detection by IHC/ICC Protocol
- The Importance of IHC/ICC Controls
- Troubleshooting Guide: Fluorokine Flow Cytometry Kits
- Troubleshooting Guide: Immunohistochemistry
- Troubleshooting Guide: Western Blot Figures
- Western Blot Conditions
- Western Blot Protocol
- Western Blot Protocol for Cell Lysates
- Western Blot Troubleshooting
- Western Blot Troubleshooting Guide
- View all Protocols, Troubleshooting, Illustrated assays and Webinars
Loading...
Associated Pathways
