Mouse IL-1 beta/IL-1F2 Antibody
R&D Systems | Catalog # AB-401-NA

Scientific images may be resized, cropped, or adjusted for brightness or contrast for presentation purposes. These updates are limited to presentation and do not affect the underlying scientific interpretation of the data. Where available, additional source data may be provided upon request.
Key Product Details
Validated by
Species Reactivity
Validated:
Cited:
Applications
Validated:
Cited:
Label
Antibody Source
Product Specifications
Immunogen
Val118-Ser269
Accession # P10749
Specificity
Clonality
Host
Isotype
Endotoxin Level
Scientific Data Images for Mouse IL-1 beta/IL-1F2 Antibody
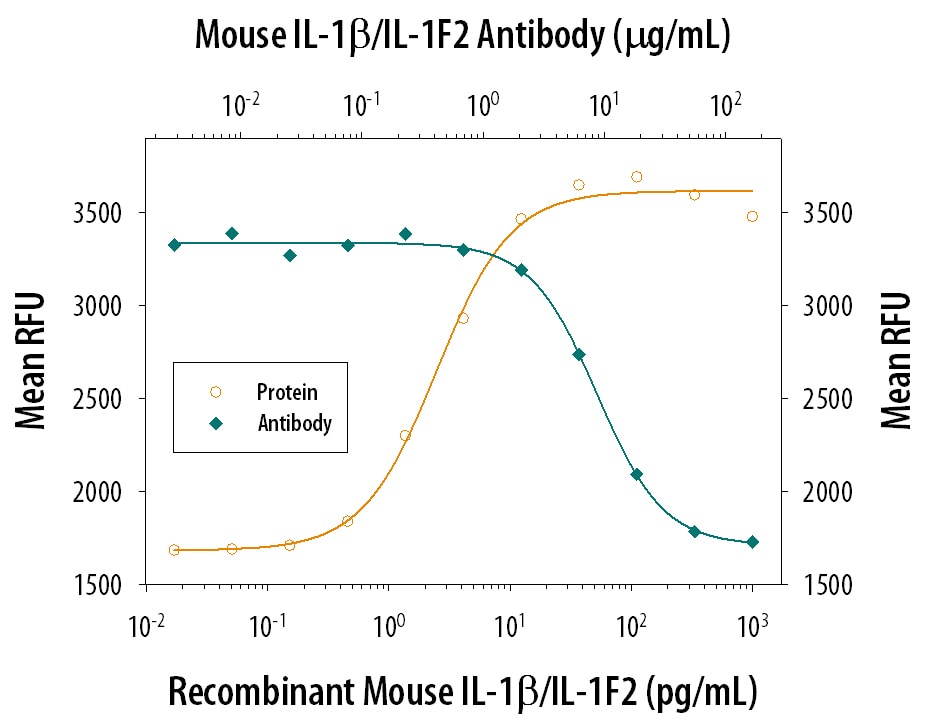
Cell Proliferation Induced by IL‑1 beta /IL‑1F2 and Neutral-ization by Mouse IL‑1 beta /IL‑1F2 Antibody.
Recombinant Mouse IL-1 beta /IL-1F2 (401-ML) stimulates proliferation in the the D10.G4.1 mouse helper T cell line in a dose-dependent manner (orange line). Proliferation elicited by Recombinant Mouse IL-1 beta /IL-1F2 (10 pg/mL) is neutralized (green line) by increasing concentrations of Goat Anti-Mouse IL-1 beta /IL-1F2 Polyclonal Antibody (Catalog # AB-401-NA). The ND50 is typically 2-12 µg/mL.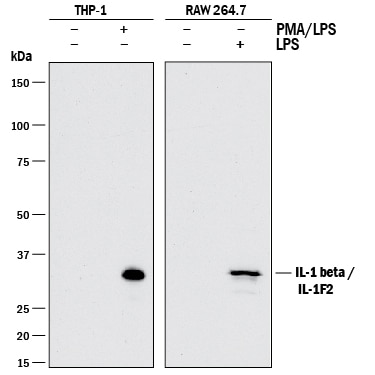
Detection of Human and Mouse IL‑1 beta /IL‑1F2 by Western Blot.
Western blot shows lysates of THP-1 human acute monocytic leukemia cell line untreated (-) or treated (+) with 200 nM PMA for 24 hours and 10 µg/mL LPS for 4 hours and RAW 264.7 mouse monocyte/macrophage cell line untreated (-) or treated (+) with 10 µg/mL LPS for 24 hours. PVDF membrane was probed with 1 µg/mL of Goat Anti-Mouse IL-1 beta /IL-1F2 Polyclonal Antibody (Catalog # AB-401-NA) followed by HRP-conjugated Anti-Goat IgG Secondary Antibody (HAF017). A specific band was detected for IL-1 beta /IL-1F2 at approximately 35 kDa (as indicated). This experiment was conducted under reducing conditions and using Immunoblot Buffer Group 1.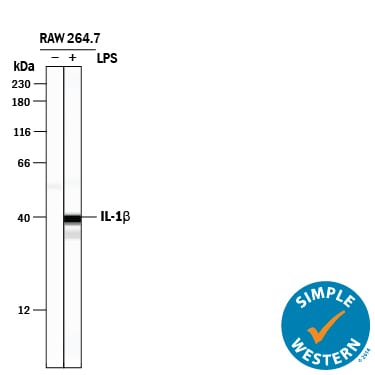
Detection of Mouse IL‑1 beta /IL‑1F2 by Simple WesternTM.
Simple Western lane view shows lysates of RAW 264.7 mouse monocyte/macrophage cell line untreated (-) or treated (+) with 10 µg/mL LPS for 24 hours, loaded at 0.5 mg/mL. A specific band was detected for IL‑1 beta /IL‑1F2 at approximately 40 kDa (as indicated) using 50 µg/mL of Goat Anti-Mouse IL‑1 beta /IL‑1F2 Polyclonal Antibody (Catalog # AB-401-NA). This experiment was conducted under reducing conditions and using the 12-230 kDa separation system.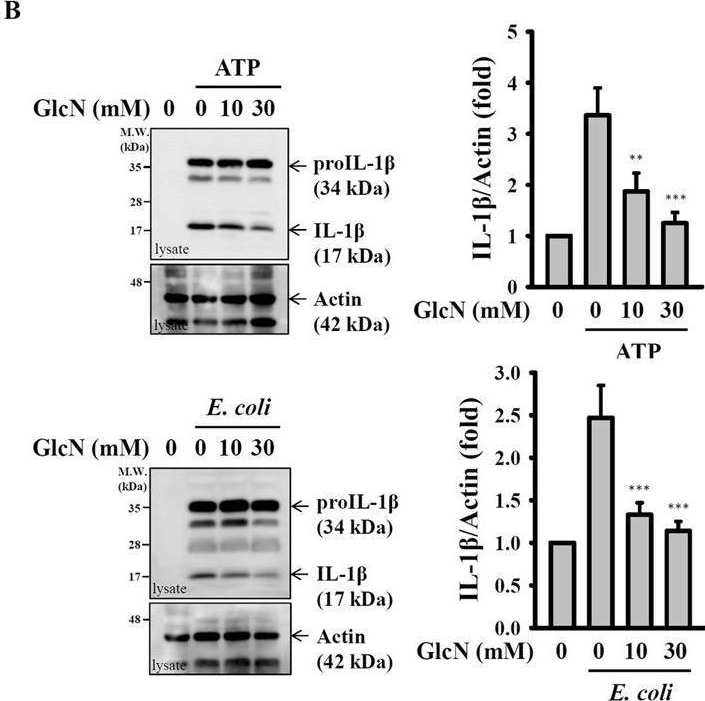
Detection of IL-1 beta /IL-1F2 by Western Blot
GlcN inhibits caspase-1 activation and the release of IL-1 beta, IL-18 and ASC. (A–D) J774A.1 macrophages were incubated for 4 h with LPS (1 µg/ml) followed by incubation for 2 h with GlcN. Cells were then incubated with ATP (5 mM, 0.5 h) or infected with E. coli (30 MOI, 1 h). The expression levels of IL-1 beta and IL-18 (A), caspase-1 (C), ASC (D) in the supernatants and IL-1 beta in the cell lysates (B) were analysed by Western blotting. (E) J774A.1 macrophages were incubated for 4 h with LPS (1 µg/ml) followed by incubation for 2 h with GlcN, D-(+)-glucose (Glu), D-glucosamine 3-sulphate (GlcN-3S), D-(+)-galactosamine hydrochloride (GalN) and N-acetyl-D-glucosamine (GlcNAc) for 2 h, followed by incubation with ATP (5 mM) for 0.5 h. The IL-1 beta expression levels in the supernatants were measured by ELISA. (F) J774A.1 macrophages were incubated for 4 h with LPS (1 µg/ml) or PamsCSK4 (1 µg/ml; for non-canonical inflammasome) followed by incubation for 2 h with GlcN, followed by transfection with poly(dA/dT) (2 µg/ml) or LPS (2 µg/ml) for 6 h or by Salmonella infection (30 MOI) for 2 h. The IL-1 beta expression levels in the supernatants were measured by ELISA. The ELISA data are expressed as the mean ± SD of separate experiments as indicated. The Western blotting results are representative of three different experiments and the histogram shows the quantification expressed as the mean ± SD for these three experiments. *, *** and **** indicate a significant difference at the level of p < 0.05, p < 0.001 and p < 0.0001, respectively, compared to NLRP3 activator-treated cells. (One-way ANOVA with Dunnett’s multiple comparisons test). The blots in (A–D) were cropped from different gels; full-length blots are included in the “Supplementary Information”. Image collected and cropped by CiteAb from the following open publication (https://pubmed.ncbi.nlm.nih.gov/30944389), licensed under a CC-BY license. Not internally tested by R&D Systems.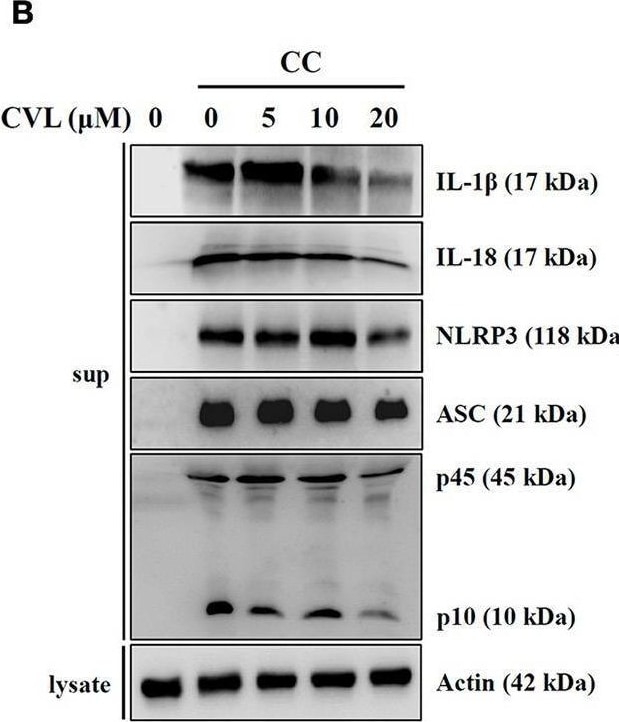
Detection of IL-1 beta /IL-1F2 by Western Blot
CVL reduced NLRP3 inflammasome activation. (A) J774A.1 macrophages were incubated for 5 h with LPS (1 μg/ml) (LPS priming) followed by incubation for 0.5 h with CVL. Cells were then incubated with CC (100 μg/ml, 24 h), MSU (100 μg/ml, 24 h), ATP (5 mM, 0.5 h), nigericin (10 μM, 0.5 h), and nano-SiO2 (100 μg/ml, 24 h). (B) LPS-primed J774A.1 macrophages were incubated for 0.5 h with CVL followed by incubation with CC (100 μg/ml, 24 h), MSU (100 μg/ml, 24 h), and ATP (5 mM, 0.5 h). (C) LPS-primed BMDM were incubated for 0.5 h with CVL followed by incubation with CC (100 μg/ml) for an additional 24 h. (D) LPS-primed or Pam3CSK4-primed (for LPS transfection only) cells were incubated for 0.5 h with CVL followed by transfection with poly(dA/dT) (2 μg/ml, 6 h), FLA-ST (1 μg/ml, 6 h), MDP (10 μg/ml, 6 h), or LPS (2 μg/ml, 6 h). The levels of IL-1 beta, IL-18, NLRP3, ASC, and caspase-1 in the culture medium were measured by Western blot. The IL-1 beta levels in the supernatants were measured by ELISA. The Western blot results are representative of three different experiments. The ELISA data are expressed as the mean ± SD of three separate experiments. *, **, and *** indicate a significant difference at the level of p < 0.05, p < 0.01, and p < 0.001, respectively, compared to activator-treated cells. Image collected and cropped by CiteAb from the following open publication (https://pubmed.ncbi.nlm.nih.gov/30186288), licensed under a CC-BY license. Not internally tested by R&D Systems.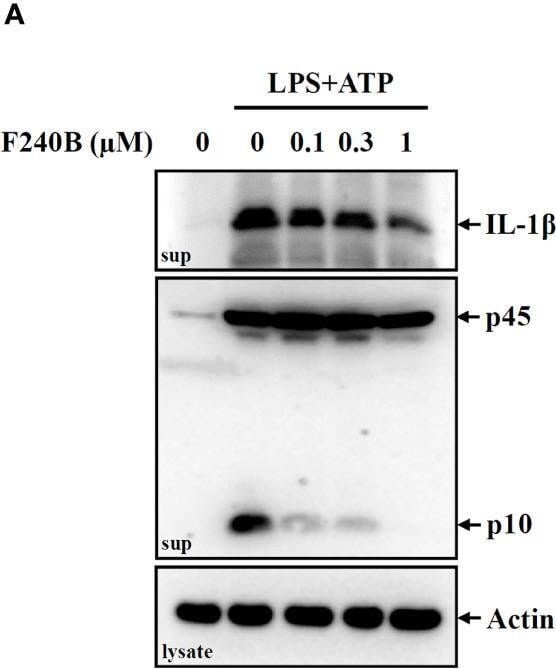
Detection of IL-1 beta /IL-1F2 by Western Blot
F240B inhibits the NLRP3 inflammasome through autophagy induction. (A, B) J774A.1 macrophages were incubated with 1 µg/ml LPS for 5 h followed by incubated with F240B for 3 h. Cells then incubated with 5 mM ATP for 0.5 h. The levels of IL-1 beta and caspase-1 (A) or NLRP3 and ASC (B) in the supernatants were measured by Western blotting. (C) J774A.1 macrophages were incubated with 1 µg/ml LPS for 5 h followed by incubated with 1 µM F240B in the presence or absence of 5 mM 3-MA for 3 h. Cells then were incubated with 5 mM ATP or 10 μM nigericin for 0.5 h. The levels of IL-1 beta in the supernatants were measured by ELISA. (D) Wild-type and LC3-knockout J774A.1 macrophages were incubated with 1 µg/ml LPS for 5 h followed by incubated with 1 µM F240B for 3 h. Cells then incubated with 5 mM ATP or 10 μM nigericin for 0.5 h. The levels of IL-1 beta in the supernatants were measured by ELISA. The data are expressed as the mean ± SD of three separate experiments. * and *** indicate a significant difference at the level of p < 0.05 and p < 0.001, respectively. Image collected and cropped by CiteAb from the following open publication (https://pubmed.ncbi.nlm.nih.gov/33424855), licensed under a CC-BY license. Not internally tested by R&D Systems.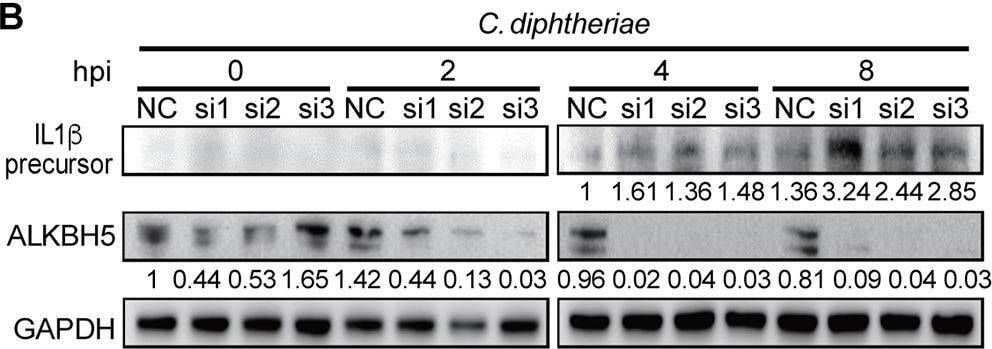
Detection of IL-1 beta /IL-1F2 by Western Blot
ALKBH5 regulates the expression of innate immune response genes during bacterial and viral infections in RAW264.7 cells. (A) ALKBH5 knockdown enhanced the expression levels of the IL-1 beta, CSF3, TGM2, and SRC transcripts during P. aeruginosa, C. diphtheriae, HSV-1, or HSV-1 ICP34.5 mutant infection. (B to D) ALKBH5 knockdown enhanced the protein level of IL-1 beta during infection by C. diphtheriae (B), P. aeruginosa (C), or the HSV-1 ICP34.5 mutant (D). (E) ALKBH5 overexpression inhibited the expression of the IL-1 beta, CSF3, TGM2, and SRC genes during P. aeruginosa infection as measured by RT-qPCR. (F) ALKBH5 overexpression inhibited the protein level of IL-1 beta during P. aeruginosa infection as measured by Western blotting. Image collected and cropped by CiteAb from the following open publication (https://pubmed.ncbi.nlm.nih.gov/36625590), licensed under a CC-BY license. Not internally tested by R&D Systems.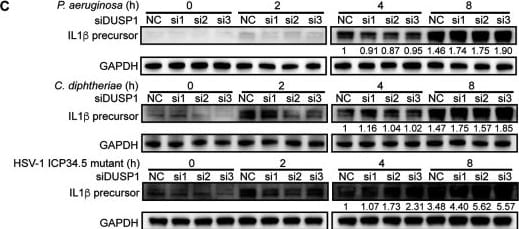
Detection of IL-1 beta /IL-1F2 by Western Blot
DUSP1 regulates p38 and JNK phosphorylation and the expression of innate immune response genes during bacterial and viral infections in RAW264.7 cells. (A) DUSP1 knockdown enhanced p38 and JNK phosphorylation during infection by P. aeruginosa, C. diphtheriae, HSV-1, or the HSV-1 ICP34.5 mutant. (B) DUSP1 knockdown enhanced the expression of the IL-1 beta, CSF3, TGM2, and SRC genes during infection by P. aeruginosa, C. diphtheriae, HSV-1, or the HSV-1 ICP34.5 mutant. (C) DUSP1 knockdown enhanced the protein level of IL-1 beta during infection by P. aeruginosa, C. diphtheriae, or the HSV-1 ICP34.5 mutant. Image collected and cropped by CiteAb from the following open publication (https://pubmed.ncbi.nlm.nih.gov/36625590), licensed under a CC-BY license. Not internally tested by R&D Systems.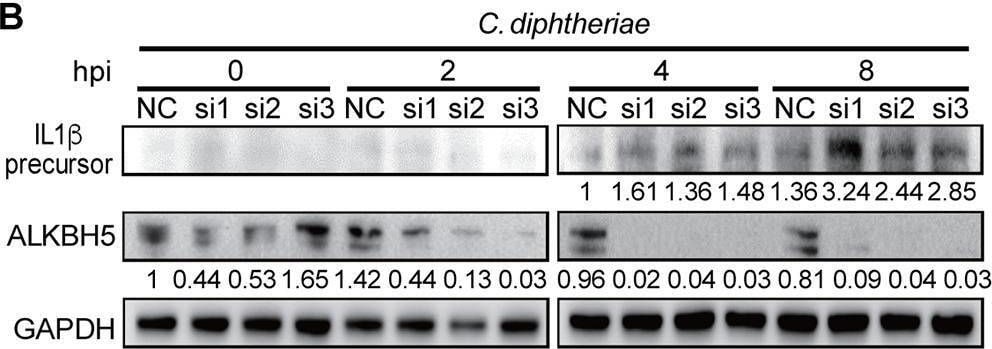
Detection of IL-1 beta /IL-1F2 by Western Blot
ALKBH5 regulates the expression of innate immune response genes during bacterial and viral infections in RAW264.7 cells. (A) ALKBH5 knockdown enhanced the expression levels of the IL-1 beta, CSF3, TGM2, and SRC transcripts during P. aeruginosa, C. diphtheriae, HSV-1, or HSV-1 ICP34.5 mutant infection. (B to D) ALKBH5 knockdown enhanced the protein level of IL-1 beta during infection by C. diphtheriae (B), P. aeruginosa (C), or the HSV-1 ICP34.5 mutant (D). (E) ALKBH5 overexpression inhibited the expression of the IL-1 beta, CSF3, TGM2, and SRC genes during P. aeruginosa infection as measured by RT-qPCR. (F) ALKBH5 overexpression inhibited the protein level of IL-1 beta during P. aeruginosa infection as measured by Western blotting. Image collected and cropped by CiteAb from the following open publication (https://pubmed.ncbi.nlm.nih.gov/36625590), licensed under a CC-BY license. Not internally tested by R&D Systems.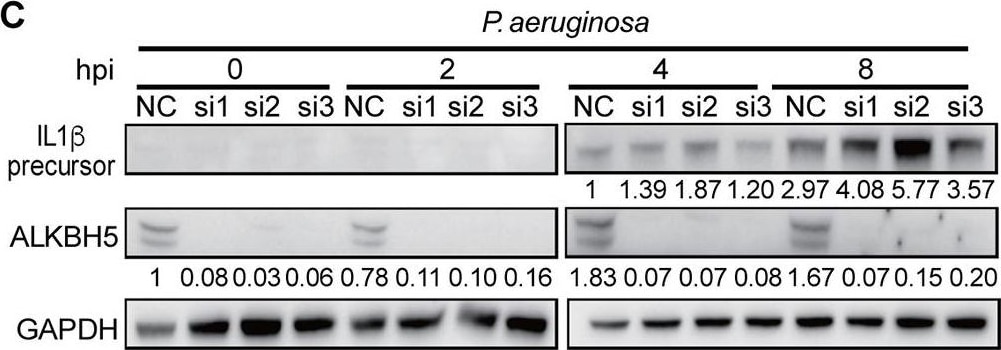
Detection of IL-1 beta /IL-1F2 by Western Blot
ALKBH5 regulates the expression of innate immune response genes during bacterial and viral infections in RAW264.7 cells. (A) ALKBH5 knockdown enhanced the expression levels of the IL-1 beta, CSF3, TGM2, and SRC transcripts during P. aeruginosa, C. diphtheriae, HSV-1, or HSV-1 ICP34.5 mutant infection. (B to D) ALKBH5 knockdown enhanced the protein level of IL-1 beta during infection by C. diphtheriae (B), P. aeruginosa (C), or the HSV-1 ICP34.5 mutant (D). (E) ALKBH5 overexpression inhibited the expression of the IL-1 beta, CSF3, TGM2, and SRC genes during P. aeruginosa infection as measured by RT-qPCR. (F) ALKBH5 overexpression inhibited the protein level of IL-1 beta during P. aeruginosa infection as measured by Western blotting. Image collected and cropped by CiteAb from the following open publication (https://pubmed.ncbi.nlm.nih.gov/36625590), licensed under a CC-BY license. Not internally tested by R&D Systems.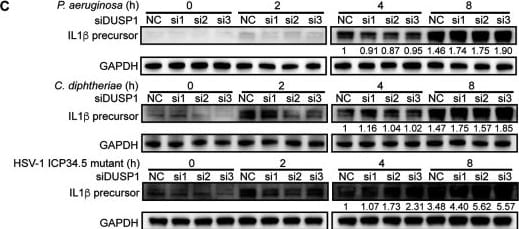
Detection of IL-1 beta /IL-1F2 by Western Blot
DUSP1 regulates p38 and JNK phosphorylation and the expression of innate immune response genes during bacterial and viral infections in RAW264.7 cells. (A) DUSP1 knockdown enhanced p38 and JNK phosphorylation during infection by P. aeruginosa, C. diphtheriae, HSV-1, or the HSV-1 ICP34.5 mutant. (B) DUSP1 knockdown enhanced the expression of the IL-1 beta, CSF3, TGM2, and SRC genes during infection by P. aeruginosa, C. diphtheriae, HSV-1, or the HSV-1 ICP34.5 mutant. (C) DUSP1 knockdown enhanced the protein level of IL-1 beta during infection by P. aeruginosa, C. diphtheriae, or the HSV-1 ICP34.5 mutant. Image collected and cropped by CiteAb from the following open publication (https://pubmed.ncbi.nlm.nih.gov/36625590), licensed under a CC-BY license. Not internally tested by R&D Systems.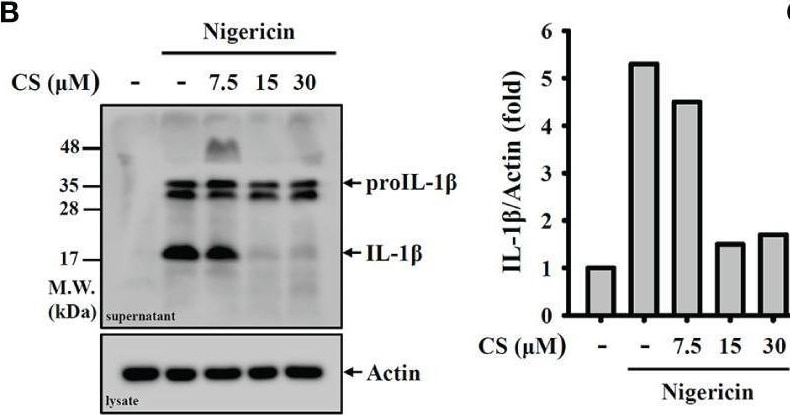
Detection of Mouse IL-1 beta /IL-1F2 by Western Blot
CS inhibits NLRP3 inflammasome activation. (A–D) J774A.1 macrophages were primed with LPS for 5 h and incubated with CS for 0.5 h Cells were stimulated with 10 μM nigericin for 0.5 h The levels of IL-1 beta in the supernatants were measured by ELISA (A) and Western blot (B). The levels of IL-18 (C) and caspase-1 (D) in the supernatants were measured by Western blot. (E, F) Human THP-1 macrophages or PBMC were primed with LPS for 5 h and incubated with CS for 0.5 h Cells were stimulated with 10 μM nigericin for 0.5 h The levels of IL-1 beta in the supernatants were measured by ELISA. (G, H) J774A.1 macrophages were primed with LPS for 5 h and incubated with CS for 0.5 h Cells were stimulated with 5 mM ATP for 0.5 h The levels of IL-1 beta in the supernatants were measured by ELISA (G) and the levels of caspase-1 in the supernatants were measured by Western blot (H). (I) J774A.1 macrophages were primed with LPS or Pam3CSK4 (for non-canonical inflammasome) for 5 h and incubated with CS for 0.5 h Cells were transfected with poly(dA/dT), LPS, MDP or FLA-ST for 6 h or infected with Salmonella for 2 h The levels of IL-1 beta in the supernatants were measured by ELISA. (J) J774A.1 macrophages were primed with LPS for 5 h and incubated with Irbesartan (IS) for 0.5 h Cells were stimulated with 10 μM nigericin for 0.5 h The levels of IL-1 beta in the supernatants were measured by ELISA. The ELISA data are expressed as the means ± SD of the three separate experiments. The Western blot images are representative results, and the histogram shows the band intensity. *, ** and *** indicate a significant difference at the level of p<0.05, p<0.01 and p<0.001, respectively, compared to nigericin- or ATP-activated cells or as indicated. Image collected and cropped by CiteAb from the following open publication (https://pubmed.ncbi.nlm.nih.gov/35669789), licensed under a CC-BY license. Not internally tested by R&D Systems.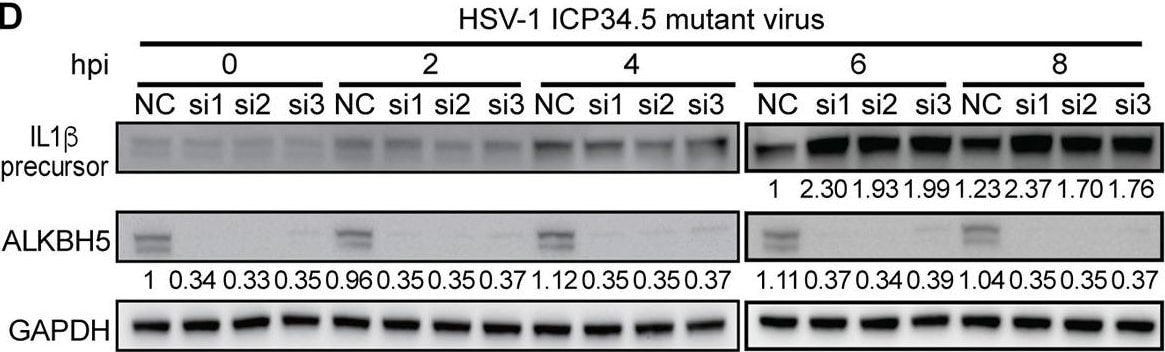
Detection of IL-1 beta /IL-1F2 by Western Blot
ALKBH5 regulates the expression of innate immune response genes during bacterial and viral infections in RAW264.7 cells. (A) ALKBH5 knockdown enhanced the expression levels of the IL-1 beta, CSF3, TGM2, and SRC transcripts during P. aeruginosa, C. diphtheriae, HSV-1, or HSV-1 ICP34.5 mutant infection. (B to D) ALKBH5 knockdown enhanced the protein level of IL-1 beta during infection by C. diphtheriae (B), P. aeruginosa (C), or the HSV-1 ICP34.5 mutant (D). (E) ALKBH5 overexpression inhibited the expression of the IL-1 beta, CSF3, TGM2, and SRC genes during P. aeruginosa infection as measured by RT-qPCR. (F) ALKBH5 overexpression inhibited the protein level of IL-1 beta during P. aeruginosa infection as measured by Western blotting. Image collected and cropped by CiteAb from the following open publication (https://pubmed.ncbi.nlm.nih.gov/36625590), licensed under a CC-BY license. Not internally tested by R&D Systems.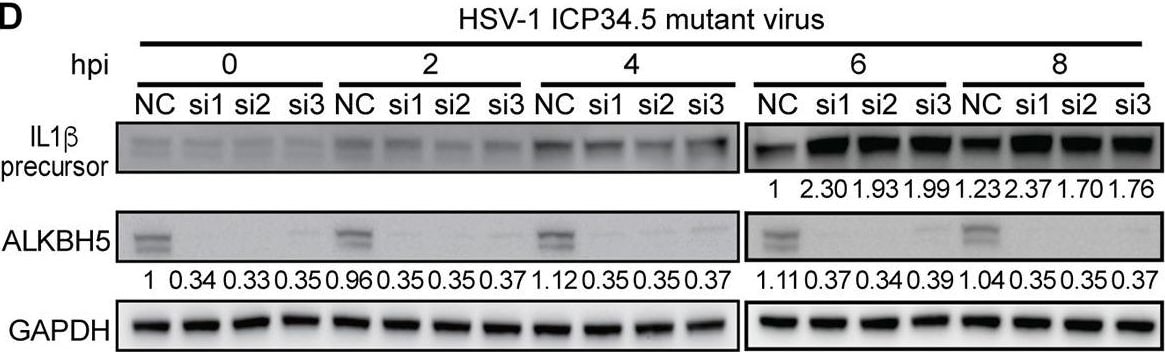
Detection of IL-1 beta /IL-1F2 by Western Blot
ALKBH5 regulates the expression of innate immune response genes during bacterial and viral infections in RAW264.7 cells. (A) ALKBH5 knockdown enhanced the expression levels of the IL-1 beta, CSF3, TGM2, and SRC transcripts during P. aeruginosa, C. diphtheriae, HSV-1, or HSV-1 ICP34.5 mutant infection. (B to D) ALKBH5 knockdown enhanced the protein level of IL-1 beta during infection by C. diphtheriae (B), P. aeruginosa (C), or the HSV-1 ICP34.5 mutant (D). (E) ALKBH5 overexpression inhibited the expression of the IL-1 beta, CSF3, TGM2, and SRC genes during P. aeruginosa infection as measured by RT-qPCR. (F) ALKBH5 overexpression inhibited the protein level of IL-1 beta during P. aeruginosa infection as measured by Western blotting. Image collected and cropped by CiteAb from the following open publication (https://pubmed.ncbi.nlm.nih.gov/36625590), licensed under a CC-BY license. Not internally tested by R&D Systems.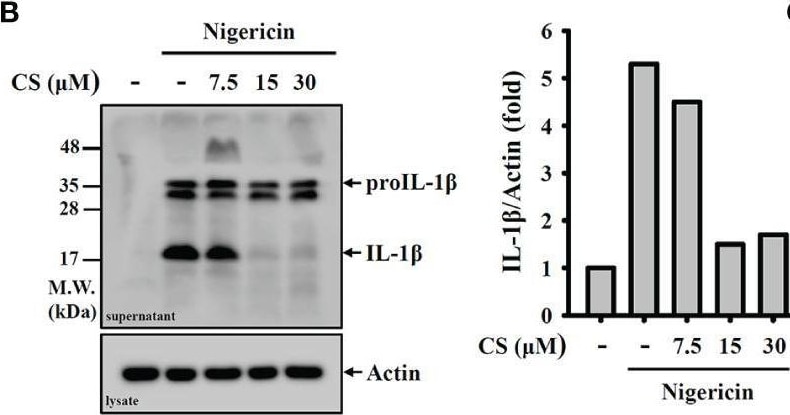
Detection of Mouse IL-1 beta /IL-1F2 by Western Blot
CS inhibits NLRP3 inflammasome activation. (A–D) J774A.1 macrophages were primed with LPS for 5 h and incubated with CS for 0.5 h Cells were stimulated with 10 μM nigericin for 0.5 h The levels of IL-1 beta in the supernatants were measured by ELISA (A) and Western blot (B). The levels of IL-18 (C) and caspase-1 (D) in the supernatants were measured by Western blot. (E, F) Human THP-1 macrophages or PBMC were primed with LPS for 5 h and incubated with CS for 0.5 h Cells were stimulated with 10 μM nigericin for 0.5 h The levels of IL-1 beta in the supernatants were measured by ELISA. (G, H) J774A.1 macrophages were primed with LPS for 5 h and incubated with CS for 0.5 h Cells were stimulated with 5 mM ATP for 0.5 h The levels of IL-1 beta in the supernatants were measured by ELISA (G) and the levels of caspase-1 in the supernatants were measured by Western blot (H). (I) J774A.1 macrophages were primed with LPS or Pam3CSK4 (for non-canonical inflammasome) for 5 h and incubated with CS for 0.5 h Cells were transfected with poly(dA/dT), LPS, MDP or FLA-ST for 6 h or infected with Salmonella for 2 h The levels of IL-1 beta in the supernatants were measured by ELISA. (J) J774A.1 macrophages were primed with LPS for 5 h and incubated with Irbesartan (IS) for 0.5 h Cells were stimulated with 10 μM nigericin for 0.5 h The levels of IL-1 beta in the supernatants were measured by ELISA. The ELISA data are expressed as the means ± SD of the three separate experiments. The Western blot images are representative results, and the histogram shows the band intensity. *, ** and *** indicate a significant difference at the level of p<0.05, p<0.01 and p<0.001, respectively, compared to nigericin- or ATP-activated cells or as indicated. Image collected and cropped by CiteAb from the following open publication (https://pubmed.ncbi.nlm.nih.gov/35669789), licensed under a CC-BY license. Not internally tested by R&D Systems.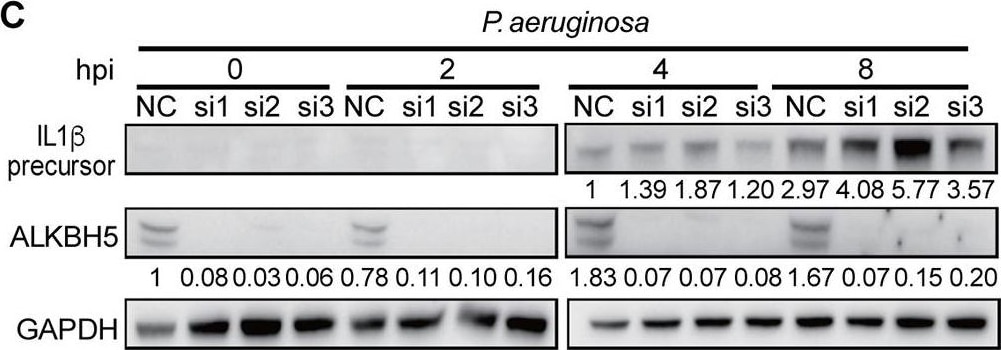
Detection of IL-1 beta /IL-1F2 by Western Blot
ALKBH5 regulates the expression of innate immune response genes during bacterial and viral infections in RAW264.7 cells. (A) ALKBH5 knockdown enhanced the expression levels of the IL-1 beta, CSF3, TGM2, and SRC transcripts during P. aeruginosa, C. diphtheriae, HSV-1, or HSV-1 ICP34.5 mutant infection. (B to D) ALKBH5 knockdown enhanced the protein level of IL-1 beta during infection by C. diphtheriae (B), P. aeruginosa (C), or the HSV-1 ICP34.5 mutant (D). (E) ALKBH5 overexpression inhibited the expression of the IL-1 beta, CSF3, TGM2, and SRC genes during P. aeruginosa infection as measured by RT-qPCR. (F) ALKBH5 overexpression inhibited the protein level of IL-1 beta during P. aeruginosa infection as measured by Western blotting. Image collected and cropped by CiteAb from the following open publication (https://pubmed.ncbi.nlm.nih.gov/36625590), licensed under a CC-BY license. Not internally tested by R&D Systems.Applications for Mouse IL-1 beta/IL-1F2 Antibody
Simple Western
Sample: RAW 264.7 mouse monocyte/macrophage cell line treated with LPS
Western Blot
Sample: THP‑1 human acute monocytic leukemia cell line treated with PMA and LPS and RAW 264.7 mouse monocyte/macrophage cell line treated with LPS
Neutralization
Formulation, Preparation, and Storage
Purification
Reconstitution
Reconstitute at 1 mg/mL in sterile PBS.
Formulation
Shipping
Stability & Storage
- 12 months from date of receipt, -20 to -70 °C as supplied.
- 1 month, 2 to 8 °C under sterile conditions after reconstitution.
- 6 months, -20 to -70 °C under sterile conditions after reconstitution.
Calculators
Background: IL-1 beta/IL-1F2
Long Name
Alternate Names
Entrez Gene IDs
Gene Symbol
UniProt
Additional IL-1 beta/IL-1F2 Products
Product Documents for Mouse IL-1 beta/IL-1F2 Antibody
Certificate of Analysis
To download a Certificate of Analysis, please enter a lot or batch number in the search box below.
Note: Certificate of Analysis not available for kit components.
Product Specific Notices for Mouse IL-1 beta/IL-1F2 Antibody
For research use only
Related Research Areas
Citations for Mouse IL-1 beta/IL-1F2 Antibody
 Powered by Bioz
Customer Reviews for Mouse IL-1 beta/IL-1F2 Antibody
There are currently no reviews for this product. Be the first to review Mouse IL-1 beta/IL-1F2 Antibody and earn rewards!
Have you used Mouse IL-1 beta/IL-1F2 Antibody?
Submit a review and receive an Amazon gift card!
$25/€18/£15/$25CAN/¥2500 for a review with an image
$10/€7/£6/$10CAN/¥1110 for a review without an image
Submit a review
Protocols
Find general support by application which include: protocols, troubleshooting, illustrated assays, videos and webinars.
- Cellular Response to Hypoxia Protocols
- R&D Systems Quality Control Western Blot Protocol
- Troubleshooting Guide: Western Blot Figures
- Western Blot Conditions
- Western Blot Protocol
- Western Blot Protocol for Cell Lysates
- Western Blot Troubleshooting
- Western Blot Troubleshooting Guide
- View all Protocols, Troubleshooting, Illustrated assays and Webinars
Associated Pathways