
SPARCL1 (Secreted Protein, Acidic and Rich in Cysteines-like 1), also known as hevin, SC1 or MAST9, is a member of the SPARC family of extracellular glycoproteins (1, 2). SPARCL1 is an anti-adhesive protein that is widely expressed in tissues such as brain, heart, lung, muscle and kidney, but not liver (3, 4). Mouse SPARCL1 contains a 16 amino acid (aa) signal sequence and a 634 aa mature region that contains four domains: a 403 aa N-terminal acidic region, a 23 aa follistatin-like domain, a 55 aa kazal-like segment and a 148 aa calcium binding domain that contains two EF hand motifs (3, 4). Mouse mature SPARCL1 shares 89%, 67%, 63%, 61%, 60%, and 58% aa identity with rat, human, equine, canine, porcine, and bovine SPARCL1, respectively. The follistatin-like, kazal-like and calcium-binding domains of SPARCL1 show 61% aa identity with corresponding regions of SPARC. SPARCL1 is predicted at 75 kDa, but migrates at ~130 kDa, which has been explained either by disulfide-linked homodimerization or by glycosylation and high acidity (3 - 5). Some truncated forms have been reported. In mouse, a 55 kDa C‑terminal fragment is the only form in kidney and represent a portion of SPARCL1 in other tissues (6). In humans, a 25 kDa form is increased in liver tumors that are encapsulated, while the full-length form is downregulated in many epithelial cell-derived tumors (7, 8). SPARCL1 inhibits adhesion and spreading on a variety of substrates (5, 9). It is thought to cause antiadhesive signaling that terminates neuronal migration, consistent with production by glial and neuronal cells during development or in response to trauma (10). In tonsillar high endothelial venules (HEV), SPARCL1 may induce endothelial cell dissociation, promoting extravasation (3). SPARCL1 binds collagen; in mice, deletion causes dermal collagen fibrils that are smaller in diameter and deficient in decorin (6, 11).
Mouse SPARC-like 1/SPARCL1 Antibody
R&D Systems | Catalog # AF2836

Scientific images may be resized, cropped, or adjusted for brightness or contrast for presentation purposes. These updates are limited to presentation and do not affect the underlying scientific interpretation of the data. Where available, additional source data may be provided upon request.
Key Product Details
Species Reactivity
Validated:
Cited:
Applications
Validated:
Cited:
Label
Antibody Source
Product Specifications
Immunogen
Ile17-Phe650
Accession # P70663
Specificity
Clonality
Host
Isotype
Scientific Data Images for Mouse SPARC-like 1/SPARCL1 Antibody
Detection of Mouse SPARC-like 1/SPARCL1 by Immunocytochemistry/Immunofluorescence
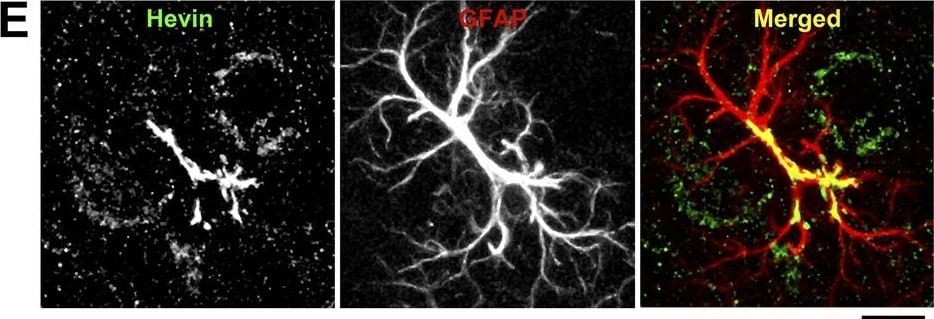
Hevin expression by astrocytes is developmentally regulated in the cortex.(A) Representative Western blots showing the developmental timeline for hevin expression in mouse cortex and hippocampus (tubulin was used as a loading control). (B) Quantification of Western blot analysis of hevin expression shows high expression between P15–P25. Data is presented as fold change compared to P1 levels (n = 3 animals per age; p < 0.05; one-way ANOVA with Dunnett's post hoc test). (C) Schematic diagram of a coronal slice through mouse brain shows the synaptic zone of primary visual cortex (V1) where EM, IHC and Golgi-cox staining analyses were performed. Layer II/III neurons of the visual cortex heavily project their dendrites to this region (D) IHC staining reveals that hevin expression (green) overlaps with all astrocytes (left, arrow) and a small subset of neurons (middle, asterisk) in V1, with no overlap seen with microglia (right, arrowhead). Cell-specific markers in red: Aldh1L1-EGFP for astrocytes, NeuN for neurons, Iba1 for microglia. Scale bar, 50 µm. (E) The rarely occurring GFAP+ astrocytes (red) in healthy visual cortex also express hevin (green). Scale bar, 10 µm.DOI:https://dx.doi.org/10.7554/eLife.04047.003 Image collected and cropped by CiteAb from the following publication (https://pubmed.ncbi.nlm.nih.gov/25517933), licensed under a CC-BY license. Not internally tested by R&D Systems.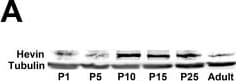
Detection of Mouse SPARC-like 1/SPARCL1 by Western Blot
Hevin expression by astrocytes is developmentally regulated in the cortex.(A) Representative Western blots showing the developmental timeline for hevin expression in mouse cortex and hippocampus (tubulin was used as a loading control). (B) Quantification of Western blot analysis of hevin expression shows high expression between P15–P25. Data is presented as fold change compared to P1 levels (n = 3 animals per age; p < 0.05; one-way ANOVA with Dunnett's post hoc test). (C) Schematic diagram of a coronal slice through mouse brain shows the synaptic zone of primary visual cortex (V1) where EM, IHC and Golgi-cox staining analyses were performed. Layer II/III neurons of the visual cortex heavily project their dendrites to this region (D) IHC staining reveals that hevin expression (green) overlaps with all astrocytes (left, arrow) and a small subset of neurons (middle, asterisk) in V1, with no overlap seen with microglia (right, arrowhead). Cell-specific markers in red: Aldh1L1-EGFP for astrocytes, NeuN for neurons, Iba1 for microglia. Scale bar, 50 µm. (E) The rarely occurring GFAP+ astrocytes (red) in healthy visual cortex also express hevin (green). Scale bar, 10 µm.DOI:https://dx.doi.org/10.7554/eLife.04047.003 Image collected and cropped by CiteAb from the following publication (https://pubmed.ncbi.nlm.nih.gov/25517933), licensed under a CC-BY license. Not internally tested by R&D Systems.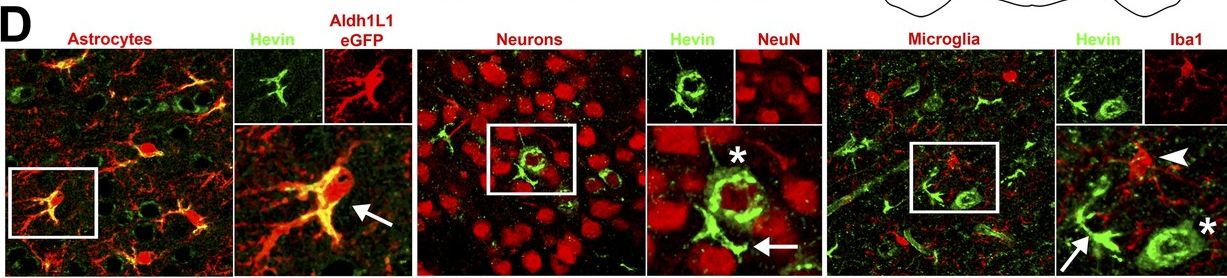
Detection of Mouse SPARC-like 1/SPARCL1 by Immunocytochemistry/Immunofluorescence
Hevin expression by astrocytes is developmentally regulated in the cortex.(A) Representative Western blots showing the developmental timeline for hevin expression in mouse cortex and hippocampus (tubulin was used as a loading control). (B) Quantification of Western blot analysis of hevin expression shows high expression between P15–P25. Data is presented as fold change compared to P1 levels (n = 3 animals per age; p < 0.05; one-way ANOVA with Dunnett's post hoc test). (C) Schematic diagram of a coronal slice through mouse brain shows the synaptic zone of primary visual cortex (V1) where EM, IHC and Golgi-cox staining analyses were performed. Layer II/III neurons of the visual cortex heavily project their dendrites to this region (D) IHC staining reveals that hevin expression (green) overlaps with all astrocytes (left, arrow) and a small subset of neurons (middle, asterisk) in V1, with no overlap seen with microglia (right, arrowhead). Cell-specific markers in red: Aldh1L1-EGFP for astrocytes, NeuN for neurons, Iba1 for microglia. Scale bar, 50 µm. (E) The rarely occurring GFAP+ astrocytes (red) in healthy visual cortex also express hevin (green). Scale bar, 10 µm.DOI:https://dx.doi.org/10.7554/eLife.04047.003 Image collected and cropped by CiteAb from the following publication (https://pubmed.ncbi.nlm.nih.gov/25517933), licensed under a CC-BY license. Not internally tested by R&D Systems.Applications for Mouse SPARC-like 1/SPARCL1 Antibody
Western Blot
Sample: Recombinant Mouse SPARC-like 1/SPARCL1 (Catalog # 4547-SL)
Reviewed Applications
Read 1 review rated 5 using AF2836 in the following applications:
Formulation, Preparation, and Storage
Purification
Reconstitution
Reconstitute at 0.2 mg/mL in sterile PBS. For liquid material, refer to CoA for concentration.
Formulation
Shipping
Stability & Storage
- 12 months from date of receipt, -20 to -70 °C as supplied.
- 1 month, 2 to 8 °C under sterile conditions after reconstitution.
- 6 months, -20 to -70 °C under sterile conditions after reconstitution.
Calculators
Background: SPARC-like 1/SPARCL1
References
- Framson, P.E. and E.H. Sage (2004) J. Cell. Biochem. 92:679.
- Sullivan, M.M. and E.H. Sage (2004) Int. J. Biochem. Cell Biol. 36:991.
- Girard, J.P. and T.A. Springer (1995) Immunity 2:113.
- Bendik, I. et al. (1998) Cancer Res. 58:626.
- Brekken, R.A. et al. (2004) J. Histochem. Cytochem. 52:735.
- Hambrock, H.O. et al. (2003) J. Biol. Chem. 278:11351.
- Lau, C.P. et al. (2006) J. Pathol. 210:469.
- Isler, S.G. et al. (2001) Int. J. Oncol. 18:521.
- Girard, J.P. and T.A. Springer (1996) J. Biol. Chem. 271:4511.
- Gongidi, V. et al. (2004) Neuron 41:57.
- Sullivan, M.M. et al. (2006) J. Biol. Chem. 281:27621.
Alternate Names
Gene Symbol
UniProt
Additional SPARC-like 1/SPARCL1 Products
Product Documents for Mouse SPARC-like 1/SPARCL1 Antibody
Certificate of Analysis
To download a Certificate of Analysis, please enter a lot or batch number in the search box below.
Note: Certificate of Analysis not available for kit components.
Product Specific Notices for Mouse SPARC-like 1/SPARCL1 Antibody
For research use only
Related Research Areas
Citations for Mouse SPARC-like 1/SPARCL1 Antibody
 Powered by Bioz
Customer Reviews for Mouse SPARC-like 1/SPARCL1 Antibody (1)
Have you used Mouse SPARC-like 1/SPARCL1 Antibody?
Submit a review and receive an Amazon gift card!
$25/€18/£15/$25CAN/¥2500 for a review with an image
$10/€7/£6/$10CAN/¥1110 for a review without an image
Submit a review
Customer Images
-
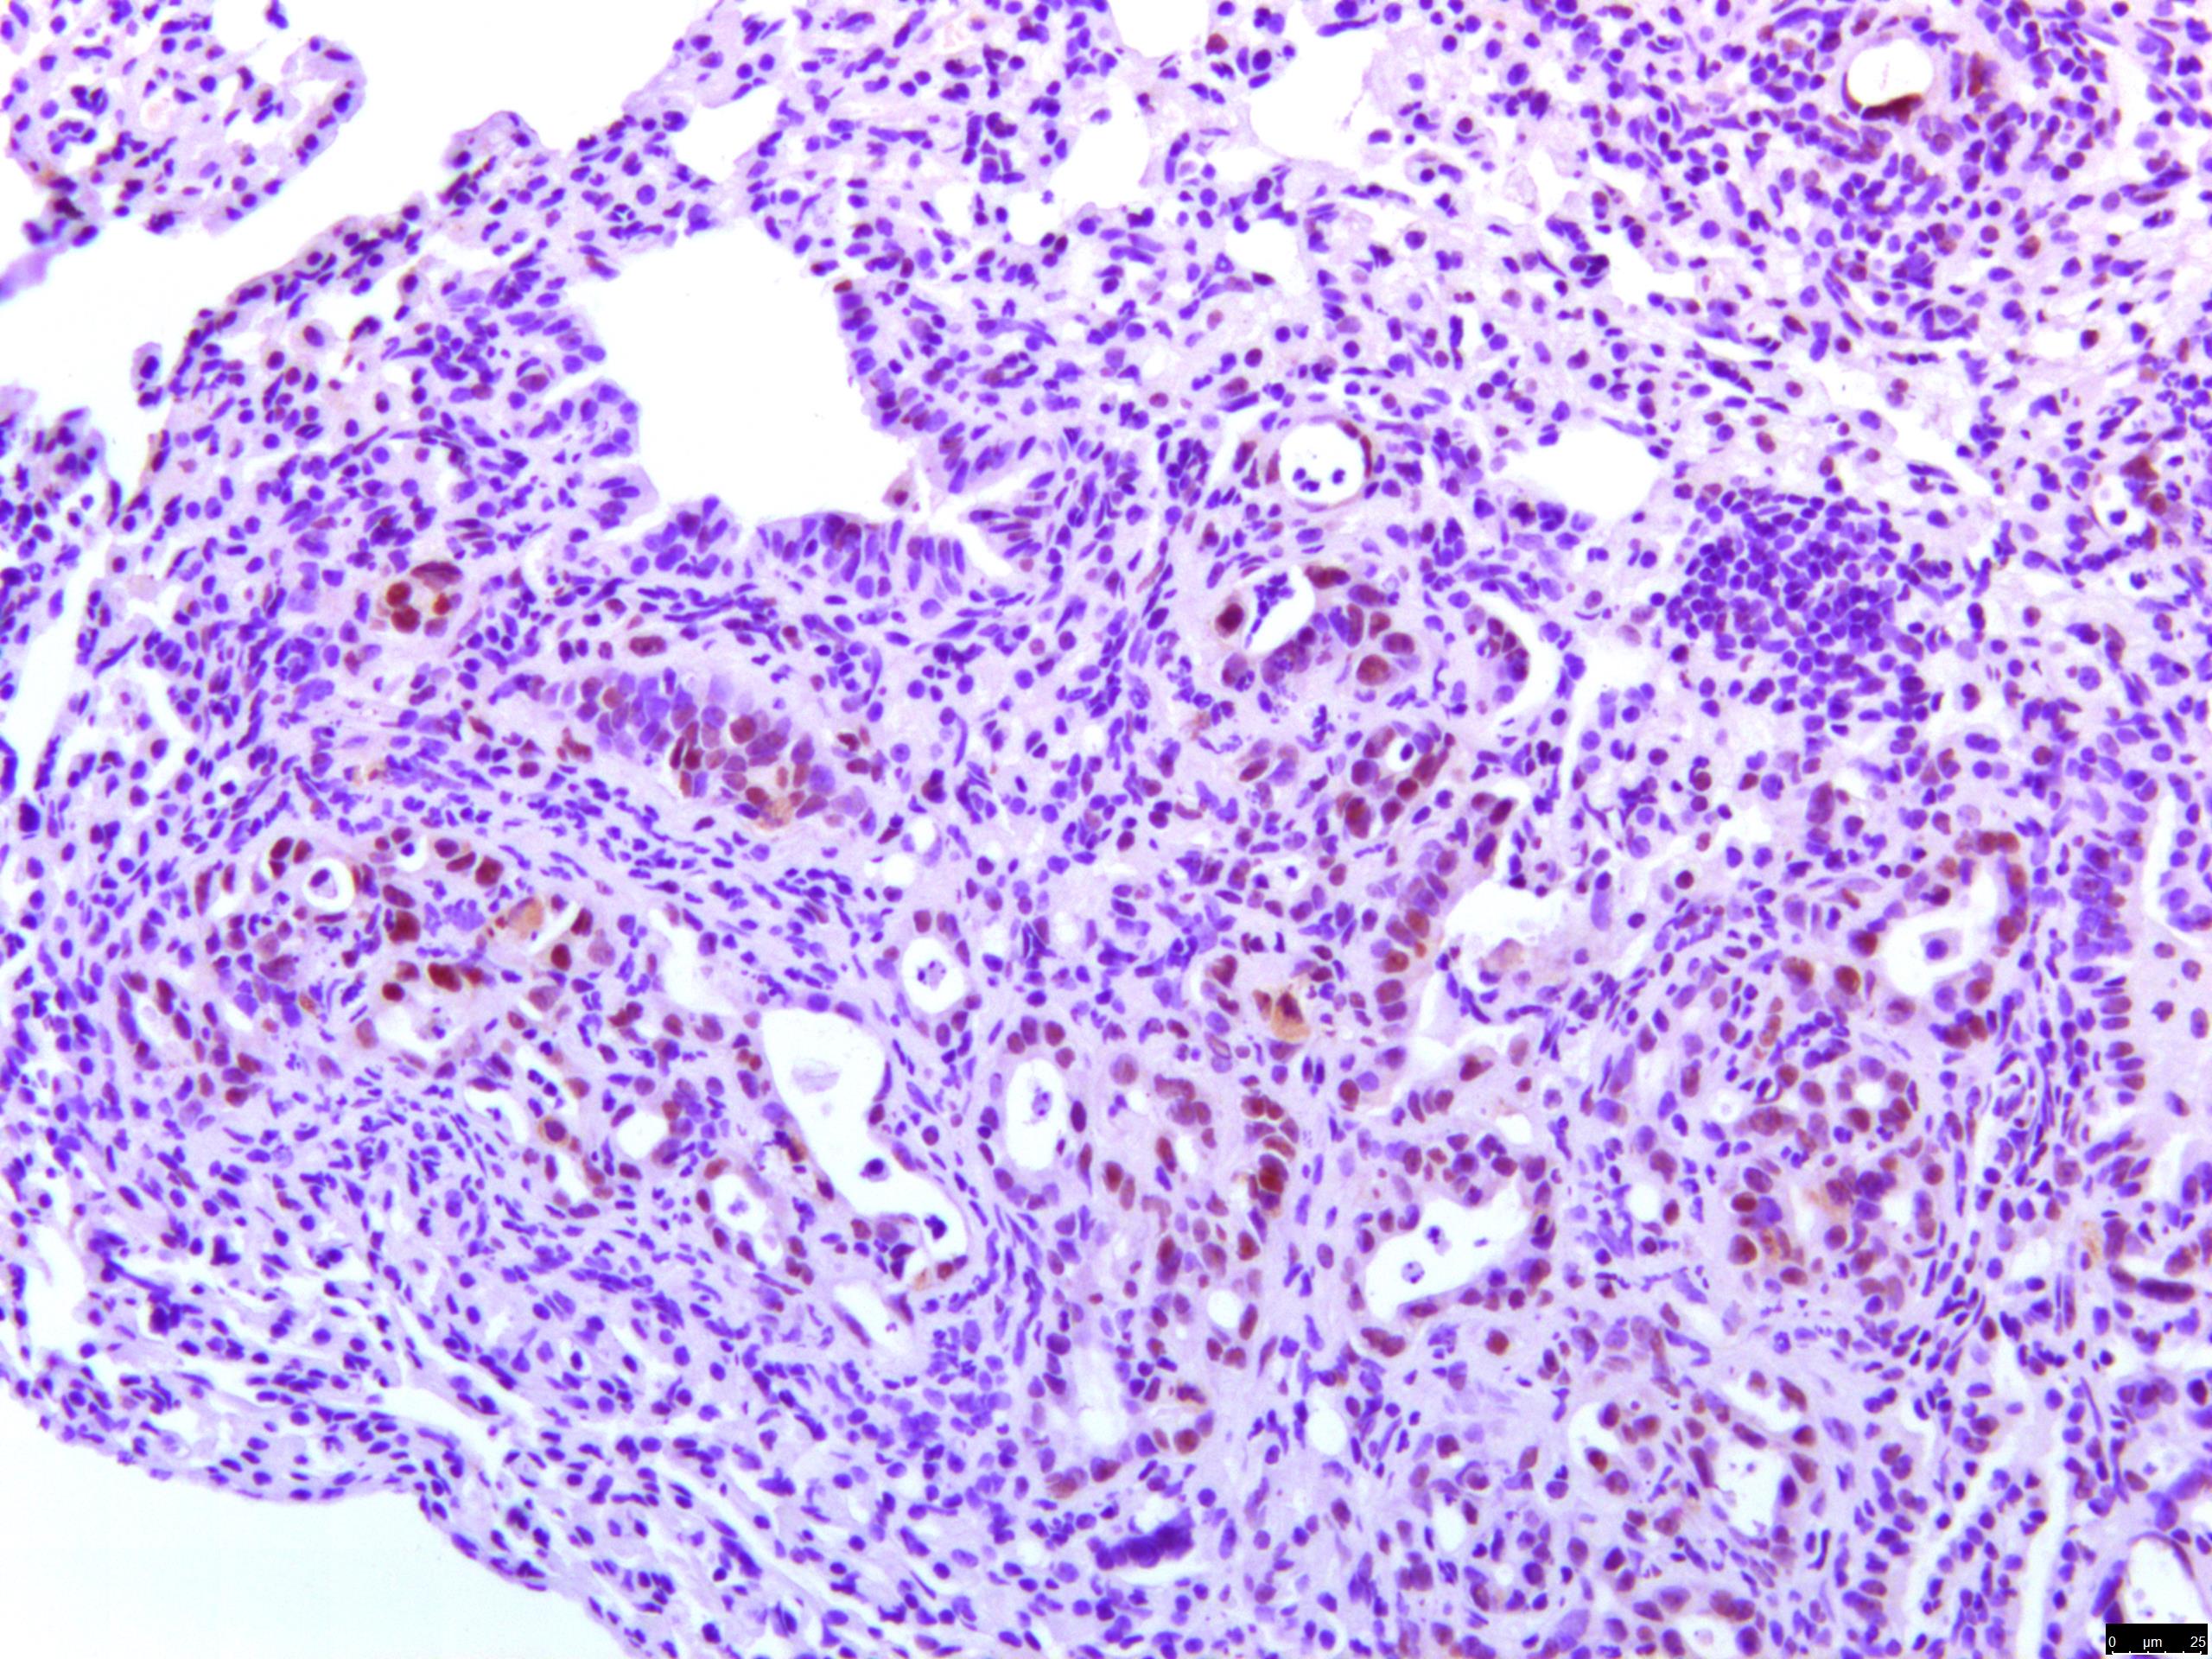
Application: ImmunohistochemistrySample Tested: Lung tissueSpecies: MouseVerified Customer | Posted 12/10/2023

There are no reviews that match your criteria.
Protocols
Find general support by application which include: protocols, troubleshooting, illustrated assays, videos and webinars.
- Cellular Response to Hypoxia Protocols
- R&D Systems Quality Control Western Blot Protocol
- Troubleshooting Guide: Western Blot Figures
- Western Blot Conditions
- Western Blot Protocol
- Western Blot Protocol for Cell Lysates
- Western Blot Troubleshooting
- Western Blot Troubleshooting Guide
- View all Protocols, Troubleshooting, Illustrated assays and Webinars