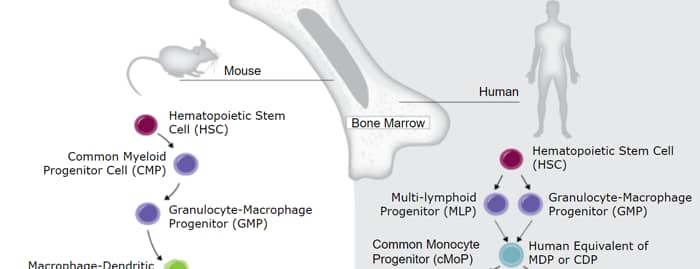
Spi-B (Transcription factor Spi-B) is a 33-45 kDa member of the ets family of transcription factors. It is found in hematopoietic cells such as B cells and plasmacytoid dendritic cells (DC). In transitional B cells, Spi-B promotes their differentiation into follicular (naïve) B cells. In hematopoietic stem cells, Spi-B stimulates the generation of IFN-producing plasmacytoid DC at the expense of T, B and NK cell development. Mouse Spi-B is 267 amino acids (aa) in length. It contains a dual transactivation region (aa 1-62), plus a PEST domain (aa 110-170) and an Ets DNA-binding domain (aa 174-257). There are two isoform variants. One shows a nine aa substitution for aa 1-8, while a second possesses an 18 aa insertion after Leu17. Over aa 18-167, mouse Spi-B shares 91% and 74% aa identity with rat and human Spi-B, respectively.
Mouse Spi-B Antibody
R&D Systems | Catalog # AF7204

Scientific images may be resized, cropped, or adjusted for brightness or contrast for presentation purposes. These updates are limited to presentation and do not affect the underlying scientific interpretation of the data. Where available, additional source data may be provided upon request.
Key Product Details
Validated by
Species Reactivity
Validated:
Cited:
Applications
Validated:
Cited:
Label
Antibody Source
Product Specifications
Immunogen
Tyr18-Glu167 (Tyr110Phe)
Accession # O35906
Specificity
Clonality
Host
Isotype
Scientific Data Images for Mouse Spi-B Antibody
Spi-B in Mouse Splenocytes.
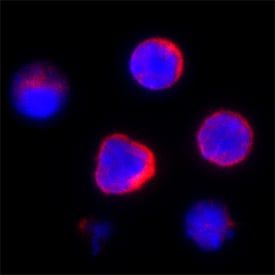
Spi-B was detected in immersion fixed mouse splenocytes using Sheep Anti-Mouse Spi-B Antigen Affinity-purified Polyclonal Antibody (Catalog # AF7204) at 15 µg/mL for 3 hours at room temperature. Cells were stained using the NorthernLights™ 557-conjugated Anti-Sheep IgG Secondary Antibody (red; Catalog # NL010) and counterstained with DAPI (blue). Specific staining was localized to plasma membranes and cytoplasm. View our protocol for Fluorescent ICC Staining of Non-adherent Cells.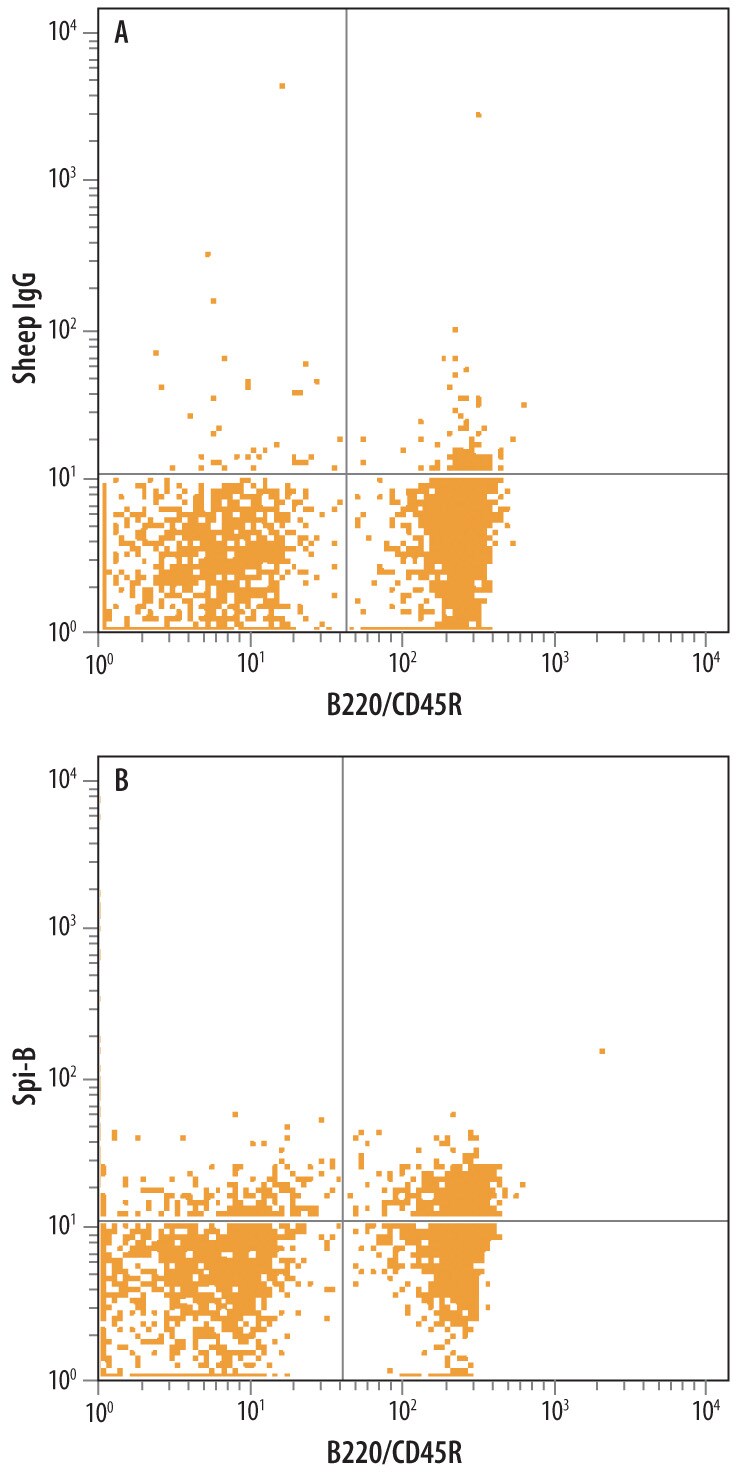
Detection of SPi-B in Mouse Splenocytes by Flow Cytometry.
Mouse splenocytes were stained with Sheep Anti-Mouse Spi-B Antigen Affinity-purified Polyclonal Antibody (Catalog # AF7204) followed by Allophycocyanin-conjugated Anti-Sheep IgG Secondary Antibody (Catalog # F0127) and Rat Anti-Mouse B220/CD45R PE-conjugated Monoclonal Antibody (Catalog # FAB1217P). Quadrant markers were set based on control antibody staining (Catalog # 5-001-A). To facilitate intracellular staining, cells were fixed with paraformadehyde and permeabilized with saponin.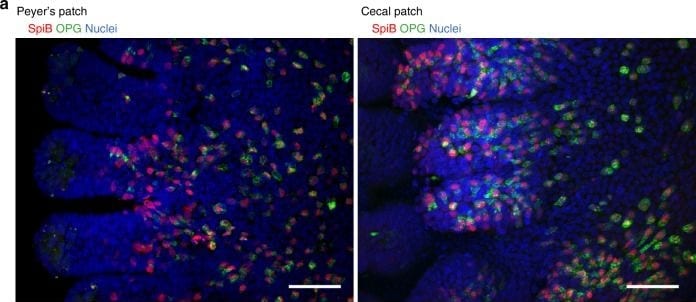
Detection of Mouse Spi-B by Immunocytochemistry/Immunofluorescence
OPGhigh M cells cluster more in cecal patches than in Peyer’s patches.a Whole-mount immunostaining of the FAE of Peyer’s patches (left) and cecal patches (right) for OPG (green) and Spi-B (red). Nuclei were stained with DAPI (blue); scale bars: 50 µm. b Scatter plots of the fluorescence intensities of OPG versus Spi-B. Red dots represent cells stained with anti-Spi-B antibody that was conjugated with HyLyte Fluor 555 and anti-OPG antibody that was conjugated with HyLyte Fluor 647. Blue dots represent background fluorescence intensity of randomly selected non-stained cells. Fluorescence intensities were measured for at least 3000 cells from five FAEs of three mice. c Frequencies of OPGhigh M cells in Peyer’s patches and cecal patches were quantified. *p < 0.05, ***p < 0.005. Student’s t-test, n = 5 FAE from three animals. The source data underlying panels b and c are provided as a Source Data file. Image collected and cropped by CiteAb from the following publication (https://pubmed.ncbi.nlm.nih.gov/31932605), licensed under a CC-BY license. Not internally tested by R&D Systems.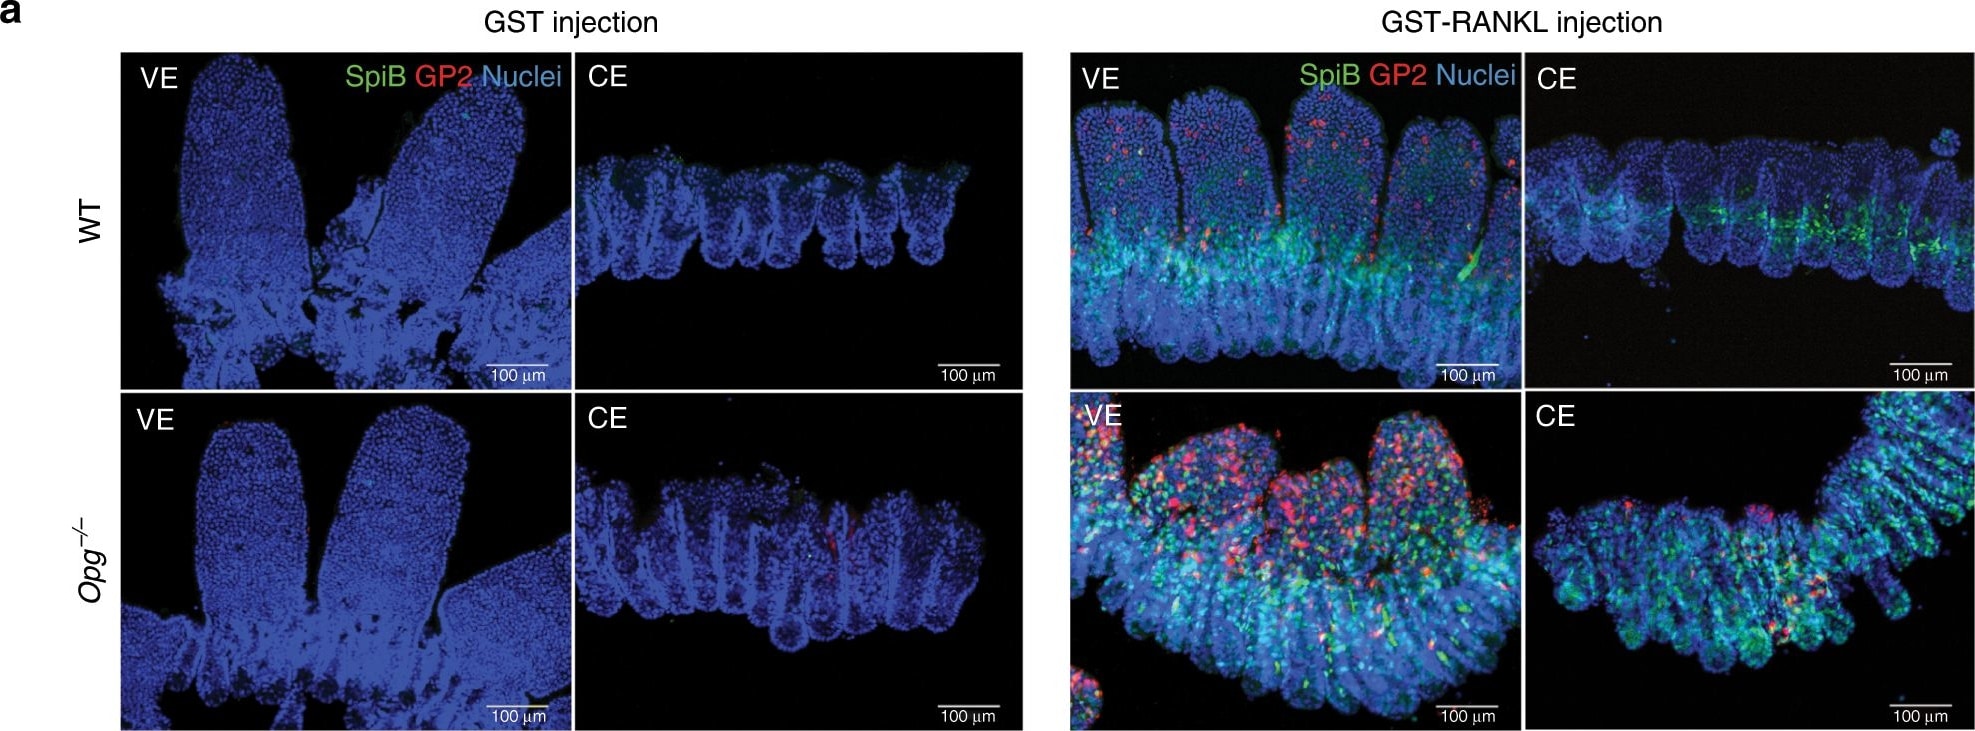
Detection of Mouse Spi-B by Immunocytochemistry/Immunofluorescence
RANKL–RANK signaling is stimulated in the gut epithelia of Opg−/− mice.a GP2+ cells (red) are more effectively induced in the cecal epithelium (CE) and ileal villi (VE) of Opg−/− mice by RANKL administration. Whole-mount immunohistochemical images of Spi-B (green) and GP2 (red) in the VE and CE of WT (upper panels) and Opg−/− mice (lower panels) treated with either GST (control; left) or GST-RANKL (right). Scale bars: 100 µm. Representative images from three independent experiment are shown. b Quantitative PCR analysis of M-cell marker expression in conventional epithelia from the VE and CE of mice injected with GST (control) or GST-RANKL. Results were normalized to Gapdh expression and are presented relative to the expression in the ileal epithelium from GST-treated mice. Data shown are mean values from three independent experiments (error bars indicate standard deviation). ***p < 0.005, **p < 0.01, *p < 0.05; p values were calculated with the Student’s t-test (n = 3 biologically independent experiments). c, d Nuclear translocation activities of RelB and p52 following RANKL stimulation are enhanced in Opg−/− mice. c Western blot analysis of p100/p52 and RelB in the VE and CE of mice injected with GST or GST-RANKL. Rpt4, a subunit of the 26S proteasome, was used as an internal control for the cytoplasmic fraction. Lamin A/C (Lamin) was used as an internal control for the nuclear fraction. Data are representative of two independent experiments. d Right, single confocal planes of the cecal FAE from WT and Opg−/− mice. FAE monolayers were stained with anti-RelB (green) and anti-Spi-B (red) antibodies and with Hoechst 33342. Left, a bar graph summarizing the proportions of RelB-positive cells among total numbers of M cells (Spi-B-positive cells). ***p < 0.005; p values were calculated with the Student’s t-test (n = 4 biologically independent experiments). Scale bars: 20 µm. The source data underlying panels b and d and non-cropped scan images of western blotting (c) are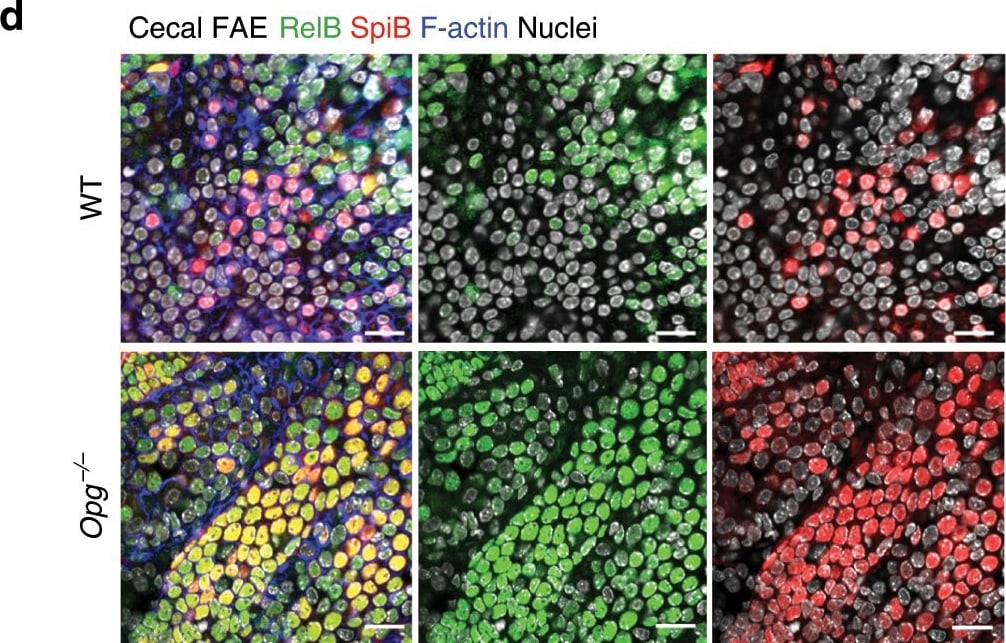
Detection of Mouse Spi-B by Immunocytochemistry/Immunofluorescence
RANKL–RANK signaling is stimulated in the gut epithelia of Opg−/− mice.a GP2+ cells (red) are more effectively induced in the cecal epithelium (CE) and ileal villi (VE) of Opg−/− mice by RANKL administration. Whole-mount immunohistochemical images of Spi-B (green) and GP2 (red) in the VE and CE of WT (upper panels) and Opg−/− mice (lower panels) treated with either GST (control; left) or GST-RANKL (right). Scale bars: 100 µm. Representative images from three independent experiment are shown. b Quantitative PCR analysis of M-cell marker expression in conventional epithelia from the VE and CE of mice injected with GST (control) or GST-RANKL. Results were normalized to Gapdh expression and are presented relative to the expression in the ileal epithelium from GST-treated mice. Data shown are mean values from three independent experiments (error bars indicate standard deviation). ***p < 0.005, **p < 0.01, *p < 0.05; p values were calculated with the Student’s t-test (n = 3 biologically independent experiments). c, d Nuclear translocation activities of RelB and p52 following RANKL stimulation are enhanced in Opg−/− mice. c Western blot analysis of p100/p52 and RelB in the VE and CE of mice injected with GST or GST-RANKL. Rpt4, a subunit of the 26S proteasome, was used as an internal control for the cytoplasmic fraction. Lamin A/C (Lamin) was used as an internal control for the nuclear fraction. Data are representative of two independent experiments. d Right, single confocal planes of the cecal FAE from WT and Opg−/− mice. FAE monolayers were stained with anti-RelB (green) and anti-Spi-B (red) antibodies and with Hoechst 33342. Left, a bar graph summarizing the proportions of RelB-positive cells among total numbers of M cells (Spi-B-positive cells). ***p < 0.005; p values were calculated with the Student’s t-test (n = 4 biologically independent experiments). Scale bars: 20 µm. The source data underlying panels b and d and non-cropped scan images of western blotting (c) areApplications for Mouse Spi-B Antibody
CyTOF-ready
Immunocytochemistry
Sample: Immersion fixed mouse splenocytes
Intracellular Staining by Flow Cytometry
Sample: Mouse splenocytes fixed with paraformadehyde and permeabilized with saponin
Flow Cytometry Panel Builder
Bio-Techne Knows Flow Cytometry
Save time and reduce costly mistakes by quickly finding compatible reagents using the Panel Builder Tool.
Advanced Features
- Spectra Viewer - Custom analysis of spectra from multiple fluorochromes
- Spillover Popups - Visualize the spectra of individual fluorochromes
- Antigen Density Selector - Match fluorochrome brightness with antigen density

Formulation, Preparation, and Storage
Purification
Reconstitution
Sterile PBS to a final concentration of 0.2 mg/mL. For liquid material, refer to CoA for concentration.
Formulation
Shipping
Stability & Storage
- 12 months from date of receipt, -20 to -70 °C as supplied.
- 1 month, 2 to 8 °C under sterile conditions after reconstitution.
- 6 months, -20 to -70 °C under sterile conditions after reconstitution.
Calculators
Background: Spi-B
Long Name
Alternate Names
Gene Symbol
UniProt
Additional Spi-B Products
Product Documents for Mouse Spi-B Antibody
Certificate of Analysis
To download a Certificate of Analysis, please enter a lot or batch number in the search box below.
Note: Certificate of Analysis not available for kit components.
Product Specific Notices for Mouse Spi-B Antibody
For research use only
Citations for Mouse Spi-B Antibody
 Powered by Bioz
Customer Reviews for Mouse Spi-B Antibody
There are currently no reviews for this product. Be the first to review Mouse Spi-B Antibody and earn rewards!
Have you used Mouse Spi-B Antibody?
Submit a review and receive an Amazon gift card!
$25/€18/£15/$25CAN/¥2500 for a review with an image
$10/€7/£6/$10CAN/¥1110 for a review without an image
Submit a review
Protocols
Find general support by application which include: protocols, troubleshooting, illustrated assays, videos and webinars.
- 7-Amino Actinomycin D (7-AAD) Cell Viability Flow Cytometry Protocol
- Appropriate Fixation of IHC/ICC Samples
- Cellular Response to Hypoxia Protocols
- ClariTSA™ Fluorophore Kits
- Detection & Visualization of Antibody Binding
- Extracellular Membrane Flow Cytometry Protocol
- Flow Cytometry Protocol for Cell Surface Markers
- Flow Cytometry Protocol for Staining Membrane Associated Proteins
- Flow Cytometry Staining Protocols
- Flow Cytometry Troubleshooting Guide
- ICC Cell Smear Protocol for Suspension Cells
- ICC Immunocytochemistry Protocol Videos
- ICC for Adherent Cells
- Immunocytochemistry (ICC) Protocol
- Immunocytochemistry Troubleshooting
- Immunofluorescence of Organoids Embedded in Cultrex Basement Membrane Extract
- Immunohistochemistry (IHC) and Immunocytochemistry (ICC) Protocols
- Intracellular Flow Cytometry Protocol Using Alcohol (Methanol)
- Intracellular Flow Cytometry Protocol Using Detergents
- Intracellular Nuclear Staining Flow Cytometry Protocol Using Detergents
- Intracellular Staining Flow Cytometry Protocol Using Alcohol Permeabilization
- Intracellular Staining Flow Cytometry Protocol Using Detergents to Permeabilize Cells
- Preparing Samples for IHC/ICC Experiments
- Preventing Non-Specific Staining (Non-Specific Binding)
- Primary Antibody Selection & Optimization
- Propidium Iodide Cell Viability Flow Cytometry Protocol
- Protocol for Liperfluo
- Protocol for VisUCyte™ HRP Polymer Detection Reagent
- Protocol for the Characterization of Human Th22 Cells
- Protocol for the Characterization of Human Th9 Cells
- Protocol for the Fluorescent ICC Staining of Cell Smears - Graphic
- Protocol for the Fluorescent ICC Staining of Cultured Cells on Coverslips - Graphic
- Protocol for the Preparation and Fluorescent ICC Staining of Cells on Coverslips
- Protocol for the Preparation and Fluorescent ICC Staining of Non-adherent Cells
- Protocol for the Preparation and Fluorescent ICC Staining of Stem Cells on Coverslips
- Protocol for the Preparation of a Cell Smear for Non-adherent Cell ICC - Graphic
- Protocol: Annexin V and PI Staining by Flow Cytometry
- Protocol: Annexin V and PI Staining for Apoptosis by Flow Cytometry
- TUNEL and Active Caspase-3 Detection by IHC/ICC Protocol
- The Importance of IHC/ICC Controls
- Troubleshooting Guide: Fluorokine Flow Cytometry Kits
- View all Protocols, Troubleshooting, Illustrated assays and Webinars
Associated Pathways