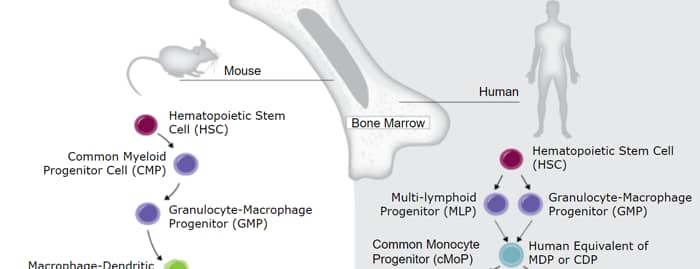
Flt-3 Ligand, also known as FL, is an alpha -helical cytokine that promotes the differentiation of multiple hematopoietic cell lineages (1‑3). Mature mouse Flt-3 Ligand consists of a 161 amino acid (aa) extracellular domain (ECD) with a cytokine-like domain and a juxtamembrane tether region, a 21 aa transmembrane segment, and a 22 aa cytoplasmic tail (4‑6). Within the ECD, mouse Flt-3 Ligand shares 71% and 81% aa sequence identity with human and rat Flt-3 Ligand, respectively. Mouse and human Flt-3 Ligand show cross-species activity (4, 5, 7). Flt-3 Ligand is expressed as a noncovalently-linked dimer by T cells and bone marrow and thymic fibroblasts (1, 8). Each 36 kDa chain carries approximately 12 kDa of N- and O-linked carbohydrates (8). Alternate splicing and proteolytic cleavage of the transmembrane form can generate a soluble 30 kDa fragment that includes the cytokine domain (4, 8). Alternate splicing of mouse Flt-3 Ligand also generates a membrane-associated isoform with a 57 aa substitution following the cytokine domain (4, 5, 8, 9). Both transmembrane and soluble Flt-3 Ligand signal through the tyrosine kinase receptor Flt-3/Flk-2 (3‑6). Flt-3 Ligand induces the expansion of monocytes and immature dendritic cells as well as early B cell lineage differentiation (2, 10). It synergizes with IL-3, GM-CSF, and SCF to promote the mobilization and myeloid differentiation of hematopoietic stem cells (4, 5, 7). It cooperates with IL-2, -6, -7, and -15 to induce NK cell development and with IL-3, -7, and -11 to induce terminal B cell maturation (1, 11). Animal studies also show Flt-3 Ligand to reduce the severity of experimentally induced allergic inflammation (12).
Mouse Flt-3 Ligand/FLT3L Antibody
R&D Systems | Catalog # AF427


Scientific images may be resized, cropped, or adjusted for brightness or contrast for presentation purposes. These updates are limited to presentation and do not affect the underlying scientific interpretation of the data. Where available, additional source data may be provided upon request.
Key Product Details
Validated by
Species Reactivity
Validated:
Cited:
Applications
Validated:
Cited:
Label
Antibody Source
Product Specifications
Immunogen
Gly27-Arg188
Accession # P49772
Specificity
Clonality
Host
Isotype
Endotoxin Level
Scientific Data Images for Mouse Flt-3 Ligand/FLT3L Antibody
Cell Proliferation Induced by Flt-3 Ligand/FLT3L and Neutralization by Mouse Flt-3 Ligand/FLT3L Antibody.
Recombinant Mouse Flt-3 Ligand/FLT3L (Catalog # 427-FL) stimulates proliferation in BaF3 mouse pro-B cell line transfected with mouse Flt-3 in a dose-dependent manner (orange line). Proliferation elicited by Recombinant Mouse Flt-3 Ligand/FLT3L (10 ng/mL) is neutralized (green line) by increasing concentrations of Goat Anti-Mouse Flt-3 Ligand/FLT3L Antigen Affinity-purified Polyclonal Antibody (Catalog # AF427). The ND50 is typically 0.05-0.25 µg/mL.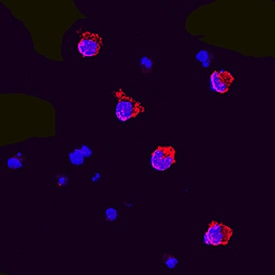
Flt-3 Ligand/FLT3L in HT‑2 Mouse Cell Line.
Flt-3 Ligand/FLT3L was detected in immersion fixed HT-2 mouse T cell line using Goat Anti-Mouse Flt-3 Ligand/FLT3L Antigen Affinity-purified Polyclonal Antibody (Catalog # AF427) at 5 µg/mL for 3 hours at room temperature. Cells were stained using the NorthernLights™ 557-conjugated Anti-Goat IgG Secondary Antibody (red; Catalog # NL001) and counterstained with DAPI (blue). Specific staining was localized to cytoplasm. View our protocol for Fluorescent ICC Staining of Non-adherent Cells.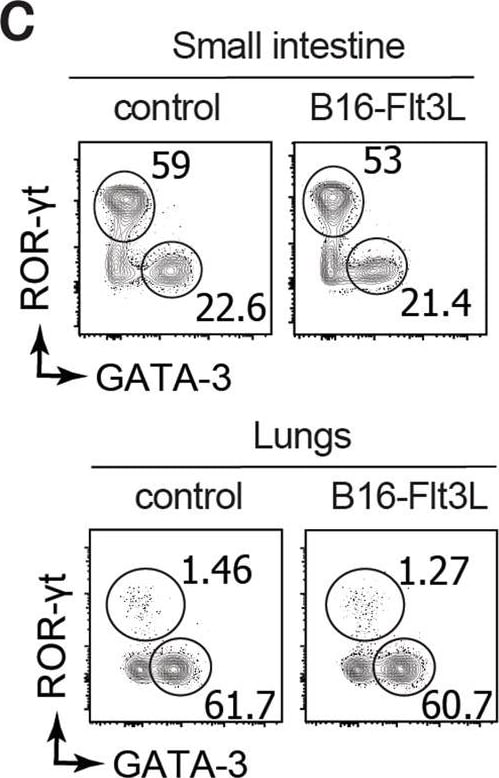
Detection of Mouse Flt-3 Ligand/FLT3L by Flow Cytometry
Flt3L-producing tumors do not expand mature ILCs in periphery. Mice were injected with 2 × 10⁶ B16-Flt3L or B16/PBS as a control. Two weeks after tumor injection, ILCs were analyzed by FACS in the lungs, small intestine and colonic lamina propria. (a) Representative dot plots showing NK1.1+T-bet+Eomes− ILC1, NK1.1+T-bet+Eomes+ cNK, GATA-3+ ILC2, ROR gamma t+ ILC3 and NKp46+ and CCR6+ ILC3 subsets gated on CD45+ Lin (CD3, CD19)neg CD90+ cells in the colonic lamina propria and (b) quantification of absolute numbers (n = 5 to 7/group, 3 experiments). Representative dot plots (c) and absolute numbers (d) of ILC2 and ILC3 in the small intestine lamina propria and lungs of B16-Flt3L and B16/PBS injected mice (n = 5 to 8/group, 3 experiments). (e) Representative dot plots of IL22+ ROR gamma t+ ILC3 and IL-5+ GATA-3+ ILC2 in the small intestine of B16-Flt3L and B16 injected mice (n = 3 to 4, 2 experiments). *P < 0.05; ns, not significant; Student’s t-test (b,d,e). Error bars represent SEM in all panels. Image collected and cropped by CiteAb from the following open publication (https://pubmed.ncbi.nlm.nih.gov/29317685), licensed under a CC-BY license. Not internally tested by R&D Systems.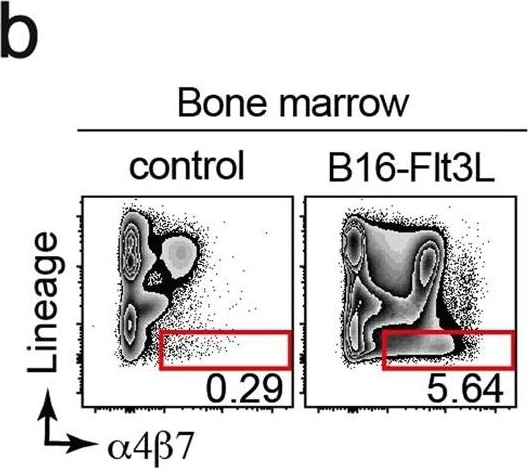
Detection of Mouse Flt-3 Ligand/FLT3L by Flow Cytometry
Flt3L-producing tumors expand CHILPs in the BM. Mice were injected with 2 × 10⁶ B16-Flt3L or B16/PBS as a control. Two weeks after tumor injection, Flt3L serum levels were analyzed by ELISA and CHILPs and ILC2P were analyzed by FACS on BM single-cell suspension. (a) Flt3L serum levels in B16/PBS and B16-Flt3L injected mice (n = 3/group, 2 experiments). Representative dot plots (b) and total number (c) of Lin− alpha 4 beta 7+ cells in the BM of wild-type mice injected with B16-Flt3L or B16/PBS (n = 6/group, 3 experiments). Representative dot plots (d) and absolute numbers (e) of CHILPs and ILC2P in the BM of Id2Gfp/+ mice injected with B16-Flt3L or B16/PBS (n = 6/group, 3 experiments). (f) Correlation plot between Flt3L serum levels determined by ELISA and BM CHILPs absolute numbers determined by FACS in mice treated with B16-Flt3L or B16 (n = 6, 2 experiments). Representative dot plots (g) and absolute numbers (h) of ILCP in the bone marrow of wild type mice injected with B16-Flt3L or B16 cells (n = 5 to 7/group, 3 experiments). *P < 0.05; **P < 0.01; ns, not significant; Student’s t-test (c,e,h), Linear regression with Pearson’s correlation analysis (f). Error bars represent SEM in all panels. Image collected and cropped by CiteAb from the following open publication (https://pubmed.ncbi.nlm.nih.gov/29317685), licensed under a CC-BY license. Not internally tested by R&D Systems.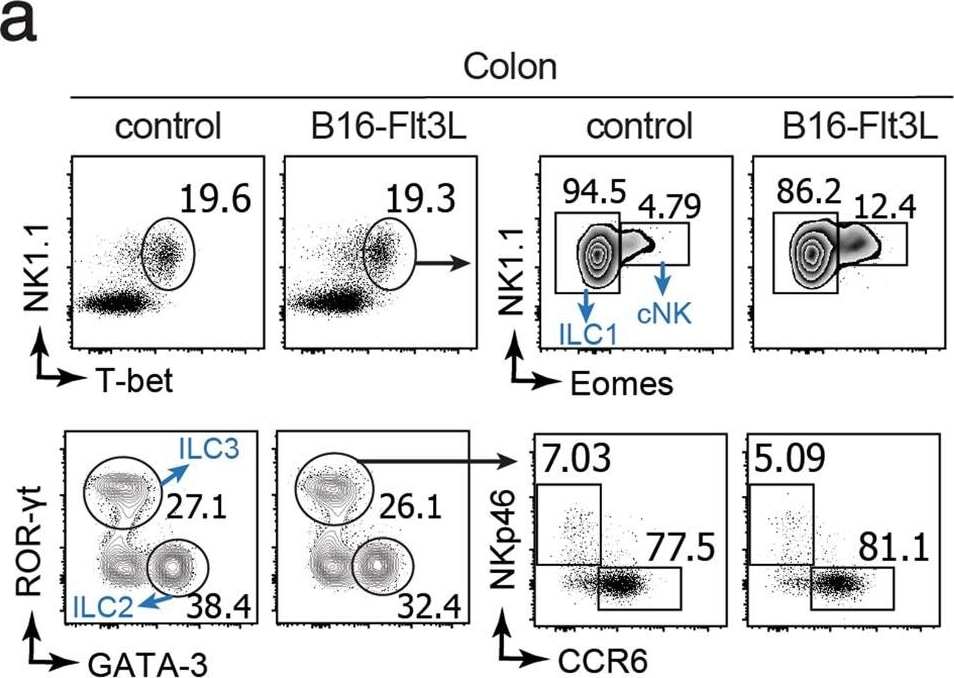
Detection of Mouse Flt-3 Ligand/FLT3L by Flow Cytometry
Flt3L-producing tumors do not expand mature ILCs in periphery. Mice were injected with 2 × 10⁶ B16-Flt3L or B16/PBS as a control. Two weeks after tumor injection, ILCs were analyzed by FACS in the lungs, small intestine and colonic lamina propria. (a) Representative dot plots showing NK1.1+T-bet+Eomes− ILC1, NK1.1+T-bet+Eomes+ cNK, GATA-3+ ILC2, ROR gamma t+ ILC3 and NKp46+ and CCR6+ ILC3 subsets gated on CD45+ Lin (CD3, CD19)neg CD90+ cells in the colonic lamina propria and (b) quantification of absolute numbers (n = 5 to 7/group, 3 experiments). Representative dot plots (c) and absolute numbers (d) of ILC2 and ILC3 in the small intestine lamina propria and lungs of B16-Flt3L and B16/PBS injected mice (n = 5 to 8/group, 3 experiments). (e) Representative dot plots of IL22+ ROR gamma t+ ILC3 and IL-5+ GATA-3+ ILC2 in the small intestine of B16-Flt3L and B16 injected mice (n = 3 to 4, 2 experiments). *P < 0.05; ns, not significant; Student’s t-test (b,d,e). Error bars represent SEM in all panels. Image collected and cropped by CiteAb from the following open publication (https://pubmed.ncbi.nlm.nih.gov/29317685), licensed under a CC-BY license. Not internally tested by R&D Systems.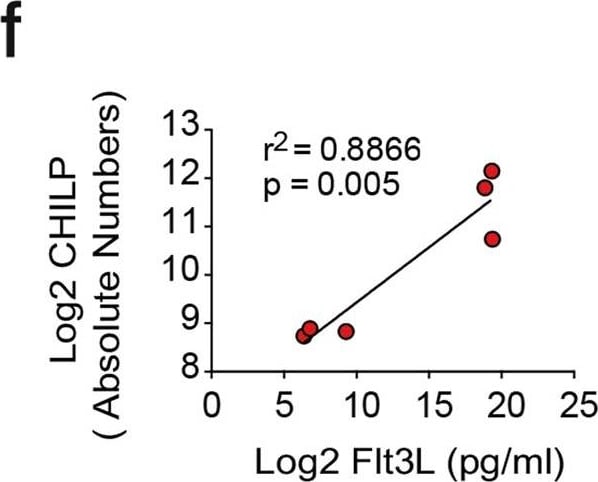
Detection of Mouse Flt-3 Ligand/FLT3L by ELISA
Flt3L-producing tumors expand CHILPs in the BM. Mice were injected with 2 × 10⁶ B16-Flt3L or B16/PBS as a control. Two weeks after tumor injection, Flt3L serum levels were analyzed by ELISA and CHILPs and ILC2P were analyzed by FACS on BM single-cell suspension. (a) Flt3L serum levels in B16/PBS and B16-Flt3L injected mice (n = 3/group, 2 experiments). Representative dot plots (b) and total number (c) of Lin− alpha 4 beta 7+ cells in the BM of wild-type mice injected with B16-Flt3L or B16/PBS (n = 6/group, 3 experiments). Representative dot plots (d) and absolute numbers (e) of CHILPs and ILC2P in the BM of Id2Gfp/+ mice injected with B16-Flt3L or B16/PBS (n = 6/group, 3 experiments). (f) Correlation plot between Flt3L serum levels determined by ELISA and BM CHILPs absolute numbers determined by FACS in mice treated with B16-Flt3L or B16 (n = 6, 2 experiments). Representative dot plots (g) and absolute numbers (h) of ILCP in the bone marrow of wild type mice injected with B16-Flt3L or B16 cells (n = 5 to 7/group, 3 experiments). *P < 0.05; **P < 0.01; ns, not significant; Student’s t-test (c,e,h), Linear regression with Pearson’s correlation analysis (f). Error bars represent SEM in all panels. Image collected and cropped by CiteAb from the following open publication (https://pubmed.ncbi.nlm.nih.gov/29317685), licensed under a CC-BY license. Not internally tested by R&D Systems.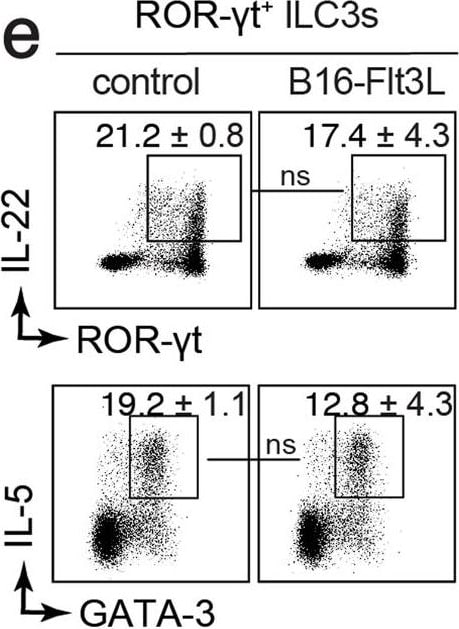
Detection of Mouse Flt-3 Ligand/FLT3L by Flow Cytometry
Flt3L-producing tumors do not expand mature ILCs in periphery. Mice were injected with 2 × 10⁶ B16-Flt3L or B16/PBS as a control. Two weeks after tumor injection, ILCs were analyzed by FACS in the lungs, small intestine and colonic lamina propria. (a) Representative dot plots showing NK1.1+T-bet+Eomes− ILC1, NK1.1+T-bet+Eomes+ cNK, GATA-3+ ILC2, ROR gamma t+ ILC3 and NKp46+ and CCR6+ ILC3 subsets gated on CD45+ Lin (CD3, CD19)neg CD90+ cells in the colonic lamina propria and (b) quantification of absolute numbers (n = 5 to 7/group, 3 experiments). Representative dot plots (c) and absolute numbers (d) of ILC2 and ILC3 in the small intestine lamina propria and lungs of B16-Flt3L and B16/PBS injected mice (n = 5 to 8/group, 3 experiments). (e) Representative dot plots of IL22+ ROR gamma t+ ILC3 and IL-5+ GATA-3+ ILC2 in the small intestine of B16-Flt3L and B16 injected mice (n = 3 to 4, 2 experiments). *P < 0.05; ns, not significant; Student’s t-test (b,d,e). Error bars represent SEM in all panels. Image collected and cropped by CiteAb from the following open publication (https://pubmed.ncbi.nlm.nih.gov/29317685), licensed under a CC-BY license. Not internally tested by R&D Systems.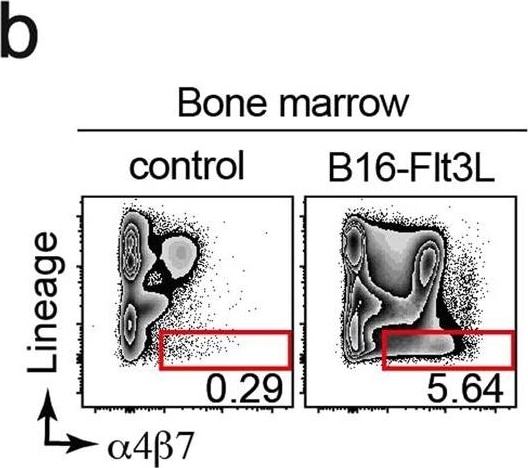
Detection of Mouse Flt-3 Ligand/FLT3L by Flow Cytometry
Flt3L-producing tumors expand CHILPs in the BM. Mice were injected with 2 × 10⁶ B16-Flt3L or B16/PBS as a control. Two weeks after tumor injection, Flt3L serum levels were analyzed by ELISA and CHILPs and ILC2P were analyzed by FACS on BM single-cell suspension. (a) Flt3L serum levels in B16/PBS and B16-Flt3L injected mice (n = 3/group, 2 experiments). Representative dot plots (b) and total number (c) of Lin− alpha 4 beta 7+ cells in the BM of wild-type mice injected with B16-Flt3L or B16/PBS (n = 6/group, 3 experiments). Representative dot plots (d) and absolute numbers (e) of CHILPs and ILC2P in the BM of Id2Gfp/+ mice injected with B16-Flt3L or B16/PBS (n = 6/group, 3 experiments). (f) Correlation plot between Flt3L serum levels determined by ELISA and BM CHILPs absolute numbers determined by FACS in mice treated with B16-Flt3L or B16 (n = 6, 2 experiments). Representative dot plots (g) and absolute numbers (h) of ILCP in the bone marrow of wild type mice injected with B16-Flt3L or B16 cells (n = 5 to 7/group, 3 experiments). *P < 0.05; **P < 0.01; ns, not significant; Student’s t-test (c,e,h), Linear regression with Pearson’s correlation analysis (f). Error bars represent SEM in all panels. Image collected and cropped by CiteAb from the following open publication (https://pubmed.ncbi.nlm.nih.gov/29317685), licensed under a CC-BY license. Not internally tested by R&D Systems.
Mouse Flt-3 Ligand ELISA Standard Curve
Recombinant Mouse Flt‑3 Ligand (Catalog # 427-FL) was serially diluted and captured by Goat Anti-Mouse Flt-3 Ligand/FLT3L Antigen Affinity-purified Polyclonal Antibody (Catalog # AF427) coated on a Clear Polystyrene Microplate (Catalog # DY990). Goat Anti-Mouse Flt-3 Ligand/FLT3L Antigen Affinity-purified Polyclonal Antibody (Catalog # AF427) was biotinylated and incubated with the protein captured on the plate. Detection of the standard curve was achieved by incubating Streptavidin-HRP (Catalog # DY998)
Mouse Flt-3 Ligand ELISA Standard Curve
Recombinant Mouse Flt‑3 Ligand (Catalog # 427-FL) was serially diluted and captured by Goat Anti-Mouse Flt-3 Ligand/FLT3L Antigen Affinity-purified Polyclonal Antibody (Catalog # AF427) coated on a Clear Polystyrene Microplate (Catalog # DY990). Goat Anti-Mouse Flt-3 Ligand/FLT3L Antigen Affinity-purified Polyclonal Antibody (Catalog # AF427) was biotinylated and incubated with the protein captured on the plate. Detection of the standard curve was achieved by incubating Streptavidin-HRP (Catalog # DY998)Applications for Mouse Flt-3 Ligand/FLT3L Antibody
Immunocytochemistry
Sample: Immersion fixed HT-2 mouse T cell line
Western Blot
Sample: Recombinant Mouse Flt-3 Ligand/FLT3L (Catalog # 427-FL)
Neutralization
Mouse Flt-3 Ligand/FLT3L Sandwich Immunoassay
Formulation, Preparation, and Storage
Purification
Reconstitution
Reconstitute at 0.2 mg/mL in sterile PBS. For liquid material, refer to CoA for concentration.
Formulation
Shipping
Stability & Storage
- 12 months from date of receipt, -20 to -70 °C as supplied.
- 1 month, 2 to 8 °C under sterile conditions after reconstitution.
- 6 months, -20 to -70 °C under sterile conditions after reconstitution.
Calculators
Background: Flt-3 Ligand/FLT3L
References
- Wodnar-Filipowicz, A. (2003) News Physiol. Sci. 18:247.
- Dong, J. et al. (2002) Cancer Biol. Ther. 1:486.
- Gilliland, D.G. and J.D. Griffin (2002) Blood 100:1532.
- Hannum, C. et al. (1994) Nature 368:643.
- Lyman, S.D. et al. (1993) Cell 75:1157.
- Savvides, S.N. et al. (2000) Nat. Struct. Biol. 7:486.
- Lyman, S.D. et al. (1994) Blood 83:2795.
- McClanahan, T. et al. (1996) Blood 88:3371.
- Lyman, S.D. et al. (1995) Oncogene 10:149.
- Diener, K.R. et al. (2008) Exp. Hematol. 36:51.
- Farag, S.S. and M.A. Caligiuri (2006) Blood Rev. 20:123.
- Edwan, J.H. et al. (2004) J. Immunol. 172:5016.
Long Name
Alternate Names
Gene Symbol
UniProt
Additional Flt-3 Ligand/FLT3L Products
Product Documents for Mouse Flt-3 Ligand/FLT3L Antibody
Certificate of Analysis
To download a Certificate of Analysis, please enter a lot or batch number in the search box below.
Note: Certificate of Analysis not available for kit components.
Product Specific Notices for Mouse Flt-3 Ligand/FLT3L Antibody
For research use only
Related Research Areas
Citations for Mouse Flt-3 Ligand/FLT3L Antibody
 Powered by Bioz
Customer Reviews for Mouse Flt-3 Ligand/FLT3L Antibody
There are currently no reviews for this product. Be the first to review Mouse Flt-3 Ligand/FLT3L Antibody and earn rewards!
Have you used Mouse Flt-3 Ligand/FLT3L Antibody?
Submit a review and receive an Amazon gift card!
$25/€18/£15/$25CAN/¥2500 for a review with an image
$10/€7/£6/$10CAN/¥1110 for a review without an image
Submit a review
Protocols
Find general support by application which include: protocols, troubleshooting, illustrated assays, videos and webinars.
- Appropriate Fixation of IHC/ICC Samples
- Cellular Response to Hypoxia Protocols
- ClariTSA™ Fluorophore Kits
- Detection & Visualization of Antibody Binding
- ICC Cell Smear Protocol for Suspension Cells
- ICC Immunocytochemistry Protocol Videos
- ICC for Adherent Cells
- Immunocytochemistry (ICC) Protocol
- Immunocytochemistry Troubleshooting
- Immunofluorescence of Organoids Embedded in Cultrex Basement Membrane Extract
- Immunohistochemistry (IHC) and Immunocytochemistry (ICC) Protocols
- Preparing Samples for IHC/ICC Experiments
- Preventing Non-Specific Staining (Non-Specific Binding)
- Primary Antibody Selection & Optimization
- Protocol for VisUCyte™ HRP Polymer Detection Reagent
- Protocol for the Fluorescent ICC Staining of Cell Smears - Graphic
- Protocol for the Fluorescent ICC Staining of Cultured Cells on Coverslips - Graphic
- Protocol for the Preparation and Fluorescent ICC Staining of Cells on Coverslips
- Protocol for the Preparation and Fluorescent ICC Staining of Non-adherent Cells
- Protocol for the Preparation and Fluorescent ICC Staining of Stem Cells on Coverslips
- Protocol for the Preparation of a Cell Smear for Non-adherent Cell ICC - Graphic
- R&D Systems Quality Control Western Blot Protocol
- TUNEL and Active Caspase-3 Detection by IHC/ICC Protocol
- The Importance of IHC/ICC Controls
- Troubleshooting Guide: Western Blot Figures
- Western Blot Conditions
- Western Blot Protocol
- Western Blot Protocol for Cell Lysates
- Western Blot Troubleshooting
- Western Blot Troubleshooting Guide
- View all Protocols, Troubleshooting, Illustrated assays and Webinars