
TNF receptor 1 (TNF RI; also called TNF R‑p55/p60, TNFRSF1A and CD120a) is a type I transmembrane protein that belongs to the TNF receptor superfamily (1, 2). TNF RI is widely expressed and is present on the cell surface as a trimer of 55 kDa subunits. It serves as a receptor for both TNF‑ alpha and TNF‑ beta /lymphotoxin. Each subunit contains four TNF‑ alpha trimer‑binding cysteine‑rich domains (CRD) in its extracellular domain (ECD) (1‑6). TNF‑ alpha binding to TNF R1 induces the sequestration of TNFRI in lipid rafts, where it activates NF kappa B and is cleaved by ADAM‑17/TACE (7, 8). Release of the 28‑34 kDa TNF RI ECD occurs constitutively, and in response to products of pathogens such as LPS, CpG DNA or S. aureus protein A (1, 7‑12). Full‑length TNF RI may also be released in exosome‑like vesicles (12). Such release helps to resolve inflammatory reactions as it down‑regulates cell surface TNF RI and provides soluble TNF RI to bind TNF‑ alpha (6, 13, 14). Exclusion from lipid rafts causes endocytosis of TNF RI complexes and induces apoptosis (7, 15). Although there is a second receptor for TNF‑ alpha (TNF R2), TNF RI is thought to mediate most of the cellular effects of TNF‑ alpha (3). TNF R1 is essential for proper development of lymph node germinal centers and Peyer’s patches, and for combating intracellular pathogens such as Listeria monocytogenes (1‑3). Mouse TNF RI is a 454 amino acid (aa) protein that contains a 21 aa signal sequence and a 191 aa ECD with a PLAD domain (6). This mediates constitutive trimer formation. The PLAD domain is followed by four CRDs, a 23 aa transmembrane domain, and a 219 aa cytoplasmic sequence that contains a neutral sphingomyelinase activation domain and a death domain (16). The ECD of mouse TNF RI shows 67%, 70%, 64%, 70% and 88% aa identity with canine, feline, procine, human and rat TNF RI, respectively; and it shows 23% aa identity with the ECD of TNF RII.
Mouse TNF RI/TNFRSF1A Antibody
R&D Systems | Catalog # AF-425-PB

Scientific images may be resized, cropped, or adjusted for brightness or contrast for presentation purposes. These updates are limited to presentation and do not affect the underlying scientific interpretation of the data. Where available, additional source data may be provided upon request.
Key Product Details
Species Reactivity
Validated:
Cited:
Applications
Validated:
Cited:
Label
Antibody Source
Product Specifications
Immunogen
Ile22-Ala212
Accession # P25118
Specificity
Clonality
Host
Isotype
Endotoxin Level
Scientific Data Images for Mouse TNF RI/TNFRSF1A Antibody
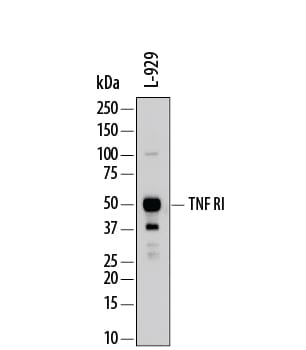
Detection of Mouse TNF RI/TNFRSF1A by Western Blot.
Western blot shows lysates of L-929 mouse fibroblast cell line. PVDF membrane was probed with 0.2 µg/mL of Goat Anti-Mouse TNF RI/TNFRSF1A Antigen Affinity-purified Polyclonal Antibody (Catalog # AF-425-PB) followed by HRP-conjugated Anti-Goat IgG Secondary Antibody (Catalog # HAF109). A specific band was detected for TNF RI/TNFRSF1A at approximately 50-55 kDa (as indicated). This experiment was conducted under reducing conditions and using Immunoblot Buffer Group 1.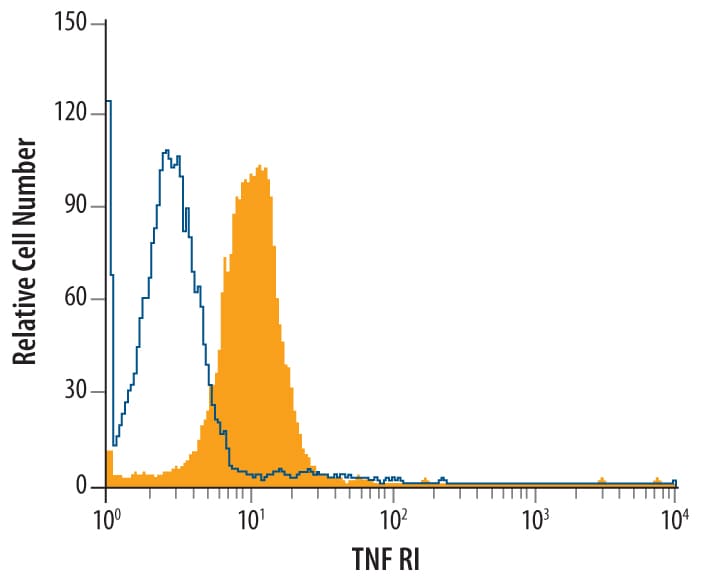
Detection of TNF RI/TNFRSF1A in L‑929 Mouse Cell Line by Flow Cytometry.
L-929 mouse fibroblast cell line was stained with Goat Anti-Mouse TNF RI/TNFRSF1A Antigen Affinity-purified Polyclonal Antibody (Catalog # AF-425-PB, filled histo-gram) or control antibody (Catalog # AB-108-C, open histo-gram), followed by Phycoerythrin-conjugated Anti-Goat IgG Secondary Antibody (Catalog # F0107).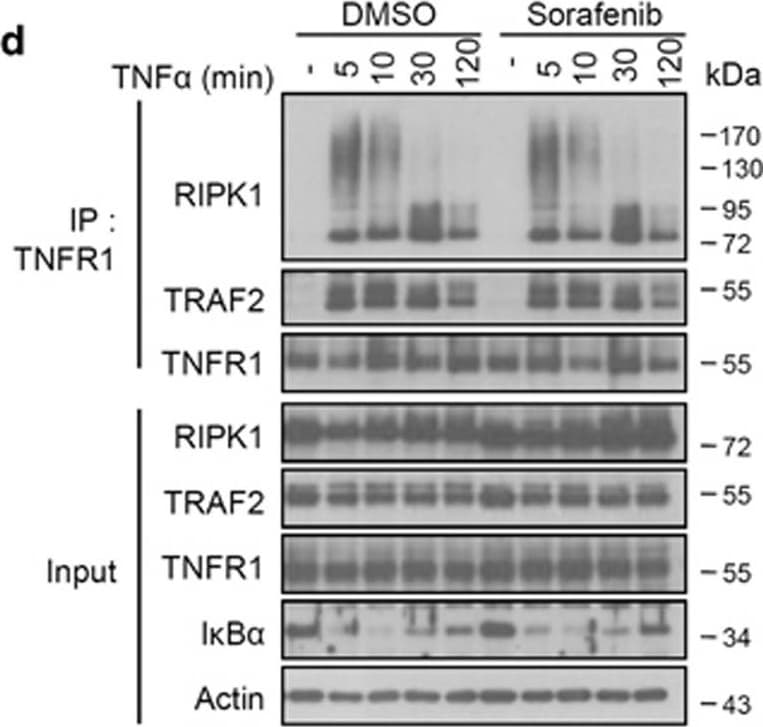
Detection of Mouse TNF RI/TNFRSF1A by Western Blot
Sorafenib does not influence complex I formation, but protects against necroptosis by targeting the necrosome complex. (a) L929 cells were pretreated with 10 μM Nec-1s, Sorafenib or DMSO for 1 h and stimulated with mTNF (10 ng/ml) for the indicated time. Cells were lysed and immunoblotted with the indicated antibodies. *Phosphorylated RIPK1. (b,c) L929 cells were pretreated with 10 μM DMSO, Nec-1 or Sorafenib for 1 h and stimulated with mTNF (10 ng/ml) for 2 h. The relative mRNA levels of mA20 and mI kappa B-alpha were analyzed by qRT-PCR. All bars represent mean±S.D.; n=3, ns=non-significant. (d) L929 cells were pretreated with 10 μM Sorafenib or DMSO and stimulated with mTNF (10 ng/ml) for the indicated time. Cell lysates were immunoprecipitated with anti-mTNFR1 antibody. (e,f) L929 (e) and HT-29 (f) cells were pretreated with 10 μM Nec-1, Sorafenib (Sora) or DMSO and stimulated with zVAD (10 μM)+mTNF (5 ng/ml) (L929) or zVAD (30 μM)+BV6 (1 μM)+hTNF (30 ng/ml) (HT-29) for the time indicated. Cell lysates were immunoprecipitated with the indicated antibodies and both immunoprecipitates (IP) and total lysates (input) were immunoblotted with the indicated antibodies (WB) Image collected and cropped by CiteAb from the following open publication (https://pubmed.ncbi.nlm.nih.gov/28661484), licensed under a CC-BY license. Not internally tested by R&D Systems.
Mouse TNF RI / TNFRSF1A ELISA Standard Curve
Recombinant Mouse TNF RI/TNFRSF1A (Catalog # 425-R1) was serially diluted and captured by Rat Anti-Mouse/Rat TNF RI/TNFRSF1A Monoclonal Antibody (Catalog # MAB425) coated on a Clear Polystyrene Microplate (Catalog # DY990). Goat Anti-Mouse TNF RI/TNFRSF1A Antigen Affinity-purified Polyclonal Antibody (Catalog # AF-425-PB) was biotinylated and incubated with the protein captured on the plate. Detection of the standard curve was achieved by incubating Streptavidin-HRP (Catalog # DY998)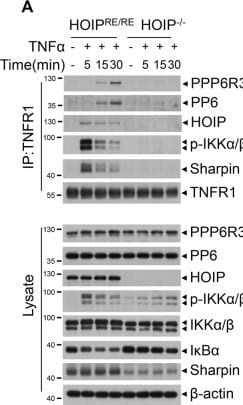
Detection of TNF RI/TNFRSF1A by Western Blot
PP6 negatively modulates LUBAC-mediated M1-ubiquitination of RIPK1 and c-FLIPL.A HOIP−/− or HOIP reconstituted MEFs were treated with TNF alpha for indicated periods time. Cells were lysed with NP-40 buffer and immunoprecipitated with anti-TNFR1 antibody. The immunocomplexes and whole-cell lysates were analyzed by western blotting with indicated antibodies. B PP6+/+ and PP6−/− L929 cells with Flag-RIPK1 stable expression were treated with TNF alpha for indicated periods of time. Cells were lysed with NP-40 buffer and immunoprecipitated with anti-Flag beads. The isolated complex I was eluted with urea lysis buffer. The eluted complex I was further immunoprecipitated with chain specific M1 or K63 ubiquitin antibody. The immunocomplexes and whole-cell lysates were analyzed by western blotting with indicated antibodies. C Flag-RIPK1 was co-expressed with LUBAC (HA-HOIP/Myc-HOIL/Flag-Sharpin) or HA-PP6 in 293T cells for 20 h. Cells were lysed with urea lysis buffer and immunoprecipitated with chain specific M1 ubiquitin antibody. The immunocomplexes and whole-cell lysates were analyzed by western blotting with indicated antibodies. D Flag-tagged c-FLIPL was co-expressed with LUBAC (HA-HOIP/Myc-HOIL/Flag-Sharpin) or HA-PP6 in 293T cells for 20 h. Cells were treated with PS341 8 h after transfection. Cells were lysed with urea lysis buffer and immunoprecipitated with chain specific M1 ubiquitin antibody. The immunocomplexes and whole-cell lysates were analyzed by western blotting with indicated antibodies. Concentrations of reagents used: TNF alpha (T), 50 ng/ml; PS341, 100 nM. Image collected and cropped by CiteAb from the following open publication (https://pubmed.ncbi.nlm.nih.gov/36071040), licensed under a CC-BY license. Not internally tested by R&D Systems.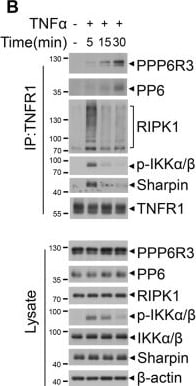
Detection of TNF RI/TNFRSF1A by Western Blot
PP6 is a previously unidentified component of complex I.A MEFs were treated with Flag-TNF alpha or PBS for 15 min. Cells were lysed with NP-40 buffer and immunoprecipitated with anti-Flag beads. The immunocomplexes were analyzed and quantified by mass spectrometry. The protein abundance represented as intensity was quantified by the summed peptide intensities of all extracted Ion chromatograms (XICs). Table below showed the proteins enriched in Flag-TNF alpha treatment group. B MEFs were treated with TNF alpha for indicated periods of time. Cells were lysed with NP-40 buffer and immunoprecipitated with anti-TNFR1 antibody. The immunocomplexes and whole-cell lysates were analyzed by western blotting with indicated antibodies. C PPP6R3+/+ or PPP6R3−/− MEFs were treated with PBS or TNF alpha for 30 min. In situ PLA assay was performed to detect the interaction between RIPK1 and PPP6R3. Red dots indicated the interaction signal of RIPK1 and PPP6R3. D Quantification analysis of the PLA signal dots of RIPK1 and PPP6R3. 20 cells were counted for each group. The panel on the right showed the knockout efficiency of PPP6R3. E PPP6R1, PPP6R2, or PPP6R3 knockout MEFs were treated with Flag-TNF alpha for indicated periods of time. Cells were lysed with NP-40 buffer and immunoprecipitated with anti-Flag beads. The immunocomplexes and whole-cell lysates were analyzed by western blotting with indicated antibodies. F WT or PPP6R1/2/3 triple-knockout MEFs were treated with Flag-TNF alpha for indicated periods of time. Cells were lysed with NP-40 buffer and immunoprecipitated with anti-Flag beads. The immunocomplexes and whole-cell lysates were analyzed by western blotting with indicated antibodies. Concentrations of reagents used: Flag-TNF alpha, 150 ng/ml; TNF alpha, 50 ng/ml. Image collected and cropped by CiteAb from the following open publication (https://pubmed.ncbi.nlm.nih.gov/36071040), licensed under a CC-BY license. Not internally tested by R&D Systems.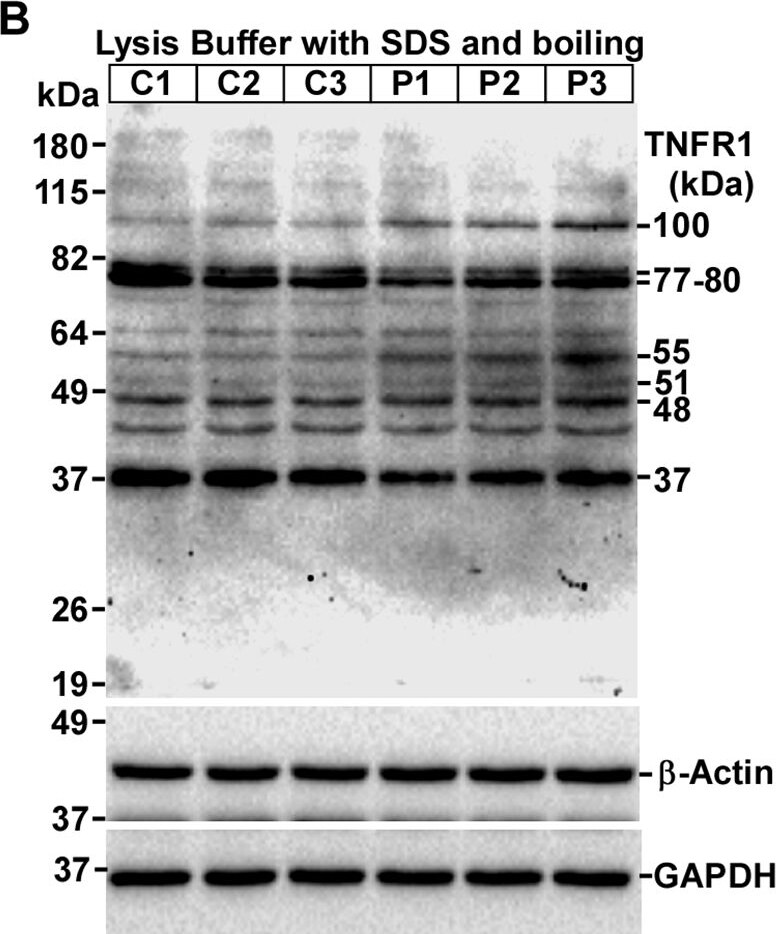
Detection of TNF RI/TNFRSF1A by Western Blot
Expression of TNFR1 isoforms are altered in C57BL/6J mouse prion disease. A Schematic structure of TNFR1 protein shows signal peptide (SP), cysteine-rich domains (CRD), transmembrane (TM), death domains (DD), glycosylation sites and epitope of anti-TNFR1 antibody. B Western blot analysis of TNFR1 on lysates from control and prion-diseased mice brains. C The densitometry of 48-kDa, D 55-kDa and E 100-kDa TNFR1 isoforms show significant increased expression in Prion-diseased (P) mice brains than controls (C). F Contrarily, 37-kDa TNFR1 band intensities are significantly decreased in same setting. G Western blot analysis of TNFR1 on lysates deglycosylated by PNGase F (PNG) show 38 and 45 kDa TNFR1 isoforms are shifted to 35 kDa. H The densitometry of 38-kDa, I 35 kDa TNFR1 bands show reduced expression in prion-diseased mice brains than controls. GAPDH and beta -actin were used as loading controls. Each histogram represents mean ± SD of a set of three brain lysates from control or prion-diseased mice. Two-tailed unpaired t-test was performed to compare the significance of difference between two groups (for detail, see materials and method section). P ≤ 0.05 is considered statistically significant. Image collected and cropped by CiteAb from the following open publication (https://translational-medicine.biomedcentral.com/articles/10.1186/s1296…), licensed under a CC-BY license. Not internally tested by R&D Systems.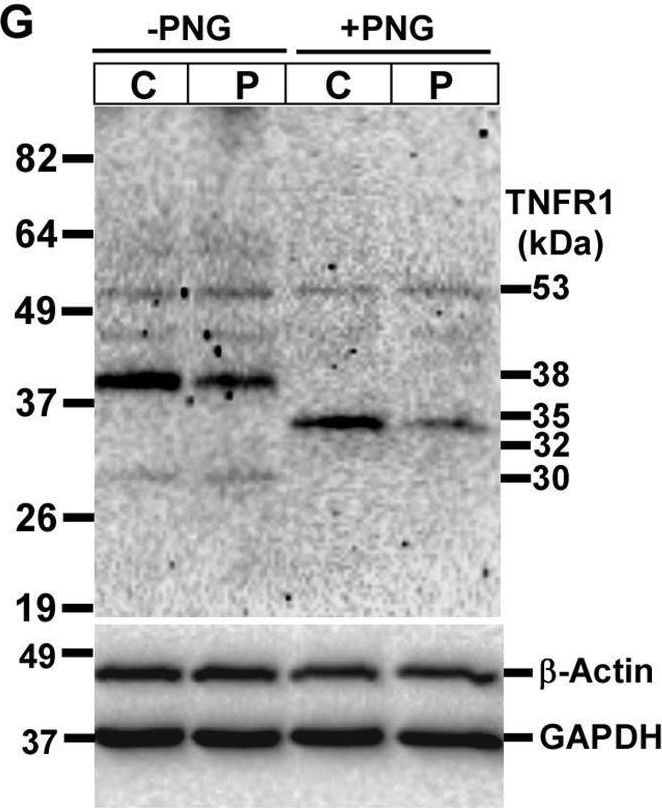
Detection of TNF RI/TNFRSF1A by Western Blot
Expression of TNFR1 isoforms are altered in C57BL/6J mouse prion disease. A Schematic structure of TNFR1 protein shows signal peptide (SP), cysteine-rich domains (CRD), transmembrane (TM), death domains (DD), glycosylation sites and epitope of anti-TNFR1 antibody. B Western blot analysis of TNFR1 on lysates from control and prion-diseased mice brains. C The densitometry of 48-kDa, D 55-kDa and E 100-kDa TNFR1 isoforms show significant increased expression in Prion-diseased (P) mice brains than controls (C). F Contrarily, 37-kDa TNFR1 band intensities are significantly decreased in same setting. G Western blot analysis of TNFR1 on lysates deglycosylated by PNGase F (PNG) show 38 and 45 kDa TNFR1 isoforms are shifted to 35 kDa. H The densitometry of 38-kDa, I 35 kDa TNFR1 bands show reduced expression in prion-diseased mice brains than controls. GAPDH and beta -actin were used as loading controls. Each histogram represents mean ± SD of a set of three brain lysates from control or prion-diseased mice. Two-tailed unpaired t-test was performed to compare the significance of difference between two groups (for detail, see materials and method section). P ≤ 0.05 is considered statistically significant. Image collected and cropped by CiteAb from the following open publication (https://translational-medicine.biomedcentral.com/articles/10.1186/s1296…), licensed under a CC-BY license. Not internally tested by R&D Systems.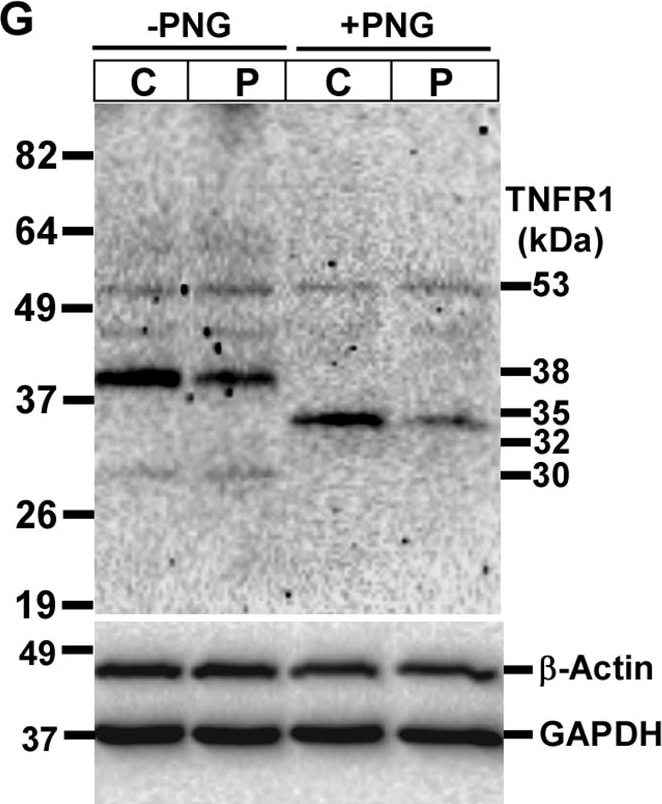
Detection of TNF RI/TNFRSF1A by Western Blot
Expression of TNFR1 isoforms are altered in C57BL/6J mouse prion disease. A Schematic structure of TNFR1 protein shows signal peptide (SP), cysteine-rich domains (CRD), transmembrane (TM), death domains (DD), glycosylation sites and epitope of anti-TNFR1 antibody. B Western blot analysis of TNFR1 on lysates from control and prion-diseased mice brains. C The densitometry of 48-kDa, D 55-kDa and E 100-kDa TNFR1 isoforms show significant increased expression in Prion-diseased (P) mice brains than controls (C). F Contrarily, 37-kDa TNFR1 band intensities are significantly decreased in same setting. G Western blot analysis of TNFR1 on lysates deglycosylated by PNGase F (PNG) show 38 and 45 kDa TNFR1 isoforms are shifted to 35 kDa. H The densitometry of 38-kDa, I 35 kDa TNFR1 bands show reduced expression in prion-diseased mice brains than controls. GAPDH and beta -actin were used as loading controls. Each histogram represents mean ± SD of a set of three brain lysates from control or prion-diseased mice. Two-tailed unpaired t-test was performed to compare the significance of difference between two groups (for detail, see materials and method section). P ≤ 0.05 is considered statistically significant. Image collected and cropped by CiteAb from the following open publication (https://translational-medicine.biomedcentral.com/articles/10.1186/s1296…), licensed under a CC-BY license. Not internally tested by R&D Systems.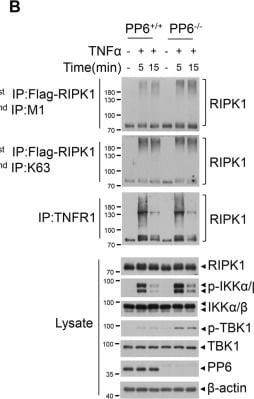
Detection of TNF RI/TNFRSF1A by Western Blot
PP6 negatively modulates LUBAC-mediated M1-ubiquitination of RIPK1 and c-FLIPL.A HOIP−/− or HOIP reconstituted MEFs were treated with TNF alpha for indicated periods time. Cells were lysed with NP-40 buffer and immunoprecipitated with anti-TNFR1 antibody. The immunocomplexes and whole-cell lysates were analyzed by western blotting with indicated antibodies. B PP6+/+ and PP6−/− L929 cells with Flag-RIPK1 stable expression were treated with TNF alpha for indicated periods of time. Cells were lysed with NP-40 buffer and immunoprecipitated with anti-Flag beads. The isolated complex I was eluted with urea lysis buffer. The eluted complex I was further immunoprecipitated with chain specific M1 or K63 ubiquitin antibody. The immunocomplexes and whole-cell lysates were analyzed by western blotting with indicated antibodies. C Flag-RIPK1 was co-expressed with LUBAC (HA-HOIP/Myc-HOIL/Flag-Sharpin) or HA-PP6 in 293T cells for 20 h. Cells were lysed with urea lysis buffer and immunoprecipitated with chain specific M1 ubiquitin antibody. The immunocomplexes and whole-cell lysates were analyzed by western blotting with indicated antibodies. D Flag-tagged c-FLIPL was co-expressed with LUBAC (HA-HOIP/Myc-HOIL/Flag-Sharpin) or HA-PP6 in 293T cells for 20 h. Cells were treated with PS341 8 h after transfection. Cells were lysed with urea lysis buffer and immunoprecipitated with chain specific M1 ubiquitin antibody. The immunocomplexes and whole-cell lysates were analyzed by western blotting with indicated antibodies. Concentrations of reagents used: TNF alpha (T), 50 ng/ml; PS341, 100 nM. Image collected and cropped by CiteAb from the following open publication (https://pubmed.ncbi.nlm.nih.gov/36071040), licensed under a CC-BY license. Not internally tested by R&D Systems.Applications for Mouse TNF RI/TNFRSF1A Antibody
Agonist Activity
The ED50 for this effect is typically 0.05-0.15 μg/mL.
CyTOF-ready
Flow Cytometry
Sample: L‑929 mouse fibroblast cell line
Immunohistochemistry
Sample: Perfusion fixed frozen sections of mouse intestine
Western Blot
Sample: L‑929 mouse fibroblast cell line
Flow Cytometry Panel Builder
Bio-Techne Knows Flow Cytometry
Save time and reduce costly mistakes by quickly finding compatible reagents using the Panel Builder Tool.
Advanced Features
- Spectra Viewer - Custom analysis of spectra from multiple fluorochromes
- Spillover Popups - Visualize the spectra of individual fluorochromes
- Antigen Density Selector - Match fluorochrome brightness with antigen density

Formulation, Preparation, and Storage
Purification
Reconstitution
Reconstitute at 0.2 mg/mL in sterile PBS. For liquid material, refer to CoA for concentration.
Formulation
Shipping
Stability & Storage
- 12 months from date of receipt, -20 to -70 °C as supplied.
- 1 month, 2 to 8 °C under sterile conditions after reconstitution.
- 6 months, -20 to -70 °C under sterile conditions after reconstitution.
Calculators
Background: TNF RI/TNFRSF1A
References
- Pfeffer, K. (2003) Cytokine Growth Factor Rev. 14:185.
- Hehlgans, T. and K. Pfeffer (2005) Immunology 115:1.
- Peschon, J.J. et al. (1998) J. Immunol. 160:943.
- Banner, D.W et al. (1993) Cell 73:431.
- Medvedev, A.E. et al. (1996) J. Biol. Chem. 271:9778.
- Chan, F.K. et al. (2000) Science 288:2351.
- Legler, D.F. et al. (2003) Immunity 18:655.
- Tellier, E. et al. (2006) Exp. Cell Res. 312:3969.
- Xanthoulea, S. et al. (2004) J. Exp. Med. 200:367.
- Jin, L. et al. (2000) J. Immunol. 165:5153.
- Gomez, M.I. et al. (2006) J. Biol. Chem. 281:20190.
- Islam, A. et al. (2006) J. Biol. Chem. 281:6860.
- Garton, K.J. et al. (2006) J. Leukoc. Biol. 79:1105.
- McDermott, M.F. et al. (1999) Cell 97:133.
- Schneider-Brachert, W. et al. (2004) Immunity 21:415.
- Lewis, M. et al. (1991) Proc. Natl. Acad. Sci. USA 88:2830.
Long Name
Alternate Names
Gene Symbol
UniProt
Additional TNF RI/TNFRSF1A Products
Product Documents for Mouse TNF RI/TNFRSF1A Antibody
Certificate of Analysis
To download a Certificate of Analysis, please enter a lot or batch number in the search box below.
Note: Certificate of Analysis not available for kit components.
Product Specific Notices for Mouse TNF RI/TNFRSF1A Antibody
For research use only
Citations for Mouse TNF RI/TNFRSF1A Antibody
 Powered by Bioz
Customer Reviews for Mouse TNF RI/TNFRSF1A Antibody
There are currently no reviews for this product. Be the first to review Mouse TNF RI/TNFRSF1A Antibody and earn rewards!
Have you used Mouse TNF RI/TNFRSF1A Antibody?
Submit a review and receive an Amazon gift card!
$25/€18/£15/$25CAN/¥2500 for a review with an image
$10/€7/£6/$10CAN/¥1110 for a review without an image
Submit a review
Protocols
Find general support by application which include: protocols, troubleshooting, illustrated assays, videos and webinars.
- 7-Amino Actinomycin D (7-AAD) Cell Viability Flow Cytometry Protocol
- Antigen Retrieval Protocol (PIER)
- Antigen Retrieval for Frozen Sections Protocol
- Appropriate Fixation of IHC/ICC Samples
- Cellular Response to Hypoxia Protocols
- Chromogenic IHC Staining of Formalin-Fixed Paraffin-Embedded (FFPE) Tissue Protocol
- Chromogenic Immunohistochemistry Staining of Frozen Tissue
- ClariTSA™ Fluorophore Kits
- Detection & Visualization of Antibody Binding
- Extracellular Membrane Flow Cytometry Protocol
- Flow Cytometry Protocol for Cell Surface Markers
- Flow Cytometry Protocol for Staining Membrane Associated Proteins
- Flow Cytometry Staining Protocols
- Flow Cytometry Troubleshooting Guide
- Fluorescent IHC Staining of Frozen Tissue Protocol
- Graphic Protocol for Heat-induced Epitope Retrieval
- Graphic Protocol for the Preparation and Fluorescent IHC Staining of Frozen Tissue Sections
- Graphic Protocol for the Preparation and Fluorescent IHC Staining of Paraffin-embedded Tissue Sections
- Graphic Protocol for the Preparation of Gelatin-coated Slides for Histological Tissue Sections
- IHC Sample Preparation (Frozen sections vs Paraffin)
- Immunofluorescent IHC Staining of Formalin-Fixed Paraffin-Embedded (FFPE) Tissue Protocol
- Immunohistochemistry (IHC) and Immunocytochemistry (ICC) Protocols
- Immunohistochemistry Frozen Troubleshooting
- Immunohistochemistry Paraffin Troubleshooting
- Intracellular Flow Cytometry Protocol Using Alcohol (Methanol)
- Intracellular Flow Cytometry Protocol Using Detergents
- Intracellular Nuclear Staining Flow Cytometry Protocol Using Detergents
- Intracellular Staining Flow Cytometry Protocol Using Alcohol Permeabilization
- Intracellular Staining Flow Cytometry Protocol Using Detergents to Permeabilize Cells
- Preparing Samples for IHC/ICC Experiments
- Preventing Non-Specific Staining (Non-Specific Binding)
- Primary Antibody Selection & Optimization
- Propidium Iodide Cell Viability Flow Cytometry Protocol
- Protocol for Heat-Induced Epitope Retrieval (HIER)
- Protocol for Liperfluo
- Protocol for Making a 4% Formaldehyde Solution in PBS
- Protocol for VisUCyte™ HRP Polymer Detection Reagent
- Protocol for the Characterization of Human Th22 Cells
- Protocol for the Characterization of Human Th9 Cells
- Protocol for the Preparation & Fixation of Cells on Coverslips
- Protocol for the Preparation and Chromogenic IHC Staining of Frozen Tissue Sections
- Protocol for the Preparation and Chromogenic IHC Staining of Frozen Tissue Sections - Graphic
- Protocol for the Preparation and Chromogenic IHC Staining of Paraffin-embedded Tissue Sections
- Protocol for the Preparation and Chromogenic IHC Staining of Paraffin-embedded Tissue Sections - Graphic
- Protocol for the Preparation and Fluorescent IHC Staining of Frozen Tissue Sections
- Protocol for the Preparation and Fluorescent IHC Staining of Paraffin-embedded Tissue Sections
- Protocol for the Preparation of Gelatin-coated Slides for Histological Tissue Sections
- Protocol: Annexin V and PI Staining by Flow Cytometry
- Protocol: Annexin V and PI Staining for Apoptosis by Flow Cytometry
- R&D Systems Quality Control Western Blot Protocol
- TUNEL and Active Caspase-3 Detection by IHC/ICC Protocol
- The Importance of IHC/ICC Controls
- Troubleshooting Guide: Fluorokine Flow Cytometry Kits
- Troubleshooting Guide: Immunohistochemistry
- Troubleshooting Guide: Western Blot Figures
- Western Blot Conditions
- Western Blot Protocol
- Western Blot Protocol for Cell Lysates
- Western Blot Troubleshooting
- Western Blot Troubleshooting Guide
- View all Protocols, Troubleshooting, Illustrated assays and Webinars
Associated Pathways


