Mouse Complement Factor D/Adipsin Antibody
R&D Systems | Catalog # AF5430

Key Product Details
Species Reactivity
Validated:
Mouse
Cited:
Mouse
Applications
Validated:
Western Blot, Immunoprecipitation
Cited:
Immunohistochemistry, Western Blot
Label
Unconjugated
Antibody Source
Polyclonal Sheep IgG
Loading...
Product Specifications
Immunogen
Mouse myeloma cell line NS0-derived recombinant mouse Complement Factor D/Adipsin
Ile26-Ser259
Accession # P03953
Ile26-Ser259
Accession # P03953
Specificity
Detects mouse Complement Factor D/Adipsin in direct ELISAs and Western blots. In direct ELISAs, approximately 10% cross-reactivity with recombinant human (rh) Complement Factor D is observed and less than 5% cross-reactivity with rhGranzyme A is observed.
Clonality
Polyclonal
Host
Sheep
Isotype
IgG
Scientific Data Images for Mouse Complement Factor D/Adipsin Antibody
Detection of Mouse Complement Factor D/Adipsin by Western Blot.
Western blot shows lysates of mouse plasma. PVDF membrane was probed with 1 µg/mL of Sheep Anti-Mouse Complement Factor D/Adipsin Antigen Affinity-purified Polyclonal Antibody (Catalog # AF5430) followed by HRP-conjugated Anti-Sheep IgG Secondary Antibody (Catalog # HAF016). A specific band was detected for Complement Factor D/Adipsin at approximately 45kDa (as indicated). This experiment was conducted under reducing conditions and using Immunoblot Buffer Group 8.
Detection of Mouse Complement Factor D/Adipsin by Western Blot
Bone marrow (BM) Adipsin induces bone marrow adiposity expansion during aging.(A) Immunoblot of Adipsin and Adiponectin from plasma of chow-fed male mice at 6, 24, and 76 weeks of age (L.C. = Coomassie staining of the membrane). (B, C) qPCR analyses of gene expression in the BM from tibia (B) and Cfd expression in the epididymal white adipose tissue and subcutaneous white adipose tissue (C) from chow-fed male mice at 26 and 78 weeks of age (n = 5, 5). *p<0.05 for young vs. aging mice. (D–I) Chow-fed 1-year-old male mice. WT (n = 10) and Adipsin KO (n = 9). (D) Representative osmium tetroxide staining and (E) quantification of femoral MAT; (F, G) femoral bone mineral density (BMD) in the cortical (F) and trabecular (G) regions, and (H, I) bone volume normalized by total voume in the cortical (H) and trabecular (I) regions of the femur determined by μCT scans. **p<0.01 for WT vs. Adipsin KO mice. Data represent mean ± SEM. Two-tailed Student’s t-tests were used for statistical analyses.Metabolic phenotyping of Adipsin KO mice during aging.Chow-fed 1-year-old male mice. WT (n = 10) and Adipsin KO (n = 9). (A) Body weight and composition assessed by EchoMRI; (B) insulin tolerance test; (C) GTT; (D) hematoxylin and eosin staining of femoral marrow adipose tissue. (E, F) Average trabecular number (E) and cortical thickness (F) of femurs determined by μCT scans. Data represent mean ± SEM. Two-tailed Student’s t-test was used for statistical analyses. Image collected and cropped by CiteAb from the following open publication (https://pubmed.ncbi.nlm.nih.gov/34155972), licensed under a CC-BY license. Not internally tested by R&D Systems.
Detection of Mouse Complement Factor D/Adipsin by Western Blot
Adipsin is robustly induced in the bone marrow (BM) during bone marrow adipose tissue (BMAT) expansion. (D) immunoblot of plasma Adipsin&Adiponectin (APN) – Coomassie staining of the membrane was used as loading control (L.C.) (n = 4, 4);&immunoblot of Adipsin from bone – HSP90 was used as the loading control (n = 4, 4). Image collected & cropped by CiteAb from the following open publication (https://pubmed.ncbi.nlm.nih.gov/34155972), licensed under a CC-BY license. Not internally tested by R&D Systems.
Detection of Complement Factor D/Adipsin by Western Blot
Adipocyte PPAR gamma acetylation diminishes the metabolic improvements of intermittent fasting (IF) in middle-aged mice. (A–C) Body weight (A), fat mass (B), lean mass (C) of male middle-aged WT and aKQ mice before and after 6 weeks of IF (n = 6, 6). (D) ITT and AUC after fasting for 5 h after 5 weeks of IF. (E) GTT and AUC after an overnight fasting after 6 weeks of IF (n = 6, 6). (F,G) Plasma NEFA and triglyceride (TG) levels after overnight fasting after 6 weeks of IF mice (n = 6, 6). (H,I) WB with quantification of Adipsin and Adiponectin protein levels in plasma and iWAT after 6 weeks of IF (n = 6, 6). (J) Representative H & E staining of BAT, iWAT, and eWAT after IF. Scale bar: 200 µm. (K) qPCR analysis of gene expression levels in BAT (n = 6, 6). Data are presented as mean ± SEM, two-way ANOVA and two-tailed Student’s t-test were used to test significances. * p < 0.05, ** p < 0.01, *** p < 0.001. Image collected and cropped by CiteAb from the following open publication (https://pubmed.ncbi.nlm.nih.gov/37408258), licensed under a CC-BY license. Not internally tested by R&D Systems.
Detection of Complement Factor D/Adipsin by Western Blot
PPAR gamma acetylation-induced BAT whitening persists despite resveratrol treatment. (A) Body-weight curves of DIO mice co-treated with Rosi and resveratrol (n = 6, 6). (B) ITT and AUC after the co-treatment for 2 weeks (n = 6, 6). (C) GTT and AUC at 3 weeks co-treatment (n = 6, 6). (D). Representative H & E staining of BAT, iWAT, and eWAT after Rosi and resveratrol treatment for 3 weeks. Scale bar: 200 µm. (n = 6, 6). (E) Quantification of WAT adipocyte size (n = 6, 6). (F,G) WB and quantifications in BAT (n = 6, 6). (H,I) Immunohistochemical staining and quantification of UCP1 protein in BAT (n = 3, 3). Data ae presented as mean ± SEM, two-tailed Student’s t-test. * p < 0.05, ** p < 0.01. Image collected and cropped by CiteAb from the following open publication (https://pubmed.ncbi.nlm.nih.gov/37408258), licensed under a CC-BY license. Not internally tested by R&D Systems.
Detection of Complement Factor D/Adipsin by Western Blot
aKQ mice are sensitive to TZD treatment but with worsened BAT whitening. (A) Body compositions of diet-induced obese (DIO) WT and aKQ mice after a rosiglitazone (Rosi) diet for 7 weeks (n = 13, 9). (B). ITT on Rosi treatment for 0 and 5 weeks (n = 13, 9, 13, and 9). (C) GTT on Rosi treatment for 0 and 6 weeks (n = 13, 9, 13, and 9). (D) AUC of ITT (n = 13, 9, 13, and 9). (E) AUC of GTT (n = 13, 9, 13, and 9). (F,G) WB with quantification of Adipsin and Adiponectin protein levels in plasma (n = 6 and 6). (H) Tissue masses at sacrifice after 7 weeks of Rosi treatment (n = 13, 9). (I,J) WB with quantifications in BAT (n = 6 and 6). * p < 0.05, ** p < 0.01, *** p < 0.001. Image collected and cropped by CiteAb from the following open publication (https://pubmed.ncbi.nlm.nih.gov/37408258), licensed under a CC-BY license. Not internally tested by R&D Systems.
Detection of Mouse Complement Factor D/Adipsin by Western Blot
CD9 overexpression in the liver ameliorates HFD‐induced hepatic steatosis. AAV‐Ctr and AAV‐CD9 mice were fed on HFD for 12 weeks. A) Schematic diagrams illustrating the experimental design and treatment groups. B) Body weight, liver weight and liver/body weight were determined. C) Liver TG contents were determined enzymatically. D) Representative H&E and Oil Red O staining of livers, and their quantification. E) The mRNA levels of genes related to lipid metabolism in livers. F) Serum levels of liver enzyme activity (ALT and AST) were determined enzymatically. G) Western blot and its quantification of CD9, FLI1 and CFD in liver tissues. Scale bar = 100 µm for C. n = 6 mice per group for B‐G. Data are presented as the mean ± S.E.M. Statistical analysis was performed using t‐test for B‐G. *, p < 0.05; **, p < 0.01; ***, p < 0.001. Image collected and cropped by CiteAb from the following open publication (https://pubmed.ncbi.nlm.nih.gov/38837628), licensed under a CC-BY license. Not internally tested by R&D Systems.Applications for Mouse Complement Factor D/Adipsin Antibody
Application
Recommended Usage
Immunoprecipitation
25 µg/mL
Sample: Conditioned cell culture medium spiked with Recombinant Mouse Complement Factor D/Adipsin, see our available Western blot detection antibodies
Sample: Conditioned cell culture medium spiked with Recombinant Mouse Complement Factor D/Adipsin, see our available Western blot detection antibodies
Western Blot
1 µg/mL
Sample: Mouse plasma
Sample: Mouse plasma
Reviewed Applications
Read 2 reviews rated 5 using AF5430 in the following applications:
Formulation, Preparation, and Storage
Purification
Antigen Affinity-purified
Reconstitution
Reconstitute at 0.2 mg/mL in sterile PBS. For liquid material, refer to CoA for concentration.
Loading...
Formulation
Lyophilized from a 0.2 μm filtered solution in PBS with Trehalose. *Small pack size (SP) is supplied either lyophilized or as a 0.2 µm filtered solution in PBS.
Shipping
Lyophilized product is shipped at ambient temperature. Liquid small pack size (-SP) is shipped with polar packs. Upon receipt, store immediately at the temperature recommended below.
Stability & Storage
Use a manual defrost freezer and avoid repeated freeze-thaw cycles.
- 12 months from date of receipt, -20 to -70 °C as supplied.
- 1 month, 2 to 8 °C under sterile conditions after reconstitution.
- 6 months, -20 to -70 °C under sterile conditions after reconstitution.
Calculators
Background: Complement Factor D/Adipsin
Alternate Names
Adipsin, ADN, AMBP-1, CFD, PFD
Gene Symbol
CFD
UniProt
Additional Complement Factor D/Adipsin Products
Product Documents for Mouse Complement Factor D/Adipsin Antibody
Certificate of Analysis
To download a Certificate of Analysis, please enter a lot or batch number in the search box below.
Note: Certificate of Analysis not available for kit components.
Product Specific Notices for Mouse Complement Factor D/Adipsin Antibody
For research use only
Related Research Areas
Citations for Mouse Complement Factor D/Adipsin Antibody
 Powered by Bioz
Customer Reviews for Mouse Complement Factor D/Adipsin Antibody (2)
5 out of 5
2 Customer Ratings
Have you used Mouse Complement Factor D/Adipsin Antibody?
Submit a review and receive an Amazon gift card!
$25/€18/£15/$25CAN/¥2500 Yen for a review with an image
$10/€7/£6/$10CAN/¥1110 Yen for a review without an image
Submit a review
Customer Images

Showing
1
-
2 的
2 reviews
Showing All
Filter By:
-
Application: ELISASample Tested: EDTA PlasmaSpecies: MouseVerified Customer | Posted 05/19/2026Detection of mouse Factor D in plasma from WT and FD‑KO mice using a sandwich ELISA.Mouse Factor D in plasma from WT and FD-/- mice was confirmed by sandwich ELISA using 2ug/ml AF5430 as the capture antibody and 0.5ug/ml BAF5430 as the detection antibody.

-
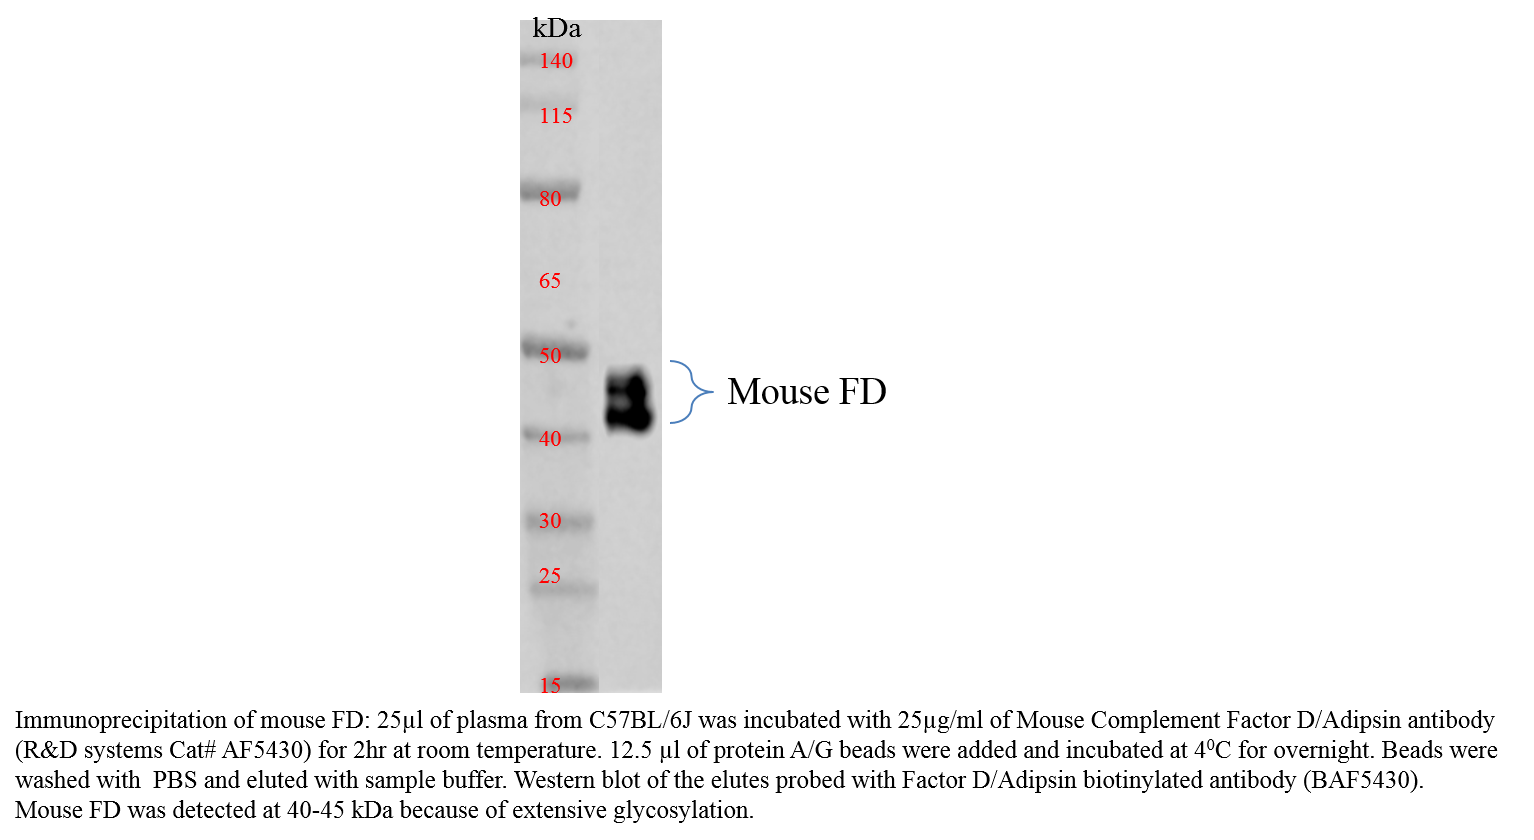
Application: ImmunoprecipitationSample Tested: PlasmaSpecies: MouseVerified Customer | Posted 08/23/2019
There are no reviews that match your criteria.
Protocols
Find general support by application which include: protocols, troubleshooting, illustrated assays, videos and webinars.
- Cellular Response to Hypoxia Protocols
- Immunoprecipitation Protocol
- R&D Systems Quality Control Western Blot Protocol
- Troubleshooting Guide: Western Blot Figures
- Western Blot Conditions
- Western Blot Protocol
- Western Blot Protocol for Cell Lysates
- Western Blot Troubleshooting
- Western Blot Troubleshooting Guide
- View all Protocols, Troubleshooting, Illustrated assays and Webinars
Loading...