
Human FBXW7/Cdc4 Antibody (800201)
R&D Systems | Catalog # MAB7776


Scientific images may be resized, cropped, or adjusted for brightness or contrast for presentation purposes. These updates are limited to presentation and do not affect the underlying scientific interpretation of the data. Where available, additional source data may be provided upon request.
Key Product Details
Species Reactivity
Validated:
Cited:
Applications
Validated:
Cited:
Label
Antibody Source
Product Specifications
Immunogen
Lys377-Lys707
Accession # Q969H0
Specificity
Clonality
Host
Isotype
Scientific Data Images for Human FBXW7/Cdc4 Antibody (800201)
Detection of Human FBXW7/Cdc4 by Western Blot.
Western blot shows lysates of Jurkat human acute T cell leukemia cell line. PVDF membrane was probed with 2 µg/mL of Mouse Anti-Human FBXW7/Cdc4 Monoclonal Antibody (Catalog # MAB7776) followed by HRP-conjugated Anti-Mouse IgG Secondary Antibody (Catalog # HAF018). A specific band was detected for FBXW7/Cdc4 at approximately 110 kDa (as indicated). This experiment was conducted under reducing conditions and using Immunoblot Buffer Group 1.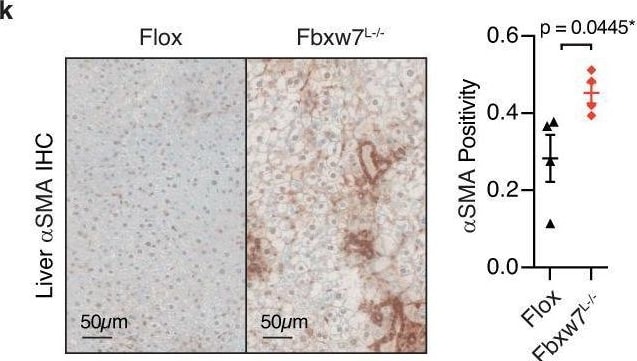
Detection of brqg9ujed6vbcpgfvygo.jpg by Immunohistochemistry
FBXW7 protects against NASH.a Analysis of hepatic FBXW7 expression in patients across the severity stages of NAFLD progression. n = 50 for NAFL; n = 87 for NASH_F0-2; n = 68 for NASH_F3-4. bFBXW7 mRNA levels in fibrotic liver biopsies from patients with NAFLD. n = 137 for Fibrosis stage 0-2; n = 68 for Fibrosis stage 3-4. Relative mRNA levels of NASH progression signature genes (c), inflammation and fibrogenesis genes (d) in Flox (control) and Fbxw7-null livers, n = 5. e Immunoblots and quantification of proteins related to NASH progression in livers and serum from Flox and Fbxw7L−/− littermates. Each lane represents one mouse, n = 3. f Overall immune contents of control and Fbxw7-null livers, reflected by the absolute immune fraction scores, n = 3. g Stacked bar chart illustrating cell distributions of control and Fbxw7-null livers, n = 3. CAFs Cancer-associated fibroblasts, na non-applicable. GSEA of SAMac-defining signature (h) and hepatic stellate cell signature (i). Array genes were ordered from the highest in Fbxw7-null livers (left) to the highest in control livers (right). Locations of genes in each signature are indicated by the vertical black bars. NES normalized enrichment score. Representative images and quantification of Aif1 (j) and alpha SMA (k) immunohistochemistry (IHC) staining, n = 4. Scale bars, 50 μm. l mRNA expression of ER stress and apoptotic genes in control and Fbxw7-null livers, n = 5. m Immunoblots and quantification of proteins related to ER stress and apoptosis. Each lane represents one mouse, n = 3. Data are presented as means ± SEM (a–f, j–m). *p < 0.05, unpaired two-tailed Student’s t test (a–g, j–m). Source data are provided as a Source Data file. Image collected and cropped by CiteAb from the following open publication (https://pubmed.ncbi.nlm.nih.gov/37914694), licensed under a CC-BY license. Not internally tested by R&D Systems.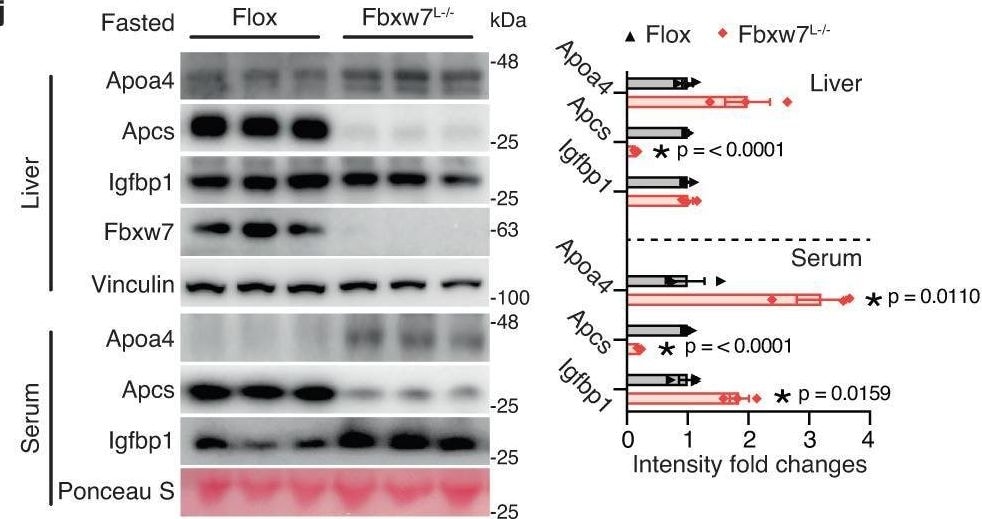
Detection of chnbnm42rnebvmhsgzk7.jpg by Western Blot
Metabolic stress aggravates NASH in the absence of Fbxw7.a Heatmap showing mRNA fold changes of NASH-related genes in the fed, fasted and keto diet nutritional regimens, assessed by RT-qPCR, n = 5-6 (see Source data file for specific sample numbers). b Representative images of H&E and Masson’s trichrome (MTC) stained liver tissue sections from Flox and Fbxw7L−/− mice under different nutritional regimens. Arrowhead, fibrotic area (blue). Images are representative of n = 3 mice per group. Immunoblots and quantification of the indicated proteins from Flox and Fbxw7L−/− mice upon fasting (c) or post a 20-day keto diet (d). Each lane represents one mouse, n = 3. e HepG2 cells stably expressing empty vector or FBXW7 were treated with 500 nM Thapsigargin (Tg) or DMSO for 24 h followed by immunoblot examination. Immunoblots are from one experiment representative of 3 independent experiments with similar results. f Overlap of liver-enriched secreted factors with hepatic DEGs (p < 0.05, |FC|>1.30) induced by Fbxw7 deficiency, by fasting, or by a keto diet. g Ranking of the secreted factors identified in Fig. 7f by the sum of absolute mRNA fold changes of the four transcriptome datasets. h, i Hepatic mRNA expression of Apoa4, Apcs and Igfbp1 from Flox and Fbxw7L−/− mice upon fasting (h, n = 5) or post a 20-day keto diet (i, n = 6 for Flox and n = 5 for Fbxw7L−/− mice). Immunoblots and quantification of serum and liver levels of the hepatic secreted factors from Flox and Fbxw7L−/− mice upon fasting (j) or post a 20-day keto diet (k). Each lane represents one mouse, n = 3. Data are represented as means ± SEM (c, d, h–k). *p < 0.05, unpaired two-tailed Student’s t test (a, c, d, h–k). Source data are provided as a Source Data file including Fig. 7a p-values. Image collected and cropped by CiteAb from the following open publication (https://pubmed.ncbi.nlm.nih.gov/37914694), licensed under a CC-BY license. Not internally tested by R&D Systems.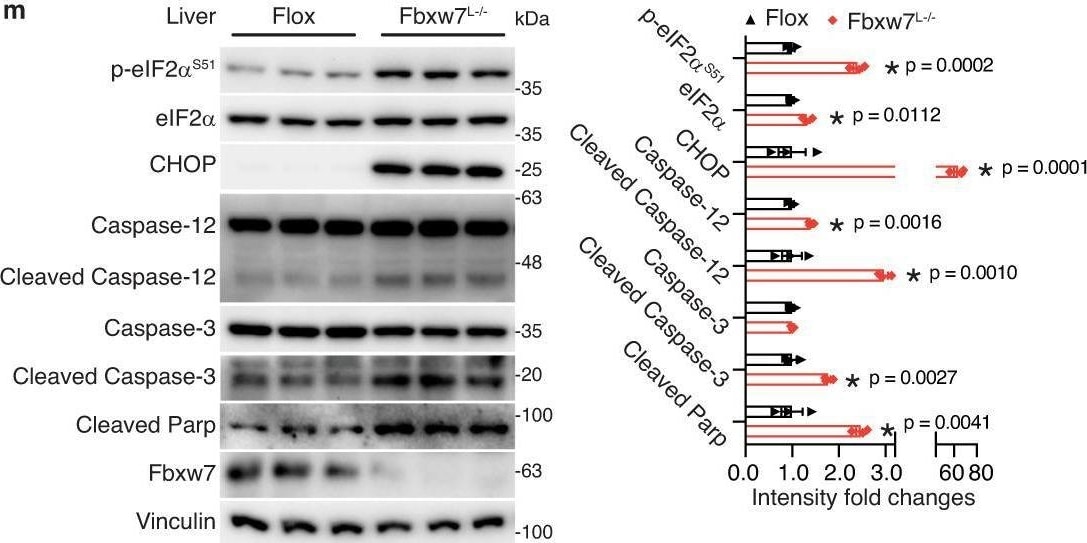
Detection of cuc21grtisjdtokindpa.jpg by Western Blot
FBXW7 protects against NASH.a Analysis of hepatic FBXW7 expression in patients across the severity stages of NAFLD progression. n = 50 for NAFL; n = 87 for NASH_F0-2; n = 68 for NASH_F3-4. bFBXW7 mRNA levels in fibrotic liver biopsies from patients with NAFLD. n = 137 for Fibrosis stage 0-2; n = 68 for Fibrosis stage 3-4. Relative mRNA levels of NASH progression signature genes (c), inflammation and fibrogenesis genes (d) in Flox (control) and Fbxw7-null livers, n = 5. e Immunoblots and quantification of proteins related to NASH progression in livers and serum from Flox and Fbxw7L−/− littermates. Each lane represents one mouse, n = 3. f Overall immune contents of control and Fbxw7-null livers, reflected by the absolute immune fraction scores, n = 3. g Stacked bar chart illustrating cell distributions of control and Fbxw7-null livers, n = 3. CAFs Cancer-associated fibroblasts, na non-applicable. GSEA of SAMac-defining signature (h) and hepatic stellate cell signature (i). Array genes were ordered from the highest in Fbxw7-null livers (left) to the highest in control livers (right). Locations of genes in each signature are indicated by the vertical black bars. NES normalized enrichment score. Representative images and quantification of Aif1 (j) and alpha SMA (k) immunohistochemistry (IHC) staining, n = 4. Scale bars, 50 μm. l mRNA expression of ER stress and apoptotic genes in control and Fbxw7-null livers, n = 5. m Immunoblots and quantification of proteins related to ER stress and apoptosis. Each lane represents one mouse, n = 3. Data are presented as means ± SEM (a–f, j–m). *p < 0.05, unpaired two-tailed Student’s t test (a–g, j–m). Source data are provided as a Source Data file. Image collected and cropped by CiteAb from the following open publication (https://pubmed.ncbi.nlm.nih.gov/37914694), licensed under a CC-BY license. Not internally tested by R&D Systems.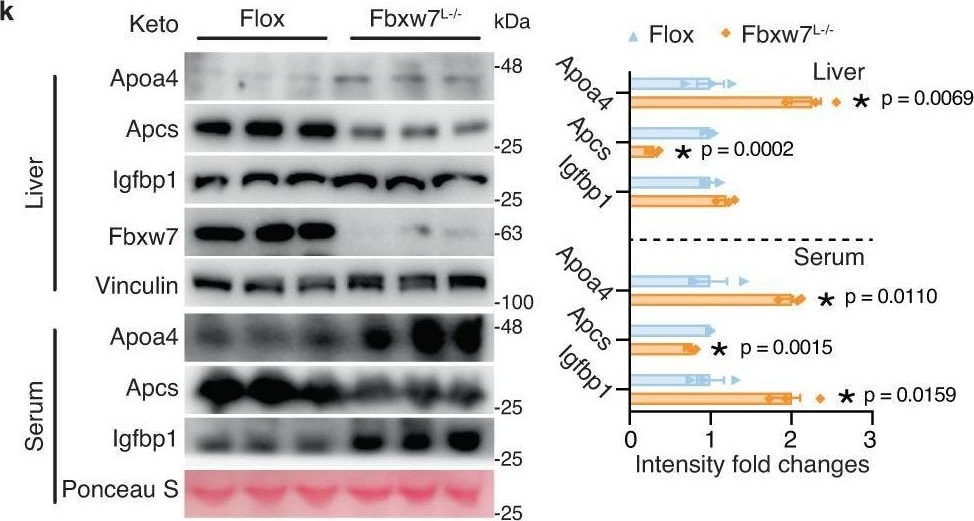
Detection of dc3bznwwrhaqf7tjfnjg.jpg by Western Blot
Metabolic stress aggravates NASH in the absence of Fbxw7.a Heatmap showing mRNA fold changes of NASH-related genes in the fed, fasted and keto diet nutritional regimens, assessed by RT-qPCR, n = 5-6 (see Source data file for specific sample numbers). b Representative images of H&E and Masson’s trichrome (MTC) stained liver tissue sections from Flox and Fbxw7L−/− mice under different nutritional regimens. Arrowhead, fibrotic area (blue). Images are representative of n = 3 mice per group. Immunoblots and quantification of the indicated proteins from Flox and Fbxw7L−/− mice upon fasting (c) or post a 20-day keto diet (d). Each lane represents one mouse, n = 3. e HepG2 cells stably expressing empty vector or FBXW7 were treated with 500 nM Thapsigargin (Tg) or DMSO for 24 h followed by immunoblot examination. Immunoblots are from one experiment representative of 3 independent experiments with similar results. f Overlap of liver-enriched secreted factors with hepatic DEGs (p < 0.05, |FC|>1.30) induced by Fbxw7 deficiency, by fasting, or by a keto diet. g Ranking of the secreted factors identified in Fig. 7f by the sum of absolute mRNA fold changes of the four transcriptome datasets. h, i Hepatic mRNA expression of Apoa4, Apcs and Igfbp1 from Flox and Fbxw7L−/− mice upon fasting (h, n = 5) or post a 20-day keto diet (i, n = 6 for Flox and n = 5 for Fbxw7L−/− mice). Immunoblots and quantification of serum and liver levels of the hepatic secreted factors from Flox and Fbxw7L−/− mice upon fasting (j) or post a 20-day keto diet (k). Each lane represents one mouse, n = 3. Data are represented as means ± SEM (c, d, h–k). *p < 0.05, unpaired two-tailed Student’s t test (a, c, d, h–k). Source data are provided as a Source Data file including Fig. 7a p-values. Image collected and cropped by CiteAb from the following open publication (https://pubmed.ncbi.nlm.nih.gov/37914694), licensed under a CC-BY license. Not internally tested by R&D Systems.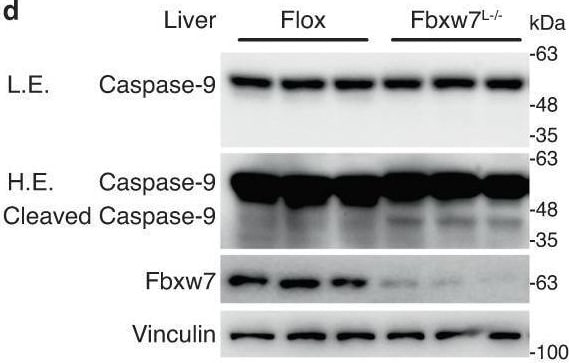
Detection of fjokjk3oovlorfd1ugop.jpg by Western Blot
Fbxw7-null livers exhibit mitochondrial dysfunction and autophagy deficiency.a GO cellular component analysis of downregulated DEGs (p < 0.05, |FC| > 1.30) in Fbxw7-null livers. Top enriched terms are shown. The number of genes in each category are shown in parentheses. b Relative amounts of mitochondrial DNA (mtDNA), normalized to nuclear DNA (nDNA) in control and Fbxw7-null livers (n = 6). c Immunoblots and quantification of serum Cytochrome c levels of Flox and Fbxw7L−/− littermates. Each lane represents one mouse, n = 3. d Immunoblots and quantification of hepatic Caspase-9 and cleaved Caspase-9. Each lane represents one mouse, n = 3. L.E. Low Exposure, H.E. High Exposure. e mRNA expression of autophagy and lysosome-related genes in control and Fbxw7-null livers, n = 5. f Immunoblots and quantification of key autophagy components. Each lane represents one mouse, n = 3. g mRNA expression of mitophagy genes in control and Fbxw7-null livers, n = 5. Immunoblots and quantification of key mitophagy components (h) and proteins mediating mitochondrial fission and fusion (i). Each lane represents one mouse, n = 3. j, k Fbxw7 Flox mice were injected with adenovirus expressing GFP or Cre recombinase and livers were collected and subjected to RT-qPCR (j, n = 7) and immunoblot (k, n = 3) analysis of autophagy and mitophagy genes. Each lane represents one mouse. Immunoblot quantification results are shown on the right panel (k). Data are presented as means ± SEM, *p < 0.05, unpaired two-tailed Student’s t test (b, c, e–k). Source data are provided as a Source Data file. Image collected and cropped by CiteAb from the following open publication (https://pubmed.ncbi.nlm.nih.gov/37914694), licensed under a CC-BY license. Not internally tested by R&D Systems.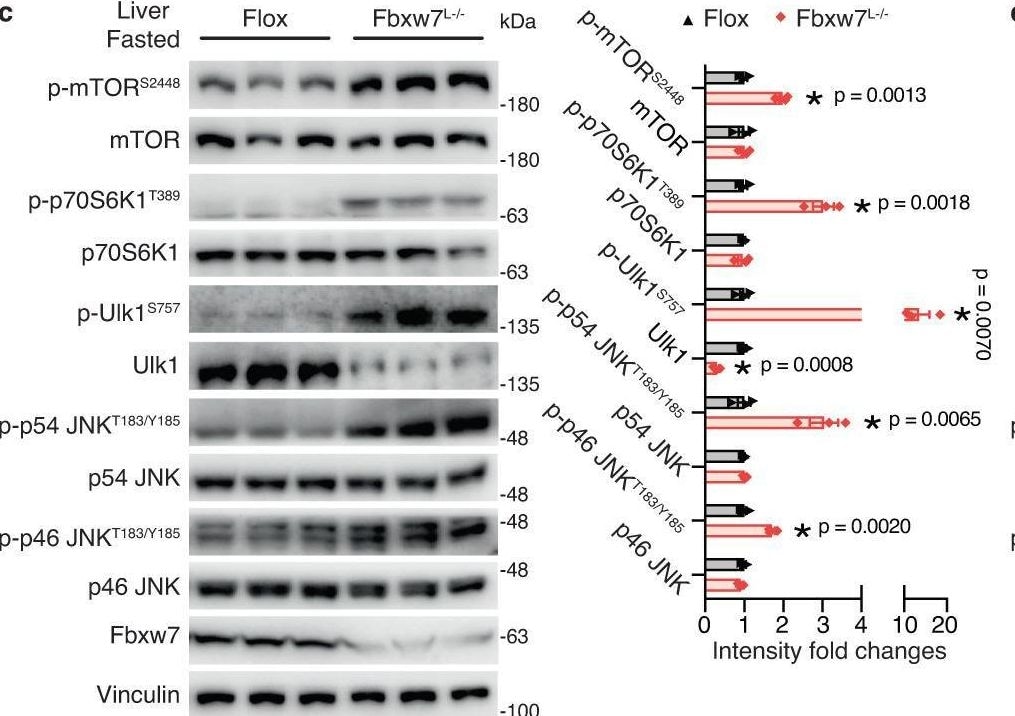
Detection of gvcvwhsw6d1cnxtclnyh.jpg by Western Blot
Metabolic stress aggravates NASH in the absence of Fbxw7.a Heatmap showing mRNA fold changes of NASH-related genes in the fed, fasted and keto diet nutritional regimens, assessed by RT-qPCR, n = 5-6 (see Source data file for specific sample numbers). b Representative images of H&E and Masson’s trichrome (MTC) stained liver tissue sections from Flox and Fbxw7L−/− mice under different nutritional regimens. Arrowhead, fibrotic area (blue). Images are representative of n = 3 mice per group. Immunoblots and quantification of the indicated proteins from Flox and Fbxw7L−/− mice upon fasting (c) or post a 20-day keto diet (d). Each lane represents one mouse, n = 3. e HepG2 cells stably expressing empty vector or FBXW7 were treated with 500 nM Thapsigargin (Tg) or DMSO for 24 h followed by immunoblot examination. Immunoblots are from one experiment representative of 3 independent experiments with similar results. f Overlap of liver-enriched secreted factors with hepatic DEGs (p < 0.05, |FC|>1.30) induced by Fbxw7 deficiency, by fasting, or by a keto diet. g Ranking of the secreted factors identified in Fig. 7f by the sum of absolute mRNA fold changes of the four transcriptome datasets. h, i Hepatic mRNA expression of Apoa4, Apcs and Igfbp1 from Flox and Fbxw7L−/− mice upon fasting (h, n = 5) or post a 20-day keto diet (i, n = 6 for Flox and n = 5 for Fbxw7L−/− mice). Immunoblots and quantification of serum and liver levels of the hepatic secreted factors from Flox and Fbxw7L−/− mice upon fasting (j) or post a 20-day keto diet (k). Each lane represents one mouse, n = 3. Data are represented as means ± SEM (c, d, h–k). *p < 0.05, unpaired two-tailed Student’s t test (a, c, d, h–k). Source data are provided as a Source Data file including Fig. 7a p-values. Image collected and cropped by CiteAb from the following open publication (https://pubmed.ncbi.nlm.nih.gov/37914694), licensed under a CC-BY license. Not internally tested by R&D Systems.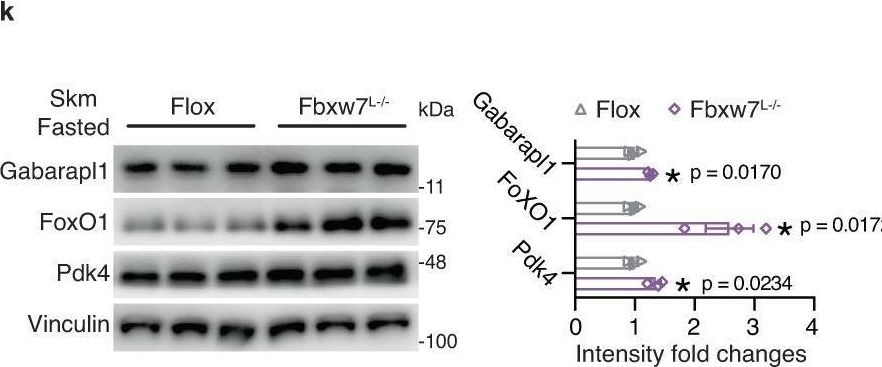
Detection of gvwkz0bvrq90q53w4i7u.jpg by Western Blot
Fbxw7L−/− mice adapt poorly to starvation.a Illustration of hepatic energy metabolism. b mRNA expression of TCA cycle and OXPHOS genes in control and Fbxw7-null livers, n = 5. c Immunoblots and quantification of OXPHOS subunits. Each lane represents one mouse, n = 3. d Relative hepatic ATP abundance, n = 6. Gross liver morphology (e) and liver weights (f) of fed and fasted Flox and Fbxw7L−/− mice. n = 7 for fed, n = 8 for fasted Flox and n = 7 for fasted Fbxw7L−/− mice. g Liver L-amino acid contents of fasted Flox and Fbxw7L−/− mice, n = 7. h Immunoblots and quantification of proteins involved in hepatic fat degradation and autophagy from Flox and Fbxw7L−/− mice in the fed and fasted states. Each lane represents one mouse, n = 3. i Body weight and tissue weights of fasted Flox and Fbxw7L−/− mice. See Source data file for sample numbers. mRNA (j, n = 5 for Flox and n = 6 for Fbxw7L−/− mice) and protein levels (k, each lane represents sample from one mouse, n = 3) of the indicated genes in Skm of fasted Flox and Fbxw7L−/− mice. Immunoblot quantification shown on the right panel (k). l Serum L-amino acids concentrations of Flox and Fbxw7L−/− mice in the fed and fasted states, n = 8. m Representative hematoxylin and eosin (H&E)-stained eWAT from fasted Flox and Fbxw7L−/− mice. Scale bars, 50 μm. See Supplementary Fig. 5f for quantification of eWAT size. n Serum FFA concentrations, n = 6. mRNA (o, n = 4 for Flox mice and n = 5 for Fbxw7L−/− mice) and protein levels (p, each lane represents sample from one mouse, n = 3) of the indicated genes in eWAT from fasted Flox and Fbxw7L−/− mice. Immunoblot quantification shown on the right panel (p). Data are presented as means ± SEM, *p < 0.05, unpaired two-tailed Student’s t test (b–d, f–l, n–p). Source data are provided as a Source Data file. Image collected and cropped by CiteAb from the following open publication (https://pubmed.ncbi.nlm.nih.gov/37914694), licensed under a CC-BY license. Not internally tested by R&D Systems.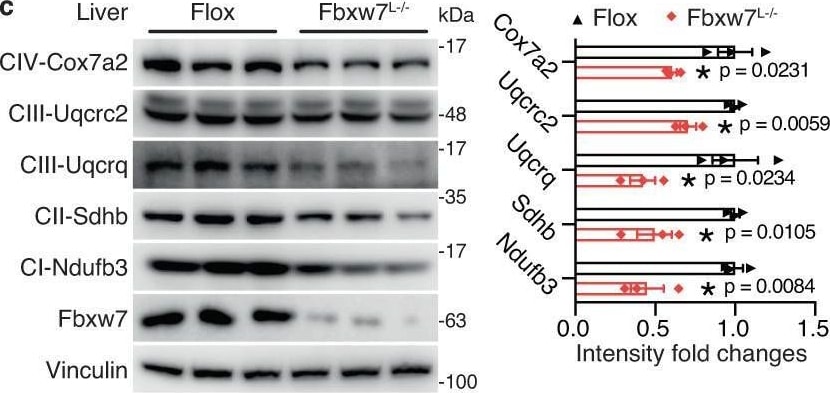
Detection of jrmf6dnfxb6gqxwd3az9.jpg by Western Blot
Fbxw7L−/− mice adapt poorly to starvation.a Illustration of hepatic energy metabolism. b mRNA expression of TCA cycle and OXPHOS genes in control and Fbxw7-null livers, n = 5. c Immunoblots and quantification of OXPHOS subunits. Each lane represents one mouse, n = 3. d Relative hepatic ATP abundance, n = 6. Gross liver morphology (e) and liver weights (f) of fed and fasted Flox and Fbxw7L−/− mice. n = 7 for fed, n = 8 for fasted Flox and n = 7 for fasted Fbxw7L−/− mice. g Liver L-amino acid contents of fasted Flox and Fbxw7L−/− mice, n = 7. h Immunoblots and quantification of proteins involved in hepatic fat degradation and autophagy from Flox and Fbxw7L−/− mice in the fed and fasted states. Each lane represents one mouse, n = 3. i Body weight and tissue weights of fasted Flox and Fbxw7L−/− mice. See Source data file for sample numbers. mRNA (j, n = 5 for Flox and n = 6 for Fbxw7L−/− mice) and protein levels (k, each lane represents sample from one mouse, n = 3) of the indicated genes in Skm of fasted Flox and Fbxw7L−/− mice. Immunoblot quantification shown on the right panel (k). l Serum L-amino acids concentrations of Flox and Fbxw7L−/− mice in the fed and fasted states, n = 8. m Representative hematoxylin and eosin (H&E)-stained eWAT from fasted Flox and Fbxw7L−/− mice. Scale bars, 50 μm. See Supplementary Fig. 5f for quantification of eWAT size. n Serum FFA concentrations, n = 6. mRNA (o, n = 4 for Flox mice and n = 5 for Fbxw7L−/− mice) and protein levels (p, each lane represents sample from one mouse, n = 3) of the indicated genes in eWAT from fasted Flox and Fbxw7L−/− mice. Immunoblot quantification shown on the right panel (p). Data are presented as means ± SEM, *p < 0.05, unpaired two-tailed Student’s t test (b–d, f–l, n–p). Source data are provided as a Source Data file. Image collected and cropped by CiteAb from the following open publication (https://pubmed.ncbi.nlm.nih.gov/37914694), licensed under a CC-BY license. Not internally tested by R&D Systems.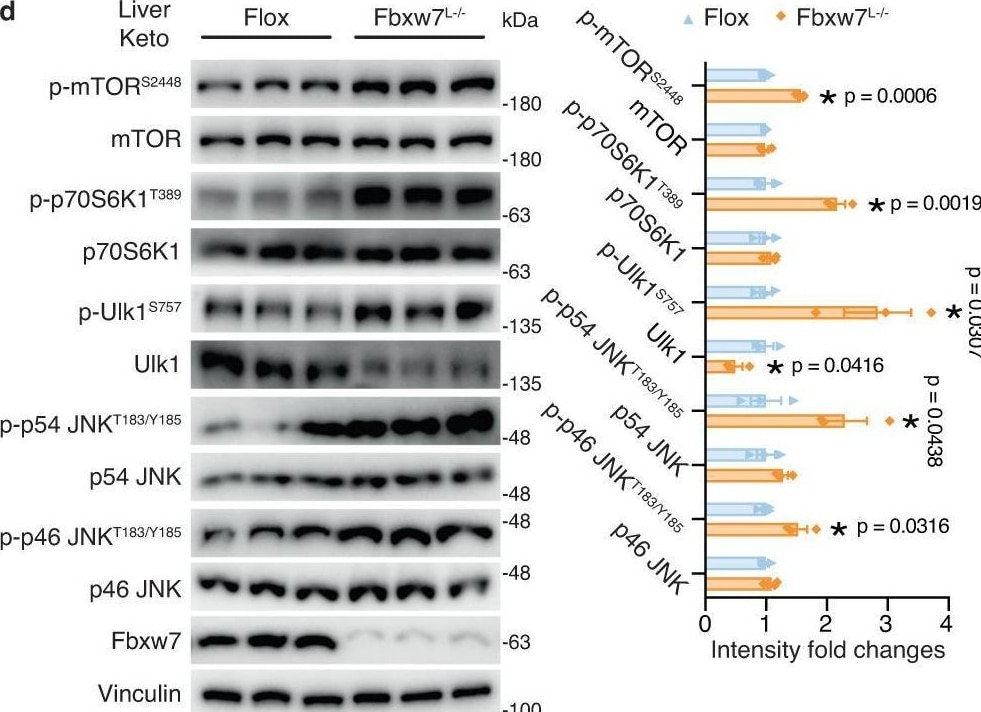
Detection of FBXW7/Cdc4 by Western Blot
Metabolic stress aggravates NASH in the absence of Fbxw7.a Heatmap showing mRNA fold changes of NASH-related genes in the fed, fasted and keto diet nutritional regimens, assessed by RT-qPCR, n = 5-6 (see Source data file for specific sample numbers). b Representative images of H&E and Masson’s trichrome (MTC) stained liver tissue sections from Flox and Fbxw7L−/− mice under different nutritional regimens. Arrowhead, fibrotic area (blue). Images are representative of n = 3 mice per group. Immunoblots and quantification of the indicated proteins from Flox and Fbxw7L−/− mice upon fasting (c) or post a 20-day keto diet (d). Each lane represents one mouse, n = 3. e HepG2 cells stably expressing empty vector or FBXW7 were treated with 500 nM Thapsigargin (Tg) or DMSO for 24 h followed by immunoblot examination. Immunoblots are from one experiment representative of 3 independent experiments with similar results. f Overlap of liver-enriched secreted factors with hepatic DEGs (p < 0.05, |FC|>1.30) induced by Fbxw7 deficiency, by fasting, or by a keto diet. g Ranking of the secreted factors identified in Fig. 7f by the sum of absolute mRNA fold changes of the four transcriptome datasets. h, i Hepatic mRNA expression of Apoa4, Apcs and Igfbp1 from Flox and Fbxw7L−/− mice upon fasting (h, n = 5) or post a 20-day keto diet (i, n = 6 for Flox and n = 5 for Fbxw7L−/− mice). Immunoblots and quantification of serum and liver levels of the hepatic secreted factors from Flox and Fbxw7L−/− mice upon fasting (j) or post a 20-day keto diet (k). Each lane represents one mouse, n = 3. Data are represented as means ± SEM (c, d, h–k). *p < 0.05, unpaired two-tailed Student’s t test (a, c, d, h–k). Source data are provided as a Source Data file including Fig. 7a p-values. Image collected and cropped by CiteAb from the following open publication (https://pubmed.ncbi.nlm.nih.gov/37914694), licensed under a CC-BY license. Not internally tested by R&D Systems.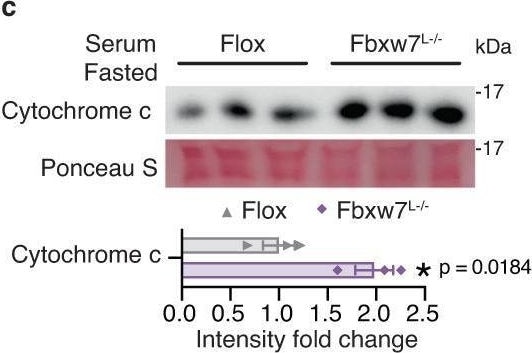
Detection of FBXW7/Cdc4 by Western Blot
Fbxw7-null livers exhibit mitochondrial dysfunction and autophagy deficiency.a GO cellular component analysis of downregulated DEGs (p < 0.05, |FC| > 1.30) in Fbxw7-null livers. Top enriched terms are shown. The number of genes in each category are shown in parentheses. b Relative amounts of mitochondrial DNA (mtDNA), normalized to nuclear DNA (nDNA) in control and Fbxw7-null livers (n = 6). c Immunoblots and quantification of serum Cytochrome c levels of Flox and Fbxw7L−/− littermates. Each lane represents one mouse, n = 3. d Immunoblots and quantification of hepatic Caspase-9 and cleaved Caspase-9. Each lane represents one mouse, n = 3. L.E. Low Exposure, H.E. High Exposure. e mRNA expression of autophagy and lysosome-related genes in control and Fbxw7-null livers, n = 5. f Immunoblots and quantification of key autophagy components. Each lane represents one mouse, n = 3. g mRNA expression of mitophagy genes in control and Fbxw7-null livers, n = 5. Immunoblots and quantification of key mitophagy components (h) and proteins mediating mitochondrial fission and fusion (i). Each lane represents one mouse, n = 3. j, k Fbxw7 Flox mice were injected with adenovirus expressing GFP or Cre recombinase and livers were collected and subjected to RT-qPCR (j, n = 7) and immunoblot (k, n = 3) analysis of autophagy and mitophagy genes. Each lane represents one mouse. Immunoblot quantification results are shown on the right panel (k). Data are presented as means ± SEM, *p < 0.05, unpaired two-tailed Student’s t test (b, c, e–k). Source data are provided as a Source Data file. Image collected and cropped by CiteAb from the following open publication (https://pubmed.ncbi.nlm.nih.gov/37914694), licensed under a CC-BY license. Not internally tested by R&D Systems.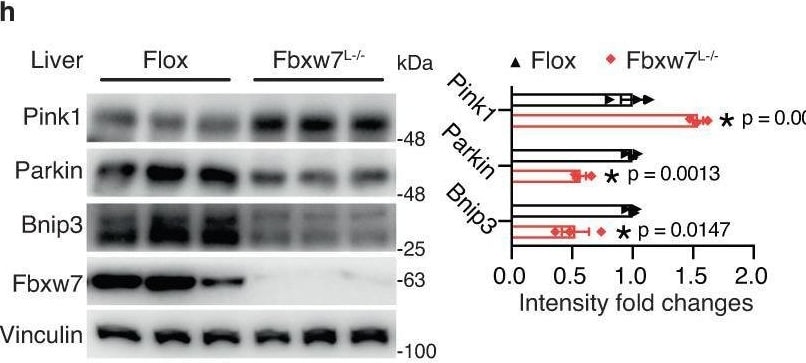
Detection of FBXW7/Cdc4 by Western Blot
Fbxw7-null livers exhibit mitochondrial dysfunction and autophagy deficiency.a GO cellular component analysis of downregulated DEGs (p < 0.05, |FC| > 1.30) in Fbxw7-null livers. Top enriched terms are shown. The number of genes in each category are shown in parentheses. b Relative amounts of mitochondrial DNA (mtDNA), normalized to nuclear DNA (nDNA) in control and Fbxw7-null livers (n = 6). c Immunoblots and quantification of serum Cytochrome c levels of Flox and Fbxw7L−/− littermates. Each lane represents one mouse, n = 3. d Immunoblots and quantification of hepatic Caspase-9 and cleaved Caspase-9. Each lane represents one mouse, n = 3. L.E. Low Exposure, H.E. High Exposure. e mRNA expression of autophagy and lysosome-related genes in control and Fbxw7-null livers, n = 5. f Immunoblots and quantification of key autophagy components. Each lane represents one mouse, n = 3. g mRNA expression of mitophagy genes in control and Fbxw7-null livers, n = 5. Immunoblots and quantification of key mitophagy components (h) and proteins mediating mitochondrial fission and fusion (i). Each lane represents one mouse, n = 3. j, k Fbxw7 Flox mice were injected with adenovirus expressing GFP or Cre recombinase and livers were collected and subjected to RT-qPCR (j, n = 7) and immunoblot (k, n = 3) analysis of autophagy and mitophagy genes. Each lane represents one mouse. Immunoblot quantification results are shown on the right panel (k). Data are presented as means ± SEM, *p < 0.05, unpaired two-tailed Student’s t test (b, c, e–k). Source data are provided as a Source Data file. Image collected and cropped by CiteAb from the following open publication (https://pubmed.ncbi.nlm.nih.gov/37914694), licensed under a CC-BY license. Not internally tested by R&D Systems.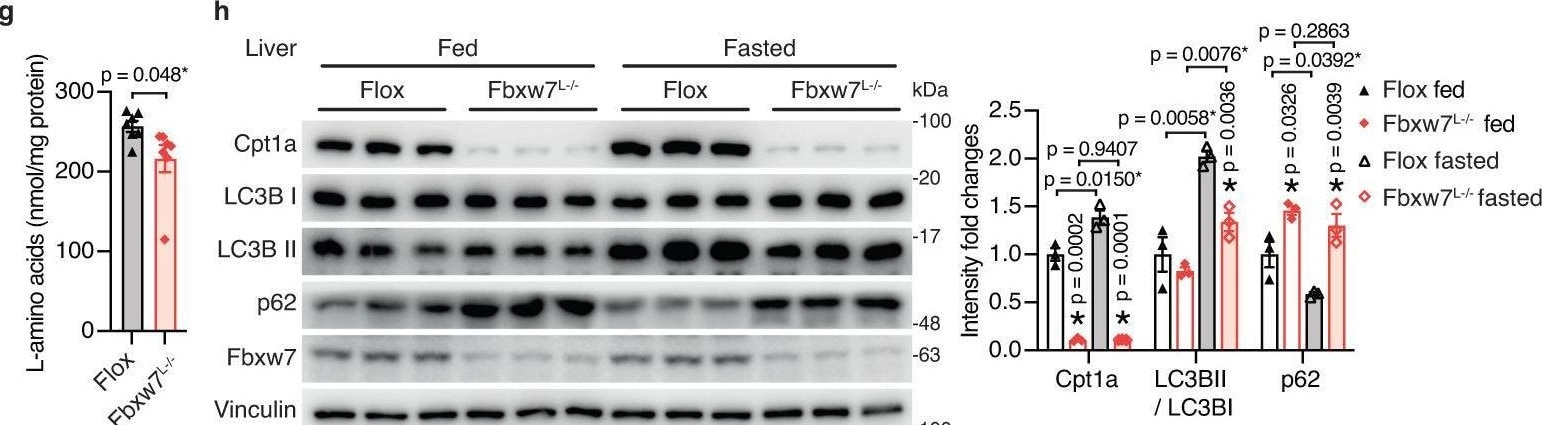
Detection of FBXW7/Cdc4 by Western Blot
Fbxw7L−/− mice adapt poorly to starvation.a Illustration of hepatic energy metabolism. b mRNA expression of TCA cycle and OXPHOS genes in control and Fbxw7-null livers, n = 5. c Immunoblots and quantification of OXPHOS subunits. Each lane represents one mouse, n = 3. d Relative hepatic ATP abundance, n = 6. Gross liver morphology (e) and liver weights (f) of fed and fasted Flox and Fbxw7L−/− mice. n = 7 for fed, n = 8 for fasted Flox and n = 7 for fasted Fbxw7L−/− mice. g Liver L-amino acid contents of fasted Flox and Fbxw7L−/− mice, n = 7. h Immunoblots and quantification of proteins involved in hepatic fat degradation and autophagy from Flox and Fbxw7L−/− mice in the fed and fasted states. Each lane represents one mouse, n = 3. i Body weight and tissue weights of fasted Flox and Fbxw7L−/− mice. See Source data file for sample numbers. mRNA (j, n = 5 for Flox and n = 6 for Fbxw7L−/− mice) and protein levels (k, each lane represents sample from one mouse, n = 3) of the indicated genes in Skm of fasted Flox and Fbxw7L−/− mice. Immunoblot quantification shown on the right panel (k). l Serum L-amino acids concentrations of Flox and Fbxw7L−/− mice in the fed and fasted states, n = 8. m Representative hematoxylin and eosin (H&E)-stained eWAT from fasted Flox and Fbxw7L−/− mice. Scale bars, 50 μm. See Supplementary Fig. 5f for quantification of eWAT size. n Serum FFA concentrations, n = 6. mRNA (o, n = 4 for Flox mice and n = 5 for Fbxw7L−/− mice) and protein levels (p, each lane represents sample from one mouse, n = 3) of the indicated genes in eWAT from fasted Flox and Fbxw7L−/− mice. Immunoblot quantification shown on the right panel (p). Data are presented as means ± SEM, *p < 0.05, unpaired two-tailed Student’s t test (b–d, f–l, n–p). Source data are provided as a Source Data file. Image collected and cropped by CiteAb from the following open publication (https://pubmed.ncbi.nlm.nih.gov/37914694), licensed under a CC-BY license. Not internally tested by R&D Systems.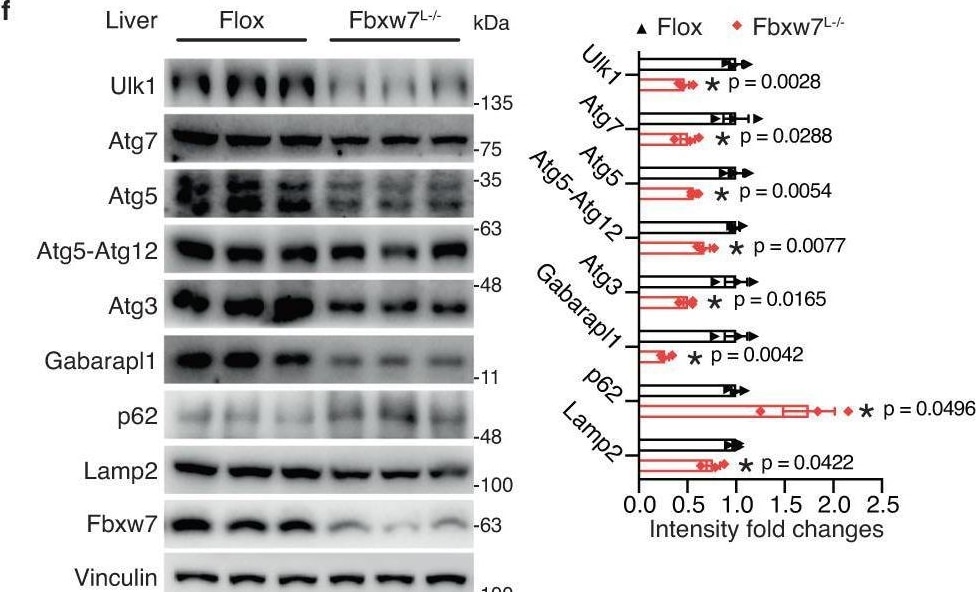
Detection of FBXW7/Cdc4 by Western Blot
Fbxw7-null livers exhibit mitochondrial dysfunction and autophagy deficiency.a GO cellular component analysis of downregulated DEGs (p < 0.05, |FC| > 1.30) in Fbxw7-null livers. Top enriched terms are shown. The number of genes in each category are shown in parentheses. b Relative amounts of mitochondrial DNA (mtDNA), normalized to nuclear DNA (nDNA) in control and Fbxw7-null livers (n = 6). c Immunoblots and quantification of serum Cytochrome c levels of Flox and Fbxw7L−/− littermates. Each lane represents one mouse, n = 3. d Immunoblots and quantification of hepatic Caspase-9 and cleaved Caspase-9. Each lane represents one mouse, n = 3. L.E. Low Exposure, H.E. High Exposure. e mRNA expression of autophagy and lysosome-related genes in control and Fbxw7-null livers, n = 5. f Immunoblots and quantification of key autophagy components. Each lane represents one mouse, n = 3. g mRNA expression of mitophagy genes in control and Fbxw7-null livers, n = 5. Immunoblots and quantification of key mitophagy components (h) and proteins mediating mitochondrial fission and fusion (i). Each lane represents one mouse, n = 3. j, k Fbxw7 Flox mice were injected with adenovirus expressing GFP or Cre recombinase and livers were collected and subjected to RT-qPCR (j, n = 7) and immunoblot (k, n = 3) analysis of autophagy and mitophagy genes. Each lane represents one mouse. Immunoblot quantification results are shown on the right panel (k). Data are presented as means ± SEM, *p < 0.05, unpaired two-tailed Student’s t test (b, c, e–k). Source data are provided as a Source Data file. Image collected and cropped by CiteAb from the following open publication (https://pubmed.ncbi.nlm.nih.gov/37914694), licensed under a CC-BY license. Not internally tested by R&D Systems.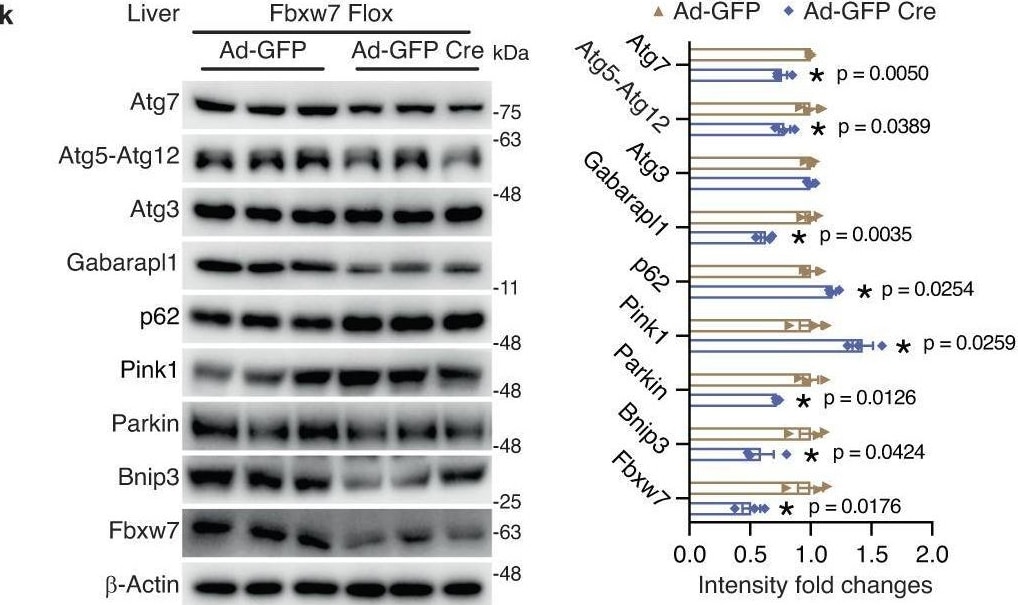
Detection of FBXW7/Cdc4 by Western Blot
Fbxw7-null livers exhibit mitochondrial dysfunction and autophagy deficiency.a GO cellular component analysis of downregulated DEGs (p < 0.05, |FC| > 1.30) in Fbxw7-null livers. Top enriched terms are shown. The number of genes in each category are shown in parentheses. b Relative amounts of mitochondrial DNA (mtDNA), normalized to nuclear DNA (nDNA) in control and Fbxw7-null livers (n = 6). c Immunoblots and quantification of serum Cytochrome c levels of Flox and Fbxw7L−/− littermates. Each lane represents one mouse, n = 3. d Immunoblots and quantification of hepatic Caspase-9 and cleaved Caspase-9. Each lane represents one mouse, n = 3. L.E. Low Exposure, H.E. High Exposure. e mRNA expression of autophagy and lysosome-related genes in control and Fbxw7-null livers, n = 5. f Immunoblots and quantification of key autophagy components. Each lane represents one mouse, n = 3. g mRNA expression of mitophagy genes in control and Fbxw7-null livers, n = 5. Immunoblots and quantification of key mitophagy components (h) and proteins mediating mitochondrial fission and fusion (i). Each lane represents one mouse, n = 3. j, k Fbxw7 Flox mice were injected with adenovirus expressing GFP or Cre recombinase and livers were collected and subjected to RT-qPCR (j, n = 7) and immunoblot (k, n = 3) analysis of autophagy and mitophagy genes. Each lane represents one mouse. Immunoblot quantification results are shown on the right panel (k). Data are presented as means ± SEM, *p < 0.05, unpaired two-tailed Student’s t test (b, c, e–k). Source data are provided as a Source Data file. Image collected and cropped by CiteAb from the following open publication (https://pubmed.ncbi.nlm.nih.gov/37914694), licensed under a CC-BY license. Not internally tested by R&D Systems.Applications for Human FBXW7/Cdc4 Antibody (800201)
Western Blot
Sample: Jurkat human acute T cell leukemia cell line
Reviewed Applications
Read 3 reviews rated 4 using MAB7776 in the following applications:
Formulation, Preparation, and Storage
Purification
Reconstitution
Sterile PBS to a final concentration of 0.5 mg/mL. For liquid material, refer to CoA for concentration.
Formulation
Shipping
Stability & Storage
- 12 months from date of receipt, -20 to -70 °C as supplied.
- 1 month, 2 to 8 °C under sterile conditions after reconstitution.
- 6 months, -20 to -70 °C under sterile conditions after reconstitution.
Calculators
Background: FBXW7/Cdc4
Long Name
Alternate Names
Gene Symbol
UniProt
Additional FBXW7/Cdc4 Products
Product Documents for Human FBXW7/Cdc4 Antibody (800201)
Certificate of Analysis
To download a Certificate of Analysis, please enter a lot or batch number in the search box below.
Note: Certificate of Analysis not available for kit components.
Product Specific Notices for Human FBXW7/Cdc4 Antibody (800201)
For research use only
Related Research Areas
Citations for Human FBXW7/Cdc4 Antibody (800201)
 Powered by Bioz
Customer Reviews for Human FBXW7/Cdc4 Antibody (800201) (3)
Have you used Human FBXW7/Cdc4 Antibody (800201)?
Submit a review and receive an Amazon gift card!
$25/€18/£15/$25CAN/¥2500 for a review with an image
$10/€7/£6/$10CAN/¥1110 for a review without an image
Submit a review
-
Application: Western BlotSample Tested: HeLa cells and Blood mononuclear cells (PBMCs)Species: HumanVerified Customer | Posted 09/10/2018
-
Application: Immunocytochemistry/ImmunofluorescenceSample Tested: THP-1 human acute monocytic leukemia cell line and HeLa cellsSpecies: HumanVerified Customer | Posted 09/10/2018
-
Application: Western BlotSample Tested: THP-1 human acute monocytic leukemia cell line and HeLa cellsSpecies: HumanVerified Customer | Posted 08/21/2018
There are no reviews that match your criteria.
Protocols
Find general support by application which include: protocols, troubleshooting, illustrated assays, videos and webinars.
- Cellular Response to Hypoxia Protocols
- R&D Systems Quality Control Western Blot Protocol
- Troubleshooting Guide: Western Blot Figures
- Western Blot Conditions
- Western Blot Protocol
- Western Blot Protocol for Cell Lysates
- Western Blot Troubleshooting
- Western Blot Troubleshooting Guide
- View all Protocols, Troubleshooting, Illustrated assays and Webinars
Associated Pathways
