Cathepsin L is a lysosomal cysteine protease expressed in most eukaryotic cells. Cathepsin L is known to hydrolyze a number of proteins, including the proform of urokinase-type plasminogen activator, which is activated by Cathepsin L cleavage (1). Cathepsin L has also been shown to proteolytically inactivate alpha 1-antitrypsin and secretory leucoprotease inhibitor, two major protease inhibitors of the respiratory tract (2). These observations, combined with the demonstration of increased Cathepsin L activity in the epithelial lining fluid of the lungs of emphysema patients, have led to the suggestion that the enzyme may be involved in the progression of this disease. Cathepsin L has also been identified as a major excreted protein of transformed fibroblasts, indicating the enzyme could be involved in malignant tumor growth (3). In Cathepsin L-deficient mice, it appears to play a critical role in cardiac morphology and function, epidermal homeostasis, regulation of the hair cycle, and MHC class II-mediated antigen presentation in cortical epithelial cells of the thymus (4, 5). Mouse Cathepsin L is synthesized as a 334 amino acid precursor with a signal peptide (residues 1-17), a pro region (residues 18-113), and a mature chain (residues 114-334).

Key Product Details
Validated by
Knockout/Knockdown, Biological Validation
Species Reactivity
Validated:
Mouse, Rat
Cited:
Human, Mouse, Transgenic Mouse
Applications
Validated:
Immunohistochemistry, Western Blot, Simple Western
Cited:
Immunohistochemistry, Immunohistochemistry-Paraffin, Immunohistochemistry-Frozen, Western Blot, Immunocytochemistry, Immunoprecipitation, Western Blots
Label
Unconjugated
Antibody Source
Polyclonal Goat IgG
Loading...
Product Specifications
Immunogen
Mouse myeloma cell line NS0-derived recombinant mouse Cathepsin L
Thr18-Asn334
Accession # P06797
Thr18-Asn334
Accession # P06797
Specificity
Detects mouse Cathepsin L in direct ELISAs and Western blots.
Clonality
Polyclonal
Host
Goat
Isotype
IgG
Scientific Data Images for Cathepsin L Antibody
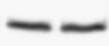
Detection of Mouse and Rat Cathepsin L by Western Blot.
Western blot shows lysates of rat liver tissue, mouse liver tissue (wild type), and mouse liver tissue (knock out). PVDF membrane was probed with 1 µg/mL of Goat Anti-Mouse Cathepsin L Antigen Affinity-purified Polyclonal Antibody (Catalog # AF1515) followed by HRP-conjugated Anti-Goat IgG Secondary Antibody (HAF017). Specific bands were detected for Cathepsin L at approximately 22-38 kDa (as indicated). This experiment was conducted under reducing conditions and using Immunoblot Buffer Group 1.
Cathepsin L in Mouse Ovary.
Cathepsin L was detected in perfusion fixed frozen sections of mouse ovary using 15 µg/mL Goat Anti-Mouse Cathepsin L Antigen Affinity-purified Polyclonal Antibody (Catalog # AF1515) overnight at 4 °C. Tissue was stained with the Anti-Goat HRP-DAB Cell & Tissue Staining Kit (brown; CTS008) and counterstained with hematoxylin (blue). View our protocol for Chromogenic IHC Staining of Frozen Tissue Sections.
Detection of Mouse Cathepsin L by Simple WesternTM.
Simple Western lane view shows lysates of mouse liver tissue and HepG2 human hepatocellular carcinoma cell line, loaded at 0.2 mg/mL. Specific bands were detected for Cathepsin L at approximately 51 and 34 kDa (as indicated) using 10 µg/mL of Goat Anti-Mouse Cathepsin L Antigen Affinity-purified Polyclonal Antibody (Catalog # AF1515) followed by 1:50 dilution of HRP-conjugated Anti-Goat IgG Secondary Antibody (HAF109). This experiment was conducted under reducing conditions and using the 12-230 kDa separation system.
Cathepsin L in Mouse Thymus.
Cathepsin L was detected in perfusion fixed frozen sections of mouse thymus using 15 µg/mL Goat Anti-Mouse Cathepsin L Antigen Affinity-purified Polyclonal Antibody (Catalog # AF1515) overnight at 4 °C. Tissue was stained with the Anti-Goat HRP-DAB Cell & Tissue Staining Kit (brown; CTS008) and counterstained with hematoxylin (blue). View our protocol for Chromogenic IHC Staining of Frozen Tissue Sections.
Detection of Mouse Cathepsin L by Immunocytochemistry/ Immunofluorescence
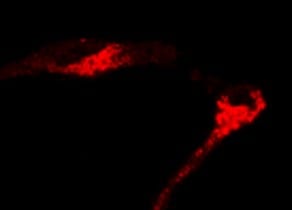
Myc induces cathepsin L expression in beta-cells of pancreatic Islets.(A) Immunohistochemical analyses for CTS B, C, L or S expression (all in red) in combination with staining for the pan-leukocyte marker CD45 (green) in pancreatic islet tumors from the MycERTAM;Bcl-xL animals. Pancreata were harvested from the MycERTAM;Bcl-xL mice treated for 7 d with TAM (Myc-On, 7 days) or control vehicle in place of TAM (Myc-OFF). The islet area is indicated by dotted line. The asterisks indicate the area of tumor represented in the insets. The panels are representatives of at least three animals assayed at each data point, all immunohistochemical analyses were done in duplicate; eight randomized fields per analysis were examined. Scale bars, 100μm. (B) Immunohistochemical analysis for cathepsin L expression in beta-cells of pancreatic islets from MycERTAM;Bcl-xL animals identified by insulin expression. Pancreata were collected from the animals described above. Scale bars represent 25μm. The panels are representatives of three animals assayed at each data point, all immunohistochemical analyses were done in duplicate; ten randomized fields per analysis were examined. Image collected and cropped by CiteAb from the following open publication (https://dx.plos.org/10.1371/journal.pone.0120348), licensed under a CC-BY license. Not internally tested by R&D Systems.
Detection of Mouse Cathepsin L by Immunocytochemistry/ Immunofluorescence
Myc induces cathepsin L expression in beta-cells of pancreatic Islets.(A) Immunohistochemical analyses for CTS B, C, L or S expression (all in red) in combination with staining for the pan-leukocyte marker CD45 (green) in pancreatic islet tumors from the MycERTAM;Bcl-xL animals. Pancreata were harvested from the MycERTAM;Bcl-xL mice treated for 7 d with TAM (Myc-On, 7 days) or control vehicle in place of TAM (Myc-OFF). The islet area is indicated by dotted line. The asterisks indicate the area of tumor represented in the insets. The panels are representatives of at least three animals assayed at each data point, all immunohistochemical analyses were done in duplicate; eight randomized fields per analysis were examined. Scale bars, 100μm. (B) Immunohistochemical analysis for cathepsin L expression in beta-cells of pancreatic islets from MycERTAM;Bcl-xL animals identified by insulin expression. Pancreata were collected from the animals described above. Scale bars represent 25μm. The panels are representatives of three animals assayed at each data point, all immunohistochemical analyses were done in duplicate; ten randomized fields per analysis were examined. Image collected and cropped by CiteAb from the following open publication (https://dx.plos.org/10.1371/journal.pone.0120348), licensed under a CC-BY license. Not internally tested by R&D Systems.
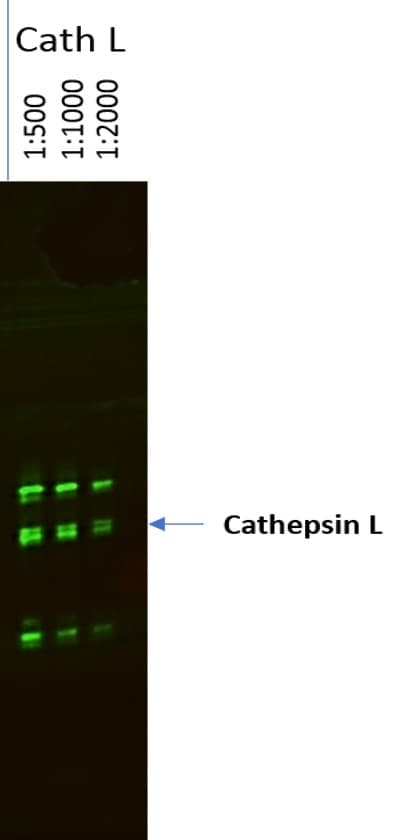
Detection of Cathepsin L by Western Blot
Acute, first window RIC activates autophagy signaling via p-AMPK upregulation and concomitant downregulation of mTOR.(A) Western blots for autophagy related signaling proteins. (B) Quantification of the protein fold change in 1W RIC compared to 1W controls. Values are means ± S.E.M. n = 6–8 per group. An (*) denotes a statistically significant difference (P<0.05) compared to control. (P-: phospho-). Image collected and cropped by CiteAb from the following open publication (https://pubmed.ncbi.nlm.nih.gov/25347774), licensed under a CC-BY license. Not internally tested by R&D Systems.
Detection of Cathepsin L by Western Blot
Chronic, third window RIC increases the expression of autophagosome proteins, LC3I/II and Atg5.(A) Western blots for autophagy related signaling proteins. (B) Quantification of the protein fold change in 3W RIC compared to 3W controls. Values are means ± S.E.M. n = 6–8 per group. An (*) denotes a statistically significant difference (P<0.05) compared to control. (P-: phospho-). Image collected and cropped by CiteAb from the following open publication (https://pubmed.ncbi.nlm.nih.gov/25347774), licensed under a CC-BY license. Not internally tested by R&D Systems.
Detection of Cathepsin L by Western Blot
Inhibition of CTSV induces cellular senescence. (A) HUVECs were treated with si-negative control (NC), si-CTSV, si-ALDH1A2 or si-CTSV + si-ALDH1A2 for 24 h and simulated with 100 nM doxorubicin (DOX) for 24 h after incubated in complete growth medium for 24 h. SA-beta -gal activity was analyzed (blue staining for the senescent cells, scale bar = 50 μm, n = 4). (B) EdU assay of the cell proliferation ability in HUVECs treated with DOX, si-CTSV and si-ALDH1A2 (red staining for the EdU, blue staining for Hoechst, scale bar = 25 μm, n = 4). (C) Representative image of the wound healing assay and the quantification of wound area in HUVECs (scale bar = 100 μm, n = 4). (D) Western blot of CTSV, ALDH1A2, P21, p-ERK1/2, ERK1/2, p-AKT, AKT, CTSL, P53 and P16 in HUVECs treated with DOX and siRNAs (n = 4). (E) Relative mRNA level of CTSV, ALDH1A2, P21, IL-1 beta, IL-6 and ICAM-1 (n = 4). (F) RA concentration in HUVECs treated with DOX and siRNAs (n = 4). Data are presented as mean ± SEM. One-way ANOVA test was used. * p < 0.05, ** p < 0.01, *** p < 0.001. Image collected and cropped by CiteAb from the following open publication (https://pubmed.ncbi.nlm.nih.gov/36671735), licensed under a CC-BY license. Not internally tested by R&D Systems.
Detection of Cathepsin L by Immunohistochemistry
Ctsl expression is decreased in senescent aorta. (A) Representative images of hematoxylin-eosin staining in the thoracic aortas of aged (18-month-old) and young (8-week-old) mice (scale bar = 200 μm in top and 50 μm in bottom, respectively). (B) Representative images of Masson’s trichrome stain in the thoracic aortas (blue-gray staining for the collagens, scale bar = 200 μm in top and 50 μm in bottom, respectively). (C) Quantification of media thickness (MT), the ratio of media thickness to lumen diameter (MT/LD), media area (MA), and the ratio of collagen to media area (collagen/MA) using hematoxylin-eosin staining and Masson’s trichrome stain (n = 4). (D). Immunohistochemistry of Ctsl in the thoracic aortas of aged and young mice (brown staining for Ctsl, scale bar = 50 μm, n = 4). (E) Western Blot of Ctsl and p21 in young and senescent aortas (n = 3–4). Data were presented as mean ± SEM. T-test was used. * p < 0.05 vs. young, ** p < 0.01 vs. young, *** p < 0.001 vs. young. Image collected and cropped by CiteAb from the following open publication (https://pubmed.ncbi.nlm.nih.gov/36671735), licensed under a CC-BY license. Not internally tested by R&D Systems.
Detection of Cathepsin L by Western Blot
CTSV attenuates DOX-induced cellular senescence. (A). HUVECs were treated with ad-negative control (NC) or ad-CTSV (MOI = 10) for 8 h and simulated with 100 nM doxorubicin (DOX) and 1 μM RA for 24 h after incubated in complete growth medium for 40 h. SA-beta -gal activity was analyzed (blue staining for the senescent cells, scale bar = 50 μm, n = 4). (B) EdU assay of the cell proliferation ability in HUVECs treated with DOX, RA and ad-CTSV (red staining for the EdU, blue staining for Hoechst, scale bar = 25 μm, n = 4). (C) Representative image of the wound healing assay and the quantification of wound area in HUVECs (scale bar = 100 μm, n = 4). (D) Western blot of CTSV, ALDH1A2, P21, p-ERK1/2, ERK1/2, p-AKT, AKT, CTSL, P53, and P16 in HUVECs treated with DOX, RA and ad-CTSV (n = 4). (E) Relative mRNA level of CTSV, ALDH1A2, P21, IL-1 beta, IL-6, and ICAM-1 (n = 4). (F) RA concentration in HUVECs treated with DOX, RA, and ad-CTSV (n = 4). Data are presented as mean ± SEM. One-way ANOVA test was used. * p < 0.05, ** p < 0.01, *** p < 0.001. Image collected and cropped by CiteAb from the following open publication (https://pubmed.ncbi.nlm.nih.gov/36671735), licensed under a CC-BY license. Not internally tested by R&D Systems.
Detection of Cathepsin L by Immunohistochemistry
Ctsl expression is decreased in senescent aorta. (A) Representative images of hematoxylin-eosin staining in the thoracic aortas of aged (18-month-old) and young (8-week-old) mice (scale bar = 200 μm in top and 50 μm in bottom, respectively). (B) Representative images of Masson’s trichrome stain in the thoracic aortas (blue-gray staining for the collagens, scale bar = 200 μm in top and 50 μm in bottom, respectively). (C) Quantification of media thickness (MT), the ratio of media thickness to lumen diameter (MT/LD), media area (MA), and the ratio of collagen to media area (collagen/MA) using hematoxylin-eosin staining and Masson’s trichrome stain (n = 4). (D). Immunohistochemistry of Ctsl in the thoracic aortas of aged and young mice (brown staining for Ctsl, scale bar = 50 μm, n = 4). (E) Western Blot of Ctsl and p21 in young and senescent aortas (n = 3–4). Data were presented as mean ± SEM. T-test was used. * p < 0.05 vs. young, ** p < 0.01 vs. young, *** p < 0.001 vs. young. Image collected and cropped by CiteAb from the following open publication (https://pubmed.ncbi.nlm.nih.gov/36671735), licensed under a CC-BY license. Not internally tested by R&D Systems.
Detection of Cathepsin L by Western Blot
Inhibition of CTSV induces cellular senescence. (A) HUVECs were treated with si-negative control (NC), si-CTSV, si-ALDH1A2 or si-CTSV + si-ALDH1A2 for 24 h and simulated with 100 nM doxorubicin (DOX) for 24 h after incubated in complete growth medium for 24 h. SA-beta -gal activity was analyzed (blue staining for the senescent cells, scale bar = 50 μm, n = 4). (B) EdU assay of the cell proliferation ability in HUVECs treated with DOX, si-CTSV and si-ALDH1A2 (red staining for the EdU, blue staining for Hoechst, scale bar = 25 μm, n = 4). (C) Representative image of the wound healing assay and the quantification of wound area in HUVECs (scale bar = 100 μm, n = 4). (D) Western blot of CTSV, ALDH1A2, P21, p-ERK1/2, ERK1/2, p-AKT, AKT, CTSL, P53 and P16 in HUVECs treated with DOX and siRNAs (n = 4). (E) Relative mRNA level of CTSV, ALDH1A2, P21, IL-1 beta, IL-6 and ICAM-1 (n = 4). (F) RA concentration in HUVECs treated with DOX and siRNAs (n = 4). Data are presented as mean ± SEM. One-way ANOVA test was used. * p < 0.05, ** p < 0.01, *** p < 0.001. Image collected and cropped by CiteAb from the following open publication (https://pubmed.ncbi.nlm.nih.gov/36671735), licensed under a CC-BY license. Not internally tested by R&D Systems.
Detection of Cathepsin L by Western Blot
CTSV attenuates DOX-induced cellular senescence. (A). HUVECs were treated with ad-negative control (NC) or ad-CTSV (MOI = 10) for 8 h and simulated with 100 nM doxorubicin (DOX) and 1 μM RA for 24 h after incubated in complete growth medium for 40 h. SA-beta -gal activity was analyzed (blue staining for the senescent cells, scale bar = 50 μm, n = 4). (B) EdU assay of the cell proliferation ability in HUVECs treated with DOX, RA and ad-CTSV (red staining for the EdU, blue staining for Hoechst, scale bar = 25 μm, n = 4). (C) Representative image of the wound healing assay and the quantification of wound area in HUVECs (scale bar = 100 μm, n = 4). (D) Western blot of CTSV, ALDH1A2, P21, p-ERK1/2, ERK1/2, p-AKT, AKT, CTSL, P53, and P16 in HUVECs treated with DOX, RA and ad-CTSV (n = 4). (E) Relative mRNA level of CTSV, ALDH1A2, P21, IL-1 beta, IL-6, and ICAM-1 (n = 4). (F) RA concentration in HUVECs treated with DOX, RA, and ad-CTSV (n = 4). Data are presented as mean ± SEM. One-way ANOVA test was used. * p < 0.05, ** p < 0.01, *** p < 0.001. Image collected and cropped by CiteAb from the following open publication (https://pubmed.ncbi.nlm.nih.gov/36671735), licensed under a CC-BY license. Not internally tested by R&D Systems.Applications for Cathepsin L Antibody
Application
Recommended Usage
Immunohistochemistry
5-15 µg/mL
Sample: Perfusion fixed frozen sections of mouse ovary and thymus
Sample: Perfusion fixed frozen sections of mouse ovary and thymus
Simple Western
10 µg/mL
Sample: Mouse liver tissue and HepG2 human hepatocellular carcinoma cell line
Sample: Mouse liver tissue and HepG2 human hepatocellular carcinoma cell line
Western Blot
1 µg/mL
Sample: Rat liver tissue, mouse liver tissue (wild type), and mouse liver tissue (knock out).
Sample: Rat liver tissue, mouse liver tissue (wild type), and mouse liver tissue (knock out).
Reviewed Applications
Read 3 reviews rated 5 using AF1515 in the following applications:
Formulation, Preparation, and Storage
Purification
Antigen Affinity-purified
Reconstitution
Reconstitute at 0.2 mg/mL in sterile PBS. For liquid material, refer to CoA for concentration.
Loading...
Formulation
Lyophilized from a 0.2 μm filtered solution in PBS with Trehalose. *Small pack size (SP) is supplied either lyophilized or as a 0.2 µm filtered solution in PBS.
Shipping
Lyophilized product is shipped at ambient temperature. Liquid small pack size (-SP) is shipped with polar packs. Upon receipt, store immediately at the temperature recommended below.
Stability & Storage
Use a manual defrost freezer and avoid repeated freeze-thaw cycles.
- 12 months from date of receipt, -20 to -70 °C as supplied.
- 1 month, 2 to 8 °C under sterile conditions after reconstitution.
- 6 months, -20 to -70 °C under sterile conditions after reconstitution.
Calculators
Background: Cathepsin L
References
- Goretzki, L. et al. (1992) FEBS Lett. 297:112.
- Taggart, C.C. et al. (2001) J. Biol. Chem. 276:33345.
- Gottesman, M.M. and F. Cabral (1981) Biochemistry 20:1659.
- Stypmann, J. et al. (2002) Proc. Natl. Acad. Sci. USA 99: 6234.
- Reinheckel, T. et al. (2001) Biol. Chem. 382:735.
Alternate Names
CTSL, CTSL1
Gene Symbol
CTSL
UniProt
Additional Cathepsin L Products
Product Documents for Cathepsin L Antibody
Certificate of Analysis
To download a Certificate of Analysis, please enter a lot or batch number in the search box below.
Note: Certificate of Analysis not available for kit components.
Product Specific Notices for Cathepsin L Antibody
For research use only
Related Research Areas
Citations for Cathepsin L Antibody
 Powered by Bioz
Customer Reviews for Cathepsin L Antibody (3)
5 out of 5
3 Customer Ratings
Have you used Cathepsin L Antibody?
Submit a review and receive an Amazon gift card!
$25/€18/£15/$25CAN/¥2500 Yen for a review with an image
$10/€7/£6/$10CAN/¥1110 Yen for a review without an image
Submit a review
Customer Images
Showing
1
-
3 的
3 reviews
Showing All
Filter By:
-
Application: Immunocytochemistry/ImmunofluorescenceSample Tested: bone marrow macrophageSpecies: MouseVerified Customer | Posted 12/06/2021

-
Application: Western BlotSample Tested: Hepa 1-6 mouse hepatoma cell line and H4-II-E-C3 rat hepatoma cell lineSpecies: Mouse and RatVerified Customer | Posted 10/17/2018
-
Application: Western BlotSample Tested: mouse fecesSpecies: MouseVerified Customer | Posted 05/03/2017Antibody in 1% milk (TBST). Incubation time was 2 hrs @ RT. Detection in mouse feces.
There are no reviews that match your criteria.
Protocols
Find general support by application which include: protocols, troubleshooting, illustrated assays, videos and webinars.
- Antigen Retrieval Protocol (PIER)
- Antigen Retrieval for Frozen Sections Protocol
- Appropriate Fixation of IHC/ICC Samples
- Cellular Response to Hypoxia Protocols
- Chromogenic IHC Staining of Formalin-Fixed Paraffin-Embedded (FFPE) Tissue Protocol
- Chromogenic Immunohistochemistry Staining of Frozen Tissue
- ClariTSA™ Fluorophore Kits
- Detection & Visualization of Antibody Binding
- Fluorescent IHC Staining of Frozen Tissue Protocol
- Graphic Protocol for Heat-induced Epitope Retrieval
- Graphic Protocol for the Preparation and Fluorescent IHC Staining of Frozen Tissue Sections
- Graphic Protocol for the Preparation and Fluorescent IHC Staining of Paraffin-embedded Tissue Sections
- Graphic Protocol for the Preparation of Gelatin-coated Slides for Histological Tissue Sections
- IHC Sample Preparation (Frozen sections vs Paraffin)
- Immunofluorescent IHC Staining of Formalin-Fixed Paraffin-Embedded (FFPE) Tissue Protocol
- Immunohistochemistry (IHC) and Immunocytochemistry (ICC) Protocols
- Immunohistochemistry Frozen Troubleshooting
- Immunohistochemistry Paraffin Troubleshooting
- Preparing Samples for IHC/ICC Experiments
- Preventing Non-Specific Staining (Non-Specific Binding)
- Primary Antibody Selection & Optimization
- Protocol for Heat-Induced Epitope Retrieval (HIER)
- Protocol for Making a 4% Formaldehyde Solution in PBS
- Protocol for VisUCyte™ HRP Polymer Detection Reagent
- Protocol for the Preparation & Fixation of Cells on Coverslips
- Protocol for the Preparation and Chromogenic IHC Staining of Frozen Tissue Sections
- Protocol for the Preparation and Chromogenic IHC Staining of Frozen Tissue Sections - Graphic
- Protocol for the Preparation and Chromogenic IHC Staining of Paraffin-embedded Tissue Sections
- Protocol for the Preparation and Chromogenic IHC Staining of Paraffin-embedded Tissue Sections - Graphic
- Protocol for the Preparation and Fluorescent IHC Staining of Frozen Tissue Sections
- Protocol for the Preparation and Fluorescent IHC Staining of Paraffin-embedded Tissue Sections
- Protocol for the Preparation of Gelatin-coated Slides for Histological Tissue Sections
- R&D Systems Quality Control Western Blot Protocol
- TUNEL and Active Caspase-3 Detection by IHC/ICC Protocol
- The Importance of IHC/ICC Controls
- Troubleshooting Guide: Immunohistochemistry
- Troubleshooting Guide: Western Blot Figures
- Western Blot Conditions
- Western Blot Protocol
- Western Blot Protocol for Cell Lysates
- Western Blot Troubleshooting
- Western Blot Troubleshooting Guide
- View all Protocols, Troubleshooting, Illustrated assays and Webinars
Loading...