Flow Cytometry Control and Standardization Beads
Calibration Beads | Compensation Beads | Cell Counting Beads
Flow Cytometry is a technique for quantifying characteristics of cells such as cell number, size and complexity, fluorescence, phenotype, and viability. Collecting accurate flow cytometry data is dependent on proper flow cytometer maintenance and experimental setup. Using quality control beads minimizes variation in instrument alignment, allows for more precision across longitudinal studies, and contributes to more reliable data comparisons from site-to-site and user-to-user. Several types of flow cytometry control beads are available to calibrate, standardize, and control the flow cytometer and resulting data. We offer beads specific for 1) calibration, 2) compensation and 3) cell counting. Using bead controls and standards helps ensure that your instrument is operating properly and that your data is both reproducible and reliable.
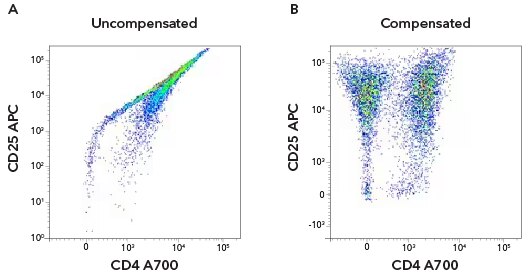
Uncompensated versus compensated data. Human CD3+ T cells were activated with anti-CD3/anti-CD28 for 7 days. The cells were stained with antibodies against hCD4 A700 [FAB3791N] and hCD25 APC [FAB1020A]. Dot plot of hCD4 and hCD25 without compensation (a) and with compensation applied (b). From Flow Cytometry Handbook (Figure 8).
Why use Flow Cytometry Quality Control Beads?
| Calibration Beads | Compensation Beads | Counting Beads |
|---|---|---|
|
|
|
Flow Cytometry Panel Builder
Plan your flow cytometry experiment with our Flow Cytometry Panel Builder tool.
Create your panel in three simple steps:
- Choose your cytometer configuration
- Add your markers
- Select compatible conjugated antibodies.

Different Types of Bead Controls
Calibration (Quality Control) Particles
Calibration particles have a defined particle size and fluorescence intensity. When used to adjust a flow cytometer, fluorescence intensity is converted from an arbitrary unit to the standard unit of measurement, molecules of equivalent soluble fluorochrome (MESF) units. Instrument calibration not only allows for normalization of results from day-to-day instrument variation but also allows researchers to confidently carryout longitudinal studies and ensures consistency across multiple instruments and laboratories. Specifically, calibration particles are important for determining instrument sensitivity and linearity. Sensitivity refers to both the smallest amount of light that can be detected and the ability to distinguish cells with a dim fluorescence intensity from unstained cells. Control beads ensure instrument linearity by means of voltage optimization and verifying that the fluorescence in each channel is on scale.
Our calibration beads are sets of similar sized particles with varying fluorescence intensities that are suitable for a range of channels from ultraviolet (UV) to infrared (IR). For convenience, the particles come in an easy to use dropper bottle and remain stable for many years even with repeated freeze/thaws.
| Product Name | Catalog Number | Functionality | Particle Size | Laser Compatibility |
|---|---|---|---|---|
| Rainbow Calibration Particle Set (8 peaks) | NBP3-00504 | Flow Cytometer Calibration | 3.0 – 3.4 μm | 365-650 nm |
| Rainbow Calibration Particle Set (6 peaks) | NBP3-00505 | Flow Cytometer Calibration | 3.2 (+/- 0.1) μm | 365-650 nm |
| Rainbow Calibration Particle Set (8 peaks - EAL01) | NBP3-00506 | Flow Cytometer Calibration | 3.0 – 3.4 μm | 365-650 nm |
| Max Rainbow Fluorescent Particle Set | NBP3-00507 | Flow Cytometer Calibration | 0.1 – 0.3 μm | UV – IR |
| Ultra Rainbow Calibration ERF Particle Set (6 peaks) | NBP3-11817 | Fluorescent Unit Standardization | 3.5-3.9 μm | 405-650 nm |

Rainbow Calibration Particle Set (8 peaks) [NBP3-00504] - PE Log x PE-Texas Red (TR) Log scatter dot plots with 8 different populations. Based on these gates, histograms show 8 peaks in the PE and PE-TR channels. Note: FITC and PE-Cy5 histograms not shown for brevity.
Compensation beads are used to help set reliable and precise flow cytometer gating and voltage constraints to account for fluorescence spillover, which occurs when a fluorophore emits photons in multiple detectors. The beads serve as a quality control for fluorochrome-conjugated monoclonal antibodies minimizing the effects of spectral spillover between multiple fluorochromes and flow cytometer channels. Setting parameters with compensation beads ensure a detector will only measure fluorescence emission from the appropriate fluorochrome, providing more confidence in the analysis of cell populations. Since positive compensation control beads are coated with a species-specific antibody, it is important to choose beads that will bind the host species of your fluorochrome-conjugated antibody. We offer a variety of compensation beads to fit your specific compensation needs. Our beads deliver bright, uniform staining for determining compensation of even rare colors in your sample.
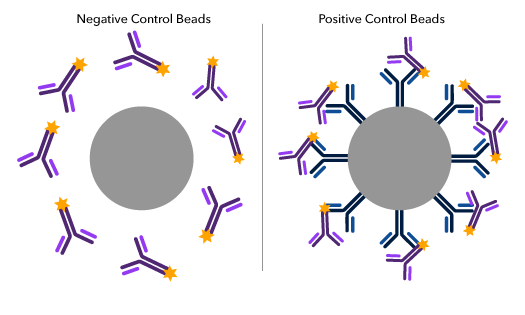
Schematic of a negative and positive compensation bead particle highlighting the positive control bead coating with the species-specific antibody (blue) which binds to fluorochrome-conjugated antibodies (purple).
| Product Name | Catalog Number | Functionality | Particle Size | Laser Compatibility |
|---|---|---|---|---|
| Anti-Mouse Ig (H+L) Comp-Bead 2 Population (3.0-3.4 um) Kit | NBP3-11302 | Immunophenotyping species reactivity- mouse, rat, and hamster | 3.0-3.4 μm | UV – near IR |
| Anti-Mouse Ig (H+L) Comp-Bead 3 Population (5.5 µm) Kit | NBP3-00497 | Immunophenotyping species reactivity- mouse, rat, and hamster | 5.0 – 5.9 μm | UV – near IR |
| Anti-Mouse Ig (H+L) Comp-Bead 3 Population (7.5 μm) Kit | NBP3-00499 | Immunophenotyping species reactivity- mouse, rat, and hamster | 7.0 – 7.9 μm | UV – near IR |
| Blank Comp-Bead Particles | NBP3-00500 | Negative Control – no antibody binding capacity | 3.0 – 3.4 μm | Most standard lasers. From UV – 633 nm |
| GFP Comp-Bead Particles | NBP3-00503 | Green Fluorescent Protein (GFP) capture | 3.0 – 3.4 μm | 488 nm |
| Amine Reactive Comp-Bead 2 Population Kit | NBP3-00496 | Cell viability of animal cells, bacteria, yeast, and fungi Labeling of amine-reactive dyes when setting compensation | 7.0 – 7.9 μm | Most standard lasers. From UV – 633 nm |
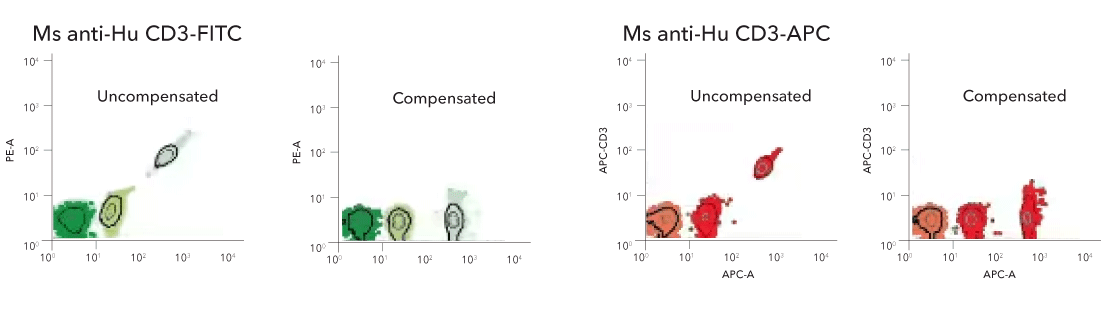
Anti-Mouse Ig (H+L) Comp-Bead 3 Population (5.5 µm) [NBP3-00497] - Dot plots of the anti-mouse Ig (H+L) Comp-Bead 3 Population Kit exposed to mouse monoclonal fluorescent conjugates, FITC (left) and APC (right).
Cell Counting Beads
Cell counting beads provide an easy, streamlined method for determining the concentration of cells or absolute cell count of your sample. Cell counting beads are conveniently supplied with a known number of particles per mL. An exact volume of counting bead particles is mixed with a known cell sample volume and analyzed via flow cytometry. A set number of events are collected from both the counting beads and cell sample. The ratio of these is then compared to determine the number of cells in the sample. See the procedure below for specifics on how to use our counting bead particles and perform calculations.
Our Absolute Rainbow Cell Counting Particles span a range of particle sizes to provide coverage of the sample cell size being counted. Additionally, they are suitable for use in multiple fluorescent channels, including FITC, PE, PE-TR, PE-Cy5, and APC.
| Product Name | Catalog Number | Functionality | Particle Size | Laser Compatibility |
|---|---|---|---|---|
| Absolute Rainbow Cell Count Particle Set | NBP3-00495 | Absolute Cell Count | 8.0 – 12.9 μm | 488 – 633 nm |

Rainbow counting beads can be used to quantify NK cell killing of K562 cells. NK cells cultured for 14 days were assessed for killing with K562 cells. K562 cells were labeled with MitoMark Green and NK cells were labeled with Janelia Fluor® 646 . Cell counts were normalized using Absolute Rainbow Cell Counting Particles [NBP3-00495] (labeled as beads in each FSC/SSC plot) across different K562:NK ratios so that the amount of cell killing could be accurately quantitated. (A) K562 cells alone (top panels) do not show any cell killing; NK cells added at a 5:1 ratio with K562 cells (bottom panels), show significant cell killing as shown by MitoMark Green dilution (B).
How to Use Rainbow Cell Count Particles
Note: Shake bottle vigorously or vortex briefly before use.
- Add the monoclonal antibody of your choice to 100 μL of test sample.
- Incubate, lyse, wash, and then resuspend in 1 - 2 mL PBS.
Note: If staining and lysing are not needed, mix a known volume of test sample in 1 - 2 mL PBS. - Add exactly 50 μL of Absolute Rainbow Cell Count Particles to the suspension.
- Run the sample in the flow cytometer and collect events for the Absolute Rainbow Cell Count Particles and your test sample.
Calculate the number of cells accordingly: (A/B) x (C/D) = Number of cells per μL where
A = number of events for the test sample
B = number of events for the Absolute Rainbow Cell Count Particles
C = number of Absolute Rainbow Cell Count Particles per 50 μL
D = volume of the initial test sample
Flow Cytometry Resources and Protocols
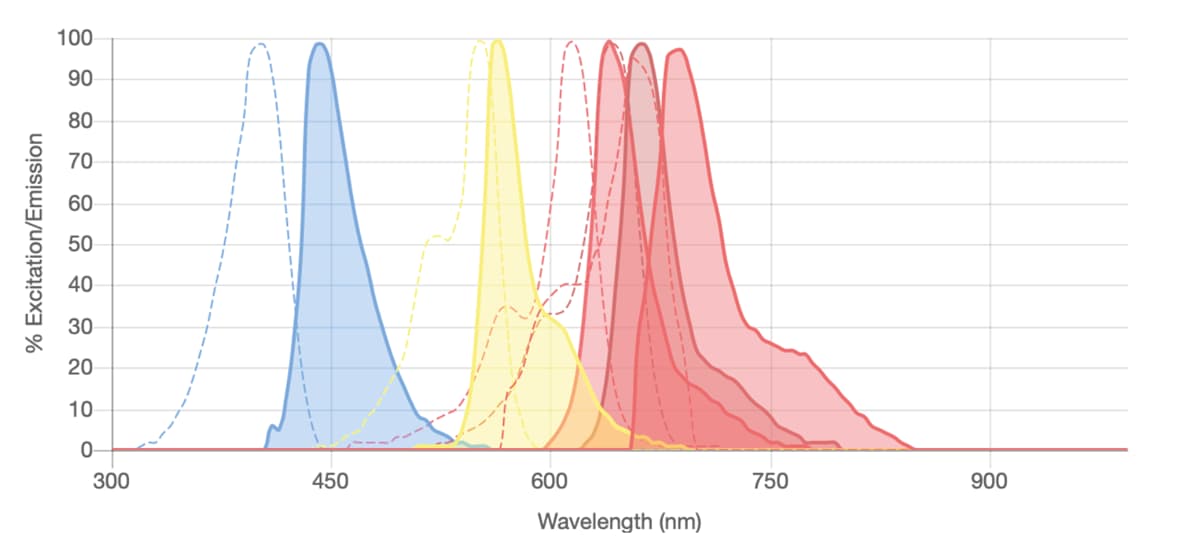
Spectra Viewer
Use our spectral viewer to see the excitation and emission spectra for all popular dye ranges (including Janelia Fluor® dyes and BDY dyes). It can be used to assess multiplexing options and suitable dye-antibody conjugate options.
NOTE: absorption spectra may be displayed instead of excitation spectra.
Selected References
- Goetz, C., Hammerbeck, C., & Bonnevier, J. (2018). Flow cytometry basics for the non-expert. Springer International Publishing.
Retrieved from www.springer.com - Perfetto, S. P., Ambrozak, D., Nguyen, R., et al. (2012). Quality assurance for polychromatic flow cytometry using a suite of calibration beads. Nature protocols. https://doi.org/10.1038/nprot.2012.126
- Wang, L., & Hoffman, R.A. (2017). Standardization, calibration, and control in flow cytometry. Curr. Protoc. Cytom.