Human IL-1 beta/IL-1F2 Antibody (2805)
R&D Systems | Catalog # MAB601

Scientific images may be resized, cropped, or adjusted for brightness or contrast for presentation purposes. These updates are limited to presentation and do not affect the underlying scientific interpretation of the data. Where available, additional source data may be provided upon request.
Key Product Details
Validated by
Species Reactivity
Validated:
Cited:
Applications
Validated:
Cited:
Label
Antibody Source
Product Specifications
Immunogen
Specificity
Clonality
Host
Isotype
Endotoxin Level
Scientific Data Images for Human IL-1 beta/IL-1F2 Antibody (2805)
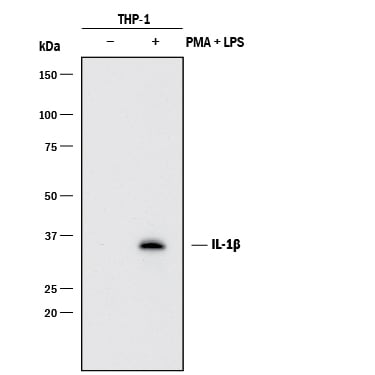
Detection of Human IL‑1 beta /IL‑1F2 by Western Blot.
Western blot shows lysates of THP-1 human acute monocytic leukemia cell line untreated (-) or treated (+) with 200 nM PMA for 24 hours and 10 µg/mL LPS and 3 hours. PVDF membrane was probed with 1 µg/mL of Mouse Anti-Human IL-1 beta /IL-1F2 Monoclonal Antibody (Catalog # MAB601) followed by HRP-conjugated Anti-Mouse IgG Secondary Antibody (Catalog # HAF018). A specific band was detected for IL-1 beta /IL-1F2 at approximately 36 kDa (as indicated). This experiment was conducted under reducing conditions and using Immunoblot Buffer Group 1.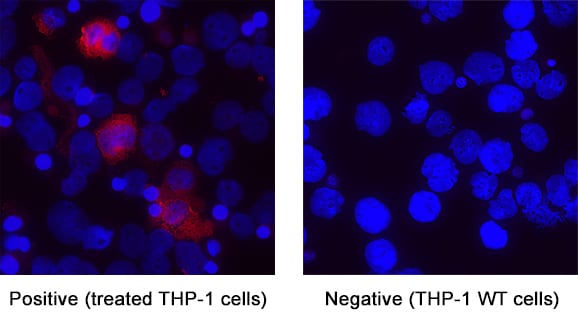
Detection of IL‑1 beta /IL‑1F2 in THP‑1 Human Cell Line.
IL‑1 beta /IL‑1F2 was detected in immersion fixed THP‑1 human acute monocytic leukemia cell line using Mouse Anti-Human IL‑1 beta /IL‑1F2 Monoclonal Antibody (Catalog # MAB601) at 25 µg/ml for 3 hours at room temperature. Cells were stained using the NorthernLights™ 557-conjugated Anti-Mouse IgG Secondary Antibody (red; Catalog # NL007) and counterstained with DAPI (blue). Specific staining was localized to the cytoplasm of THP-1 cells treated with 200nM PMA for 24 hours then 10ug/mL LPS for 24 hours. View our protocol for Fluorescent ICC Staining of Cells on Coverslips.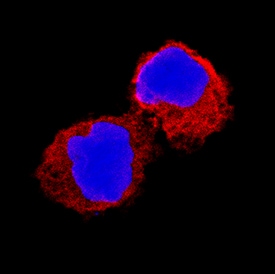
IL‑1 beta /IL‑1F2 in Human PBMCs.
IL-1 beta /IL-1F2 was detected in immersion fixed human peripheral blood mononuclear cells (PBMCs) using Mouse Anti-Human IL-1 beta /IL-1F2 Monoclonal Antibody (Catalog # MAB601) at 8 µg/mL for 3 hours at room temperature. Cells were stained using the NorthernLights™ 557-conjugated Anti-Mouse IgG Secondary Antibody (red; Catalog # NL007) and counterstained with DAPI (blue). Specific staining was localized to cytoplasm. View our protocol for Fluorescent ICC Staining of Non-adherent Cells.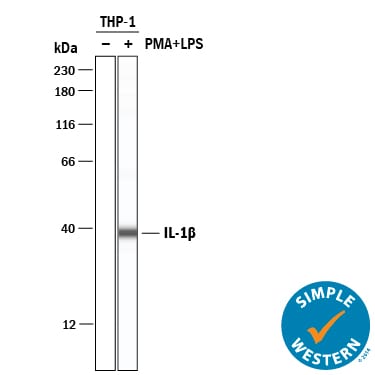
Detection of Human IL‑1 beta /IL‑1F2 by Simple WesternTM.
Simple Western lane view shows lysates of THP‑1 human acute monocytic leukemia cell line untreated (-) or treated (+) with 200 nm PMA and 10 ug/ml LPS for 24 hrs and 3 hrs, respectively, and loaded at 0.2 mg/mL. A specific band was detected for IL‑1 beta /IL‑1F2 at approximately 38 kDa (as indicated) using 10 µg/mL of Mouse Anti-Human IL‑1 beta /IL‑1F2 Monoclonal Antibody (Catalog # MAB601). This experiment was conducted under reducing conditions and using the 12-230 kDa separation system.
Cell Proliferation Induced by IL‑1 beta /IL‑1F2 and Neutralization by Human IL‑1 beta /IL‑1F2 Antibody.
Recombinant Human IL-1 beta /IL-1F2 (Catalog # 201-LB) stimulates proliferation in the the D10.G4.1 mouse helper T cell line in a dose-dependent manner (orange line). Proliferation elicited by Recombinant Human IL-1 beta /IL-1F2 (0.05 ng/mL) is neutralized (green line) by increasing concentrations of Mouse Anti-Human IL-1 beta /IL-1F2 Monoclonal Antibody (Catalog # MAB601). The ND50 is typically 0.05-0.2 µg/mL.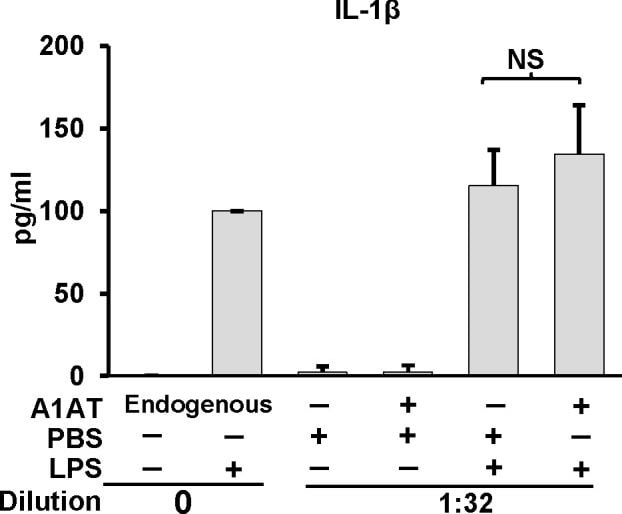
Detection of Human IL-1 beta/IL-1F2 by ELISA
Effect of A1AT on whole blood IL-1 beta release. IL-1 beta production in whole blood cultures in response to LPS (1.0 μg/ml) was performed in the presence of endogenous A1AT (i.e., undiluted) or exogenously added A1AT (2 mg/ml) in blood diluted 1:32 with RPMI. Whole blood cultures were incubated for 18 h. After incubation, plasma supernatants were removed, and IL-1 beta quantified by ELISA and expressed as mean ± SD for three donors. The diluted sample result was corrected for the dilution. NS indicates no significant difference. Image collected and cropped by CiteAb from the following publication (https://dx.plos.org/10.1371/journal.pone.0117330), licensed under a CC-BY license. Not internally tested by R&D Systems.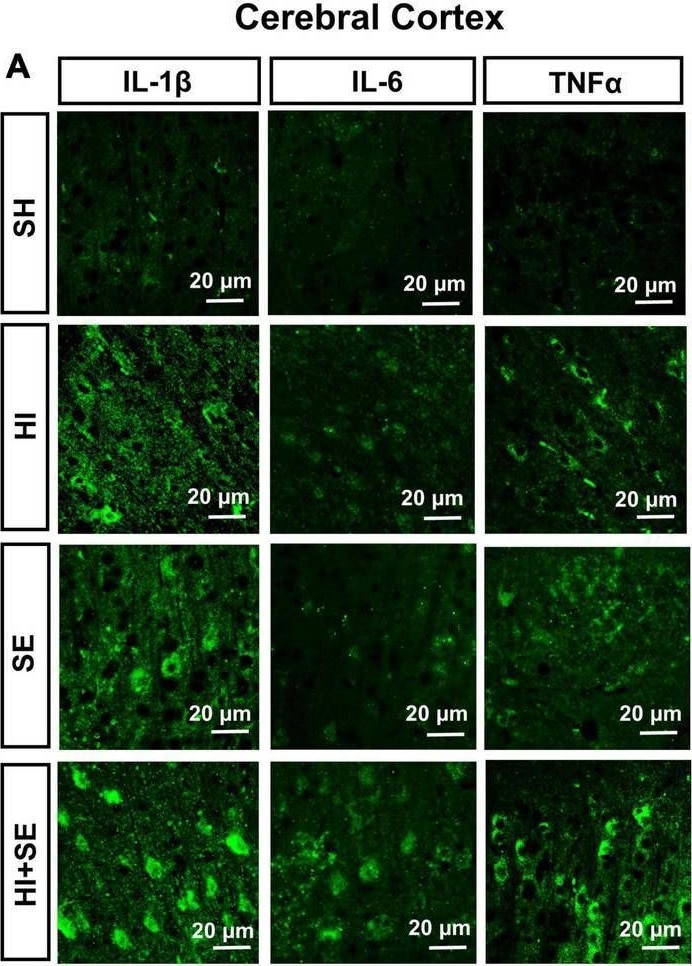
Detection of Mouse IL-1 beta/IL-1F2 by Immunohistochemistry
Inflammatory response induced by HI injury and maternal SE. Representative images of immunofluorescence staining of inflammatory cytokines IL-1 beta, IL-6, and TNF alpha in the cerebral cortex (A) and the hippocampus (E). The immunofluorescence intensity of IL-1 beta (B,F), IL-6 (C,G), and TNF alpha (D,H) in the cerebral cortex and hippocampus. Results are presented as mean ± SEM. *P < 0.05, **P < 0.01, n = 4, analyzed by two-way ANOVA followed by post hoc Turkey tests. SH, from sham exposed dams with sham surgery; HI, hypoxic-ischemic injury; SE, from smoke exposed dams with sham surgery; HI + SE, from smoke exposed dams with hypoxic-ischemic injury. Image collected and cropped by CiteAb from the following publication (https://pubmed.ncbi.nlm.nih.gov/35250486), licensed under a CC-BY license. Not internally tested by R&D Systems.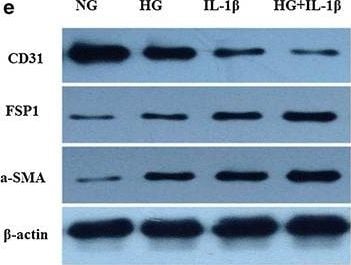
Detection of Human IL-1 beta/IL-1F2 by Western Blot
Effect of high glucose and IL-1 beta alone or in combination on the protein expressions of CD31, FSP1 and alpha -SMA in HAECs. a–d HAECs were incubated for 48 h with NG and HG. Mannitol was used as a control for hyperosmolarity. Representative western blots (a) and quantitative determinations of CD31, FSP1 and alpha -SMA protein levels (b–d) are presented. e–h HAECs were treated for 48 h with NG, HG, IL-1 beta (10 ng/ml)and HG in the presence of the IL-1 beta (10 ng/ml). Representative western blots (E) and quantitative determinations of CD31, FSP1 and alpha -SMA protein levels (f–h) are presented. The data are expressed as the mean ± SD. Experiments were repeated at least three times. NG normal glucose (5.5 mM), HG high glucose (30 mM), MN 5.5 mM glucose + 24.5 mM mannitol, IL-1 beta (10 ng/ml), HG + IL-1 beta : high glucose (30 mM) + IL-1 beta (10 ng/ml) *P < 0.05 vs. MN or NG, **P < 0.01 vs. NG, #P < 0.05 vs. HG Image collected and cropped by CiteAb from the following publication (https://www.cardiab.com/content/15/1/42), licensed under a CC-BY license. Not internally tested by R&D Systems.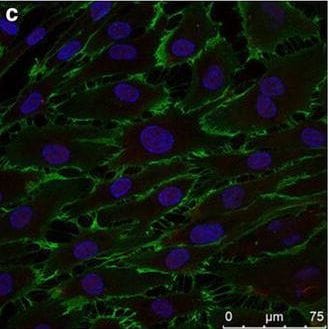
Detection of Human IL-1 beta/IL-1F2 by Immunocytochemistry/Immunofluorescence
The influence of high glucose or IL-1 beta on immunofluorescence of CD31 and FSP1 in HAECs. Representative immunofluorescence images showing CD31 (green), FSP1 (red) labeling and DAPI (blue) stains nuclei. a Normal ECs monolayers displayed a cobble stone morphology. b A merge of the three images revealed some cells populations that acquired a spindle-shaped morphology and lost CD31 expression (white arrow). c HAECs exposure to IL-1 beta alone for 48 h acquired a spindle-shaped morphology. d High glucose and IL-1 beta in combination resulted in decreased CD31 (the left white arrow) and increased FSP1staining (the right arrow). a normal glucose (5.5 mM) group, b high glucose (30 mM) group for 48 h; c treatment with a normal glucose (5.5 mM) + IL-1 beta (10 ng/ml) treatment for 48 h, d treatment with a high glucose (30 mM) + IL-1 beta (10 ng/ml) treatment for 48 h. Scale bar, 75 μm Image collected and cropped by CiteAb from the following publication (https://www.cardiab.com/content/15/1/42), licensed under a CC-BY license. Not internally tested by R&D Systems.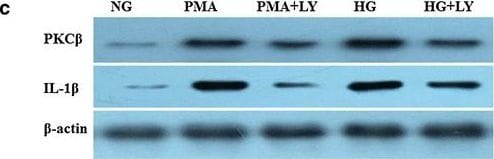
Detection of Human IL-1 beta/IL-1F2 by Western Blot
Effects of PKC beta on high glucose induced IL-1 beta up-regulation. Confluent cultures of HAECs were exposed to NG, HG, PMA (30 nM) and HG in the presence of the selective PKC beta inhibitors (LY317615, 0.3 μM) for 48 h. Real-time PCR analyses showed mRNA expression of PKC beta and IL-1 beta (a, b). Representative western blots (c) and quantitative determinations of PKC beta and IL-1 beta (d, e) are presented. The data are expressed as the mean ± SD. Experiments were repeated at least three times. NG normal glucose (5.5 mM), HG high glucose (30 mM), PMA (30 nM): phorbol 12-myristate13-acetate; LY (0.3 uM): LY317615; *P < 0.05 vs.NG, **P < 0.01 vs. NG, #P < 0.05 vs. HG or PMA Image collected and cropped by CiteAb from the following publication (https://www.cardiab.com/content/15/1/42), licensed under a CC-BY license. Not internally tested by R&D Systems.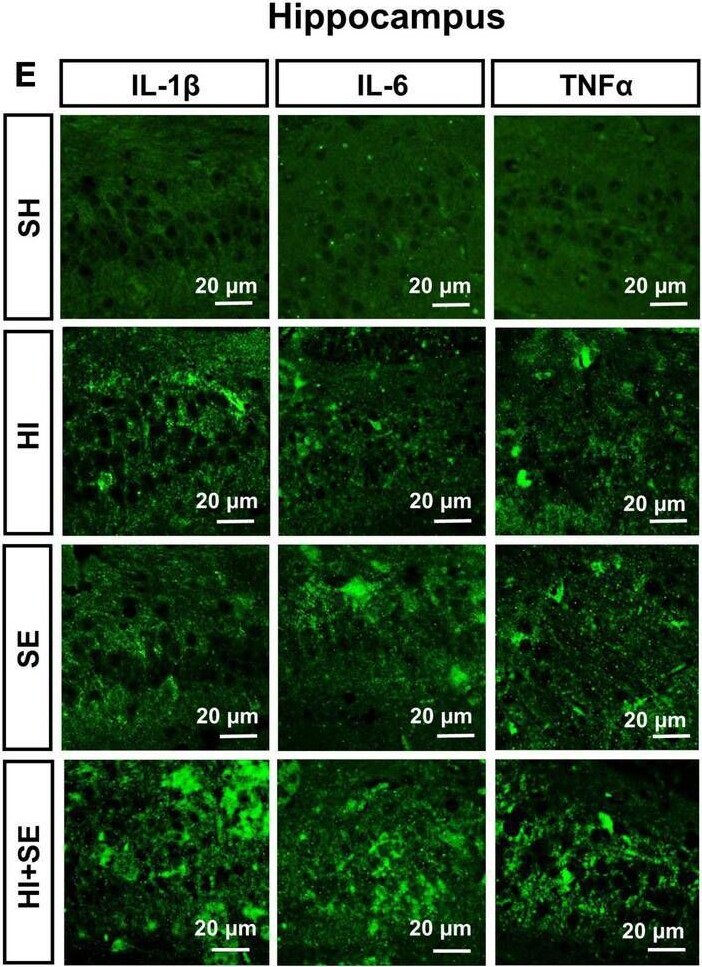
Detection of Mouse IL-1 beta/IL-1F2 by Immunohistochemistry
Inflammatory response induced by HI injury and maternal SE. Representative images of immunofluorescence staining of inflammatory cytokines IL-1 beta, IL-6, and TNF alpha in the cerebral cortex (A) and the hippocampus (E). The immunofluorescence intensity of IL-1 beta (B,F), IL-6 (C,G), and TNF alpha (D,H) in the cerebral cortex and hippocampus. Results are presented as mean ± SEM. *P < 0.05, **P < 0.01, n = 4, analyzed by two-way ANOVA followed by post hoc Turkey tests. SH, from sham exposed dams with sham surgery; HI, hypoxic-ischemic injury; SE, from smoke exposed dams with sham surgery; HI + SE, from smoke exposed dams with hypoxic-ischemic injury. Image collected and cropped by CiteAb from the following publication (https://pubmed.ncbi.nlm.nih.gov/35250486), licensed under a CC-BY license. Not internally tested by R&D Systems.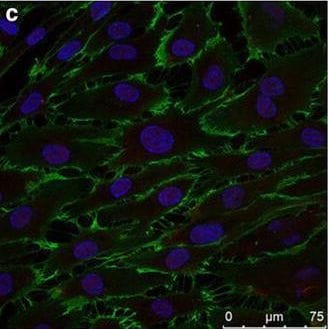
Detection of Human IL-1 beta/IL-1F2 by Immunocytochemistry/Immunofluorescence
The influence of high glucose or IL-1 beta on immunofluorescence of CD31 and FSP1 in HAECs. Representative immunofluorescence images showing CD31 (green), FSP1 (red) labeling and DAPI (blue) stains nuclei. a Normal ECs monolayers displayed a cobble stone morphology. b A merge of the three images revealed some cells populations that acquired a spindle-shaped morphology and lost CD31 expression (white arrow). c HAECs exposure to IL-1 beta alone for 48 h acquired a spindle-shaped morphology. d High glucose and IL-1 beta in combination resulted in decreased CD31 (the left white arrow) and increased FSP1staining (the right arrow). a normal glucose (5.5 mM) group, b high glucose (30 mM) group for 48 h; c treatment with a normal glucose (5.5 mM) + IL-1 beta (10 ng/ml) treatment for 48 h, d treatment with a high glucose (30 mM) + IL-1 beta (10 ng/ml) treatment for 48 h. Scale bar, 75 μm Image collected and cropped by CiteAb from the following publication (https://www.cardiab.com/content/15/1/42), licensed under a CC-BY license. Not internally tested by R&D Systems.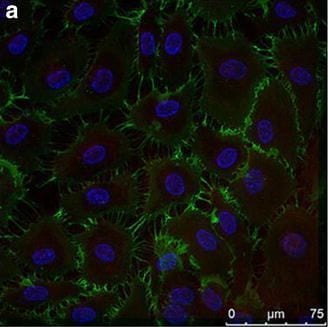
Detection of Human IL-1 beta/IL-1F2 by Immunocytochemistry/Immunofluorescence
The influence of high glucose or IL-1 beta on immunofluorescence of CD31 and FSP1 in HAECs. Representative immunofluorescence images showing CD31 (green), FSP1 (red) labeling and DAPI (blue) stains nuclei. a Normal ECs monolayers displayed a cobble stone morphology. b A merge of the three images revealed some cells populations that acquired a spindle-shaped morphology and lost CD31 expression (white arrow). c HAECs exposure to IL-1 beta alone for 48 h acquired a spindle-shaped morphology. d High glucose and IL-1 beta in combination resulted in decreased CD31 (the left white arrow) and increased FSP1staining (the right arrow). a normal glucose (5.5 mM) group, b high glucose (30 mM) group for 48 h; c treatment with a normal glucose (5.5 mM) + IL-1 beta (10 ng/ml) treatment for 48 h, d treatment with a high glucose (30 mM) + IL-1 beta (10 ng/ml) treatment for 48 h. Scale bar, 75 μm Image collected and cropped by CiteAb from the following publication (https://www.cardiab.com/content/15/1/42), licensed under a CC-BY license. Not internally tested by R&D Systems.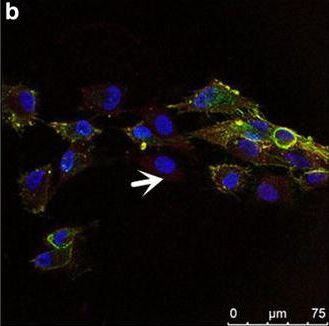
Detection of Human IL-1 beta/IL-1F2 by Immunocytochemistry/Immunofluorescence
The influence of high glucose or IL-1 beta on immunofluorescence of CD31 and FSP1 in HAECs. Representative immunofluorescence images showing CD31 (green), FSP1 (red) labeling and DAPI (blue) stains nuclei. a Normal ECs monolayers displayed a cobble stone morphology. b A merge of the three images revealed some cells populations that acquired a spindle-shaped morphology and lost CD31 expression (white arrow). c HAECs exposure to IL-1 beta alone for 48 h acquired a spindle-shaped morphology. d High glucose and IL-1 beta in combination resulted in decreased CD31 (the left white arrow) and increased FSP1staining (the right arrow). a normal glucose (5.5 mM) group, b high glucose (30 mM) group for 48 h; c treatment with a normal glucose (5.5 mM) + IL-1 beta (10 ng/ml) treatment for 48 h, d treatment with a high glucose (30 mM) + IL-1 beta (10 ng/ml) treatment for 48 h. Scale bar, 75 μm Image collected and cropped by CiteAb from the following publication (https://www.cardiab.com/content/15/1/42), licensed under a CC-BY license. Not internally tested by R&D Systems.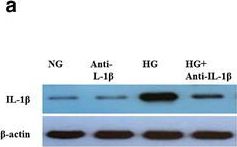
Detection of Human IL-1 beta/IL-1F2 by Western Blot
The influence of blocking IL-1 beta treatment on the protein expressions of CD31, FSP1, a-SMA, and IL-1 beta. (a–f) HAECs were incubated for 48 h with anti-IL-1 beta antibodies (1000 ng/ml) in the presence of NG or HG. (a1–f1) We performed gene-silencing experiments using transfection with siRNA specific for IL-1 beta. The protein expressions of IL-1 beta, CD31, FSP1 and alpha -SMA were assessed by western blotting. The data are expressed as the mean ± SD. Experiments were repeated at least three times. NG normal glucose (5.5 mM), HG high glucose (30 mM). Anti-IL-1 beta : anti-IL-1 beta antibodies (1000 ng/ml). *P < 0.05 vs. NG or anti-IL-1 beta, #P < 0.05 vs. HG or HG +Vehicle Image collected and cropped by CiteAb from the following publication (https://www.cardiab.com/content/15/1/42), licensed under a CC-BY license. Not internally tested by R&D Systems.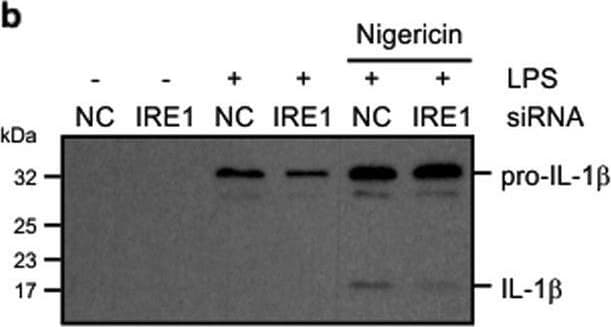
Detection of Human IL-1 beta /IL-1F2 by Western Blot
Knockdown of IRE1 alpha reduces LPS-induced cytokine production.THP-1 cells transfected with either noncoding (NC) or IRE1 alpha targeting siRNA were treated with either 1 μg/ml LPS alone for 24 h or 1 μg/ml LPS for 24 h followed by addition of 10 μM nigericin (NG) for 45 min. a Cell lysates were analysed via immunoblotting for IRE1 alpha, phospho-p65, total p65, NLRP3, pro-caspase-1 and pro-IL-1 beta. Actin was used as a loading control. b Cell conditioned medium was analysed via immunoblotting for pro-IL-1 beta processing. c–f Levels of IL-1 beta, IL-8, TNF-alpha, and IL-6 were assayed in cell conditioned medium by ELISA (n = 3). *P < 0.05, **P < 0.01, and ***P < 0.001 based on a Student’s t test. Error bars represent SD Image collected and cropped by CiteAb from the following open publication (https://pubmed.ncbi.nlm.nih.gov/31417078), licensed under a CC-BY license. Not internally tested by R&D Systems.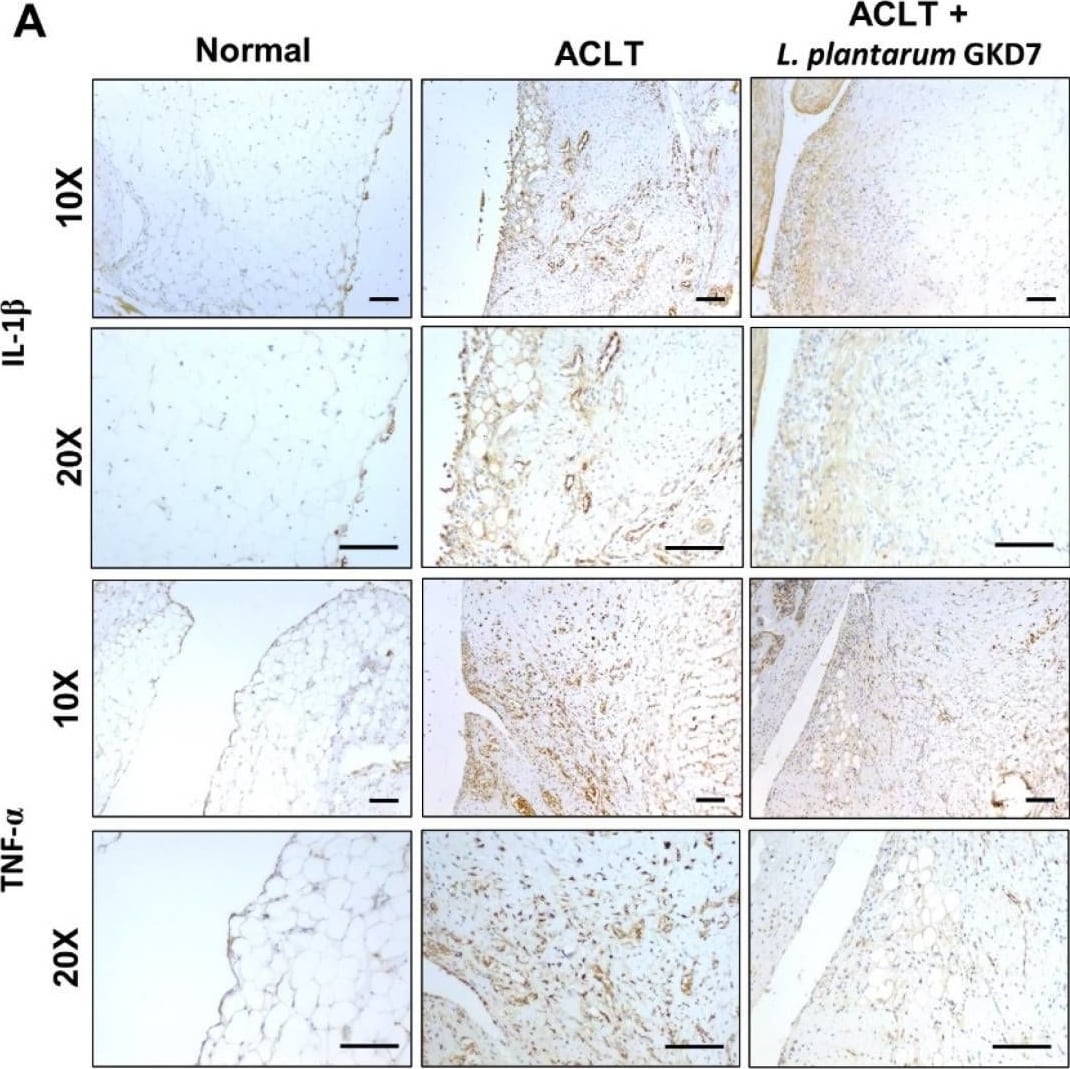
Detection of IL-1 beta /IL-1F2 by Immunohistochemistry
Oral live L. plantarum GKD7 reduced levels of TNF-alpha and IL-1 beta expression in OA synovium. (A) IHC staining of IL-1 beta and TNF-alpha in representative synovium from controls, ACLT-only rats, and ACLT + L. plantarum GKD7 rats. Quantitative analyses of (B) IL-1 beta and (C) TNF-alpha in synovium. Scale bar = 100 µm. * p < 0.05 vs. controls; # p < 0.05 vs. the ACLT-only group. Image collected and cropped by CiteAb from the following open publication (https://pubmed.ncbi.nlm.nih.gov/35956346), licensed under a CC-BY license. Not internally tested by R&D Systems.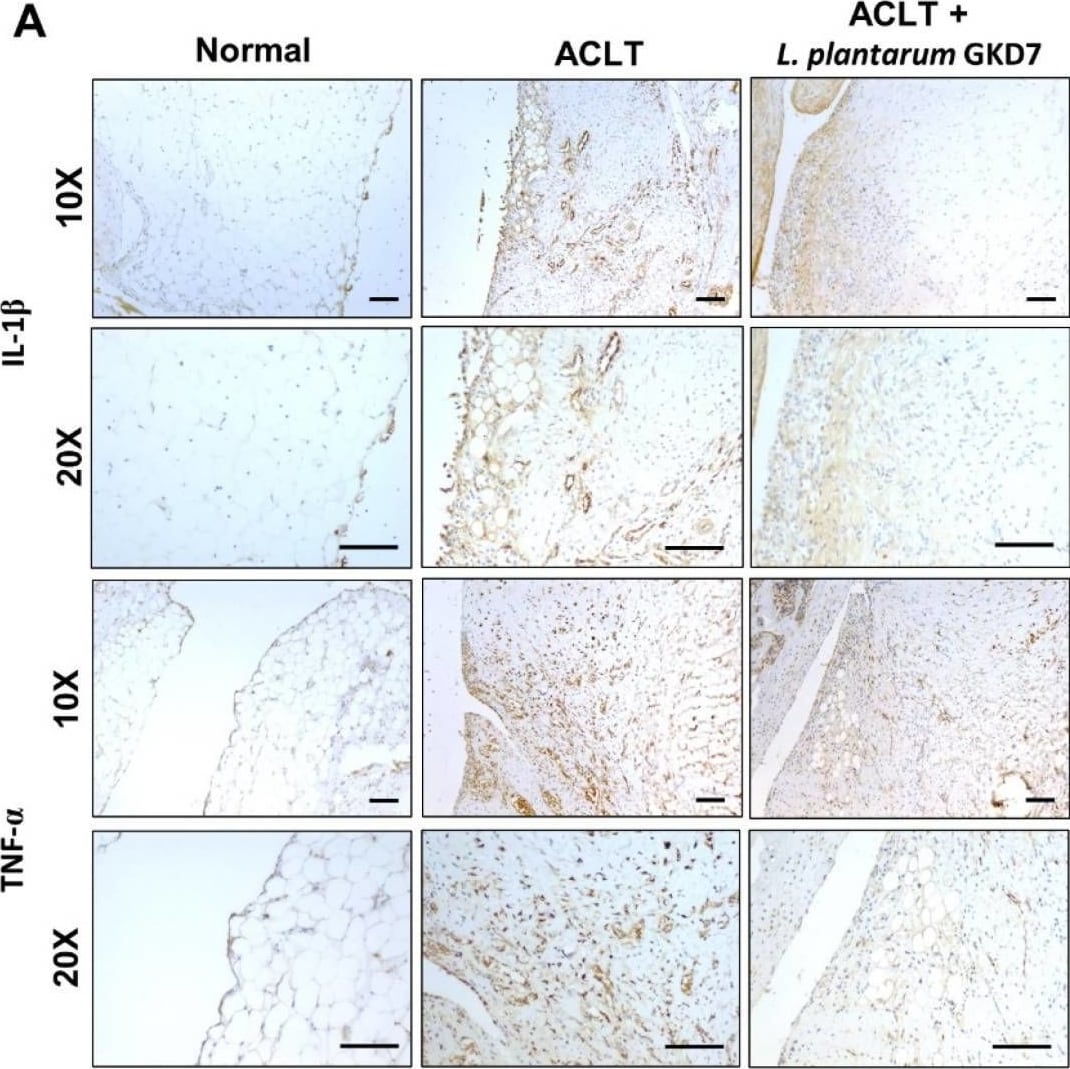
Detection of IL-1 beta /IL-1F2 by Immunohistochemistry
Oral live L. plantarum GKD7 reduced levels of TNF-alpha and IL-1 beta expression in OA synovium. (A) IHC staining of IL-1 beta and TNF-alpha in representative synovium from controls, ACLT-only rats, and ACLT + L. plantarum GKD7 rats. Quantitative analyses of (B) IL-1 beta and (C) TNF-alpha in synovium. Scale bar = 100 µm. * p < 0.05 vs. controls; # p < 0.05 vs. the ACLT-only group. Image collected and cropped by CiteAb from the following open publication (https://pubmed.ncbi.nlm.nih.gov/35956346), licensed under a CC-BY license. Not internally tested by R&D Systems.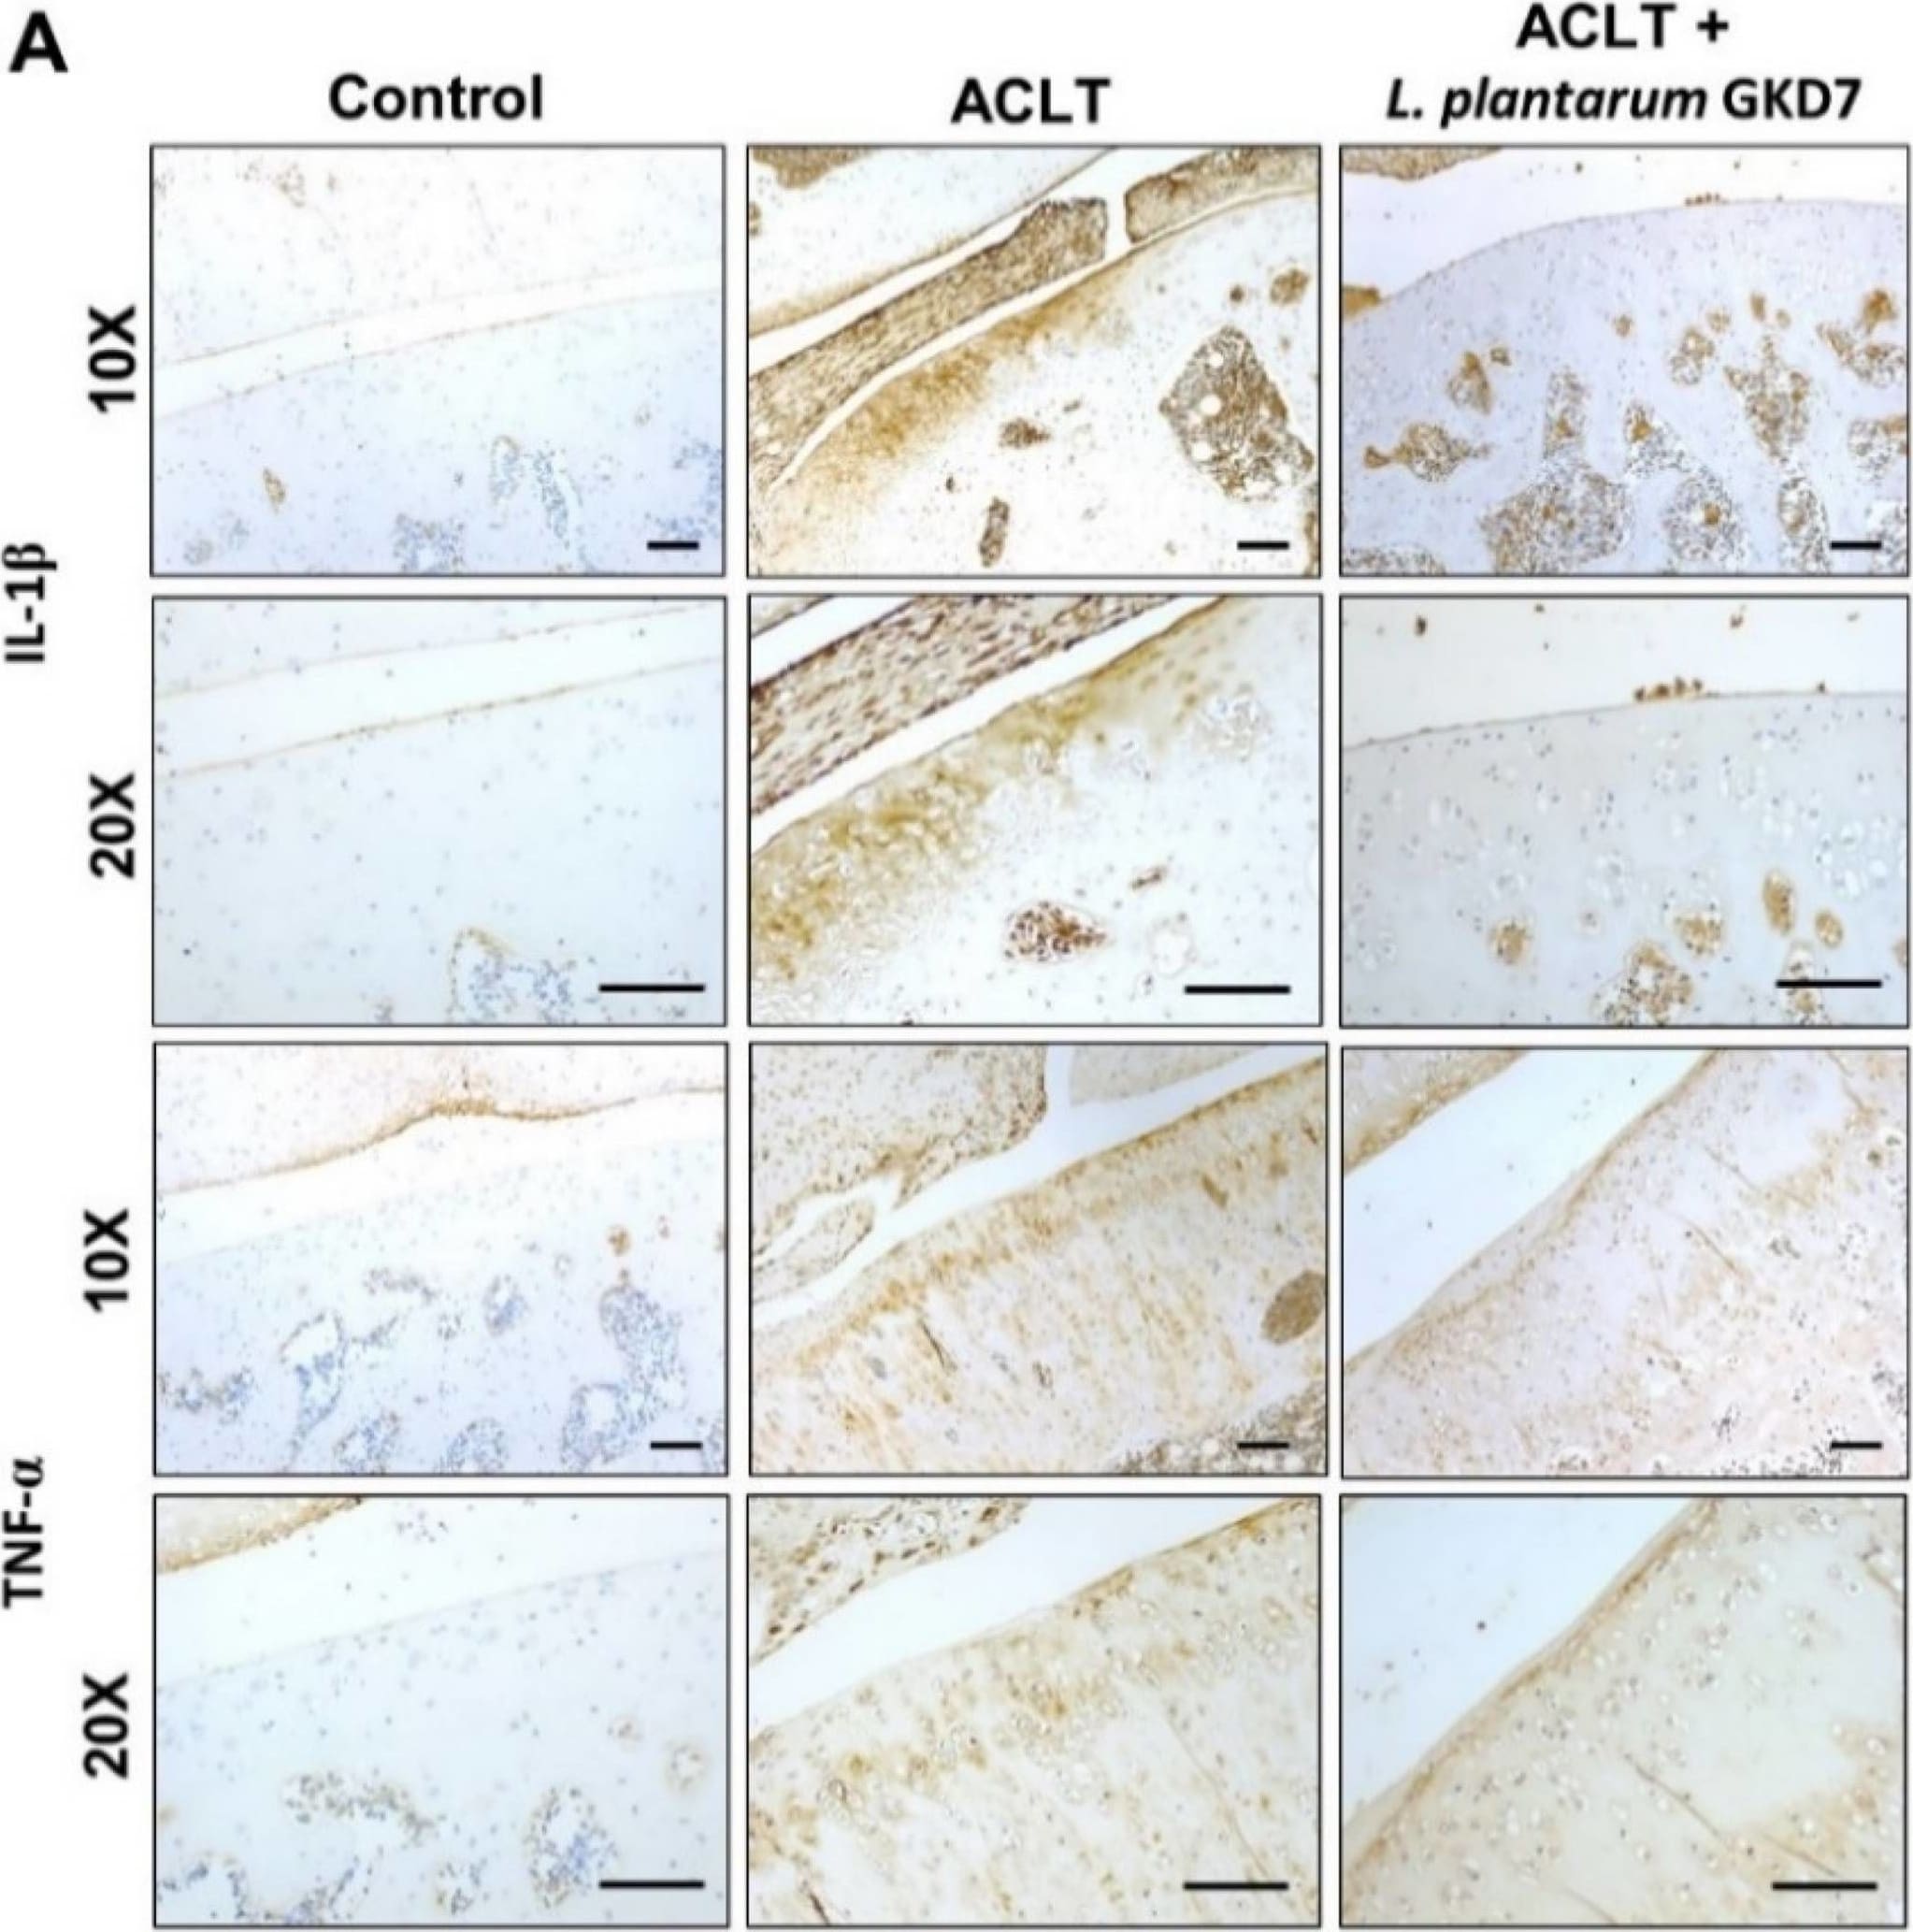
Detection of IL-1 beta /IL-1F2 by Immunohistochemistry
Oral live L. plantarum GKD7 reduced key proinflammatory cytokines in OA cartilage. (A) IHC staining of IL-1 beta and TNF-alpha expression in representative cartilage from controls, ACLT-only rats, and ACLT + L. plantarum GKD7 rats. Quantitative analyses of (B) IL-1 beta and (C) TNF-alpha in cartilage. Scale bar = 100 µm. * p < 0.05 vs. controls; # p < 0.05 vs. the ACLT-only group. Image collected and cropped by CiteAb from the following open publication (https://pubmed.ncbi.nlm.nih.gov/35956346), licensed under a CC-BY license. Not internally tested by R&D Systems.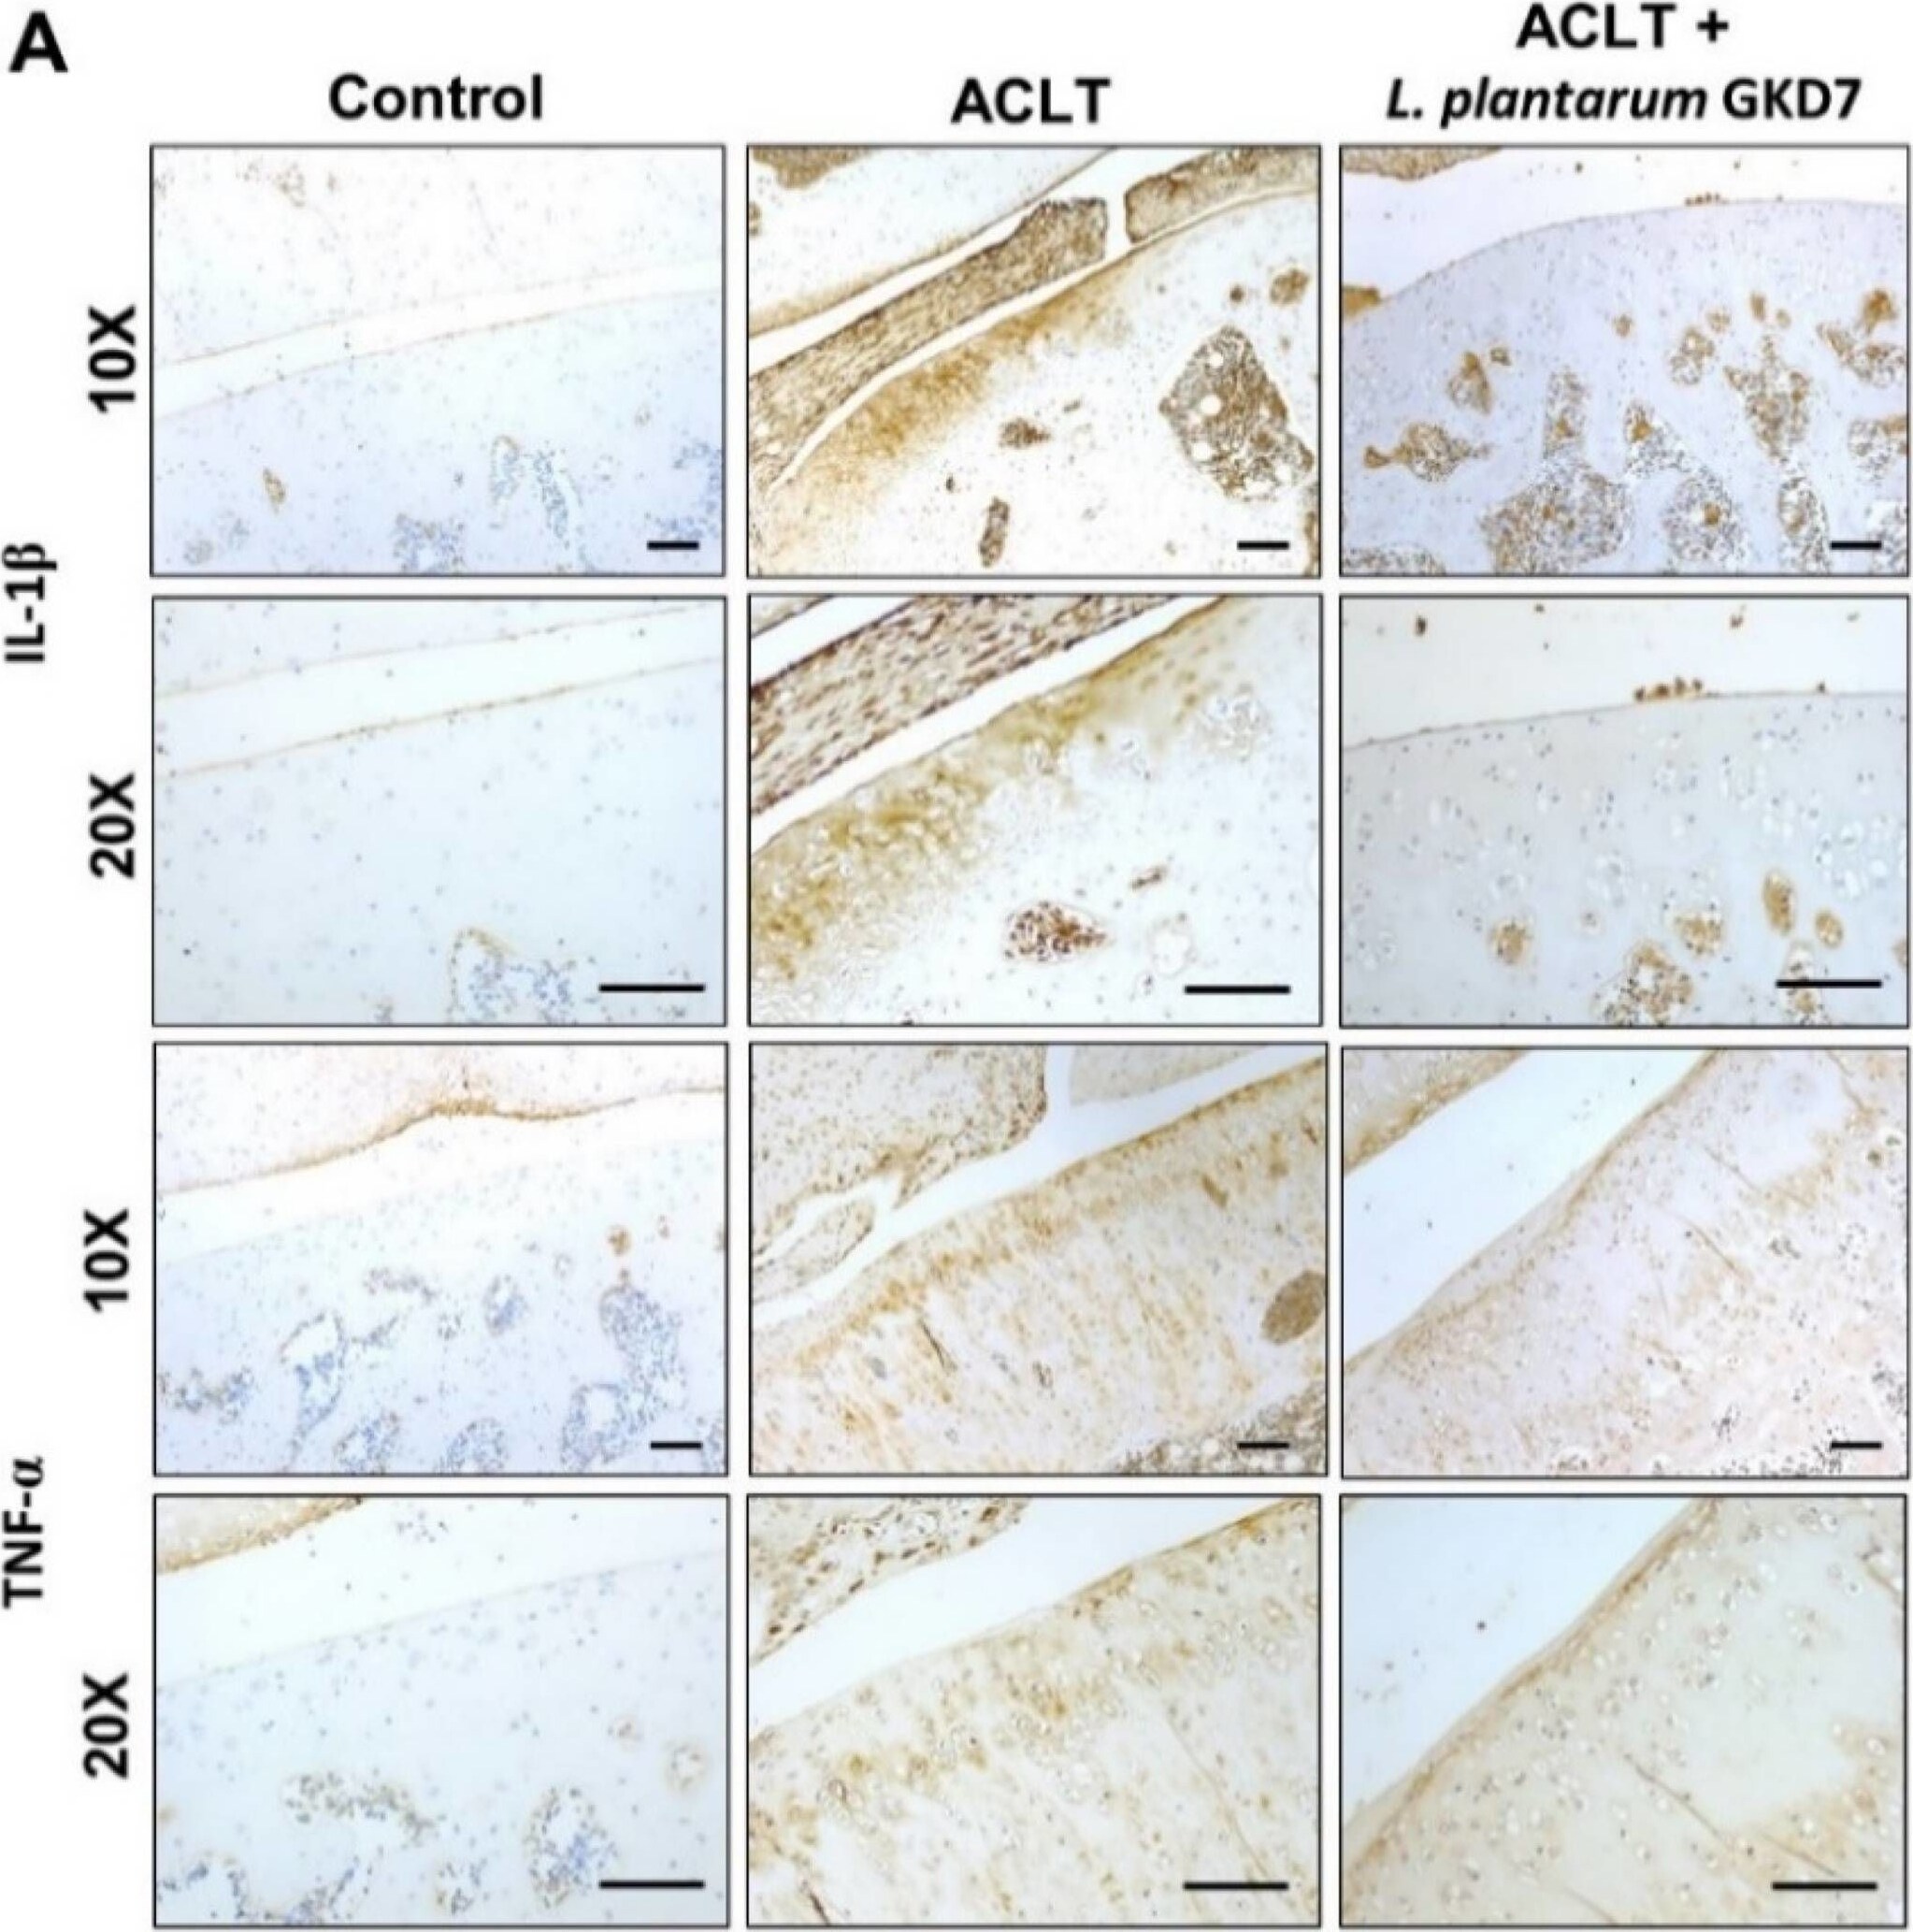
Detection of IL-1 beta /IL-1F2 by Immunohistochemistry
Oral live L. plantarum GKD7 reduced key proinflammatory cytokines in OA cartilage. (A) IHC staining of IL-1 beta and TNF-alpha expression in representative cartilage from controls, ACLT-only rats, and ACLT + L. plantarum GKD7 rats. Quantitative analyses of (B) IL-1 beta and (C) TNF-alpha in cartilage. Scale bar = 100 µm. * p < 0.05 vs. controls; # p < 0.05 vs. the ACLT-only group. Image collected and cropped by CiteAb from the following open publication (https://pubmed.ncbi.nlm.nih.gov/35956346), licensed under a CC-BY license. Not internally tested by R&D Systems.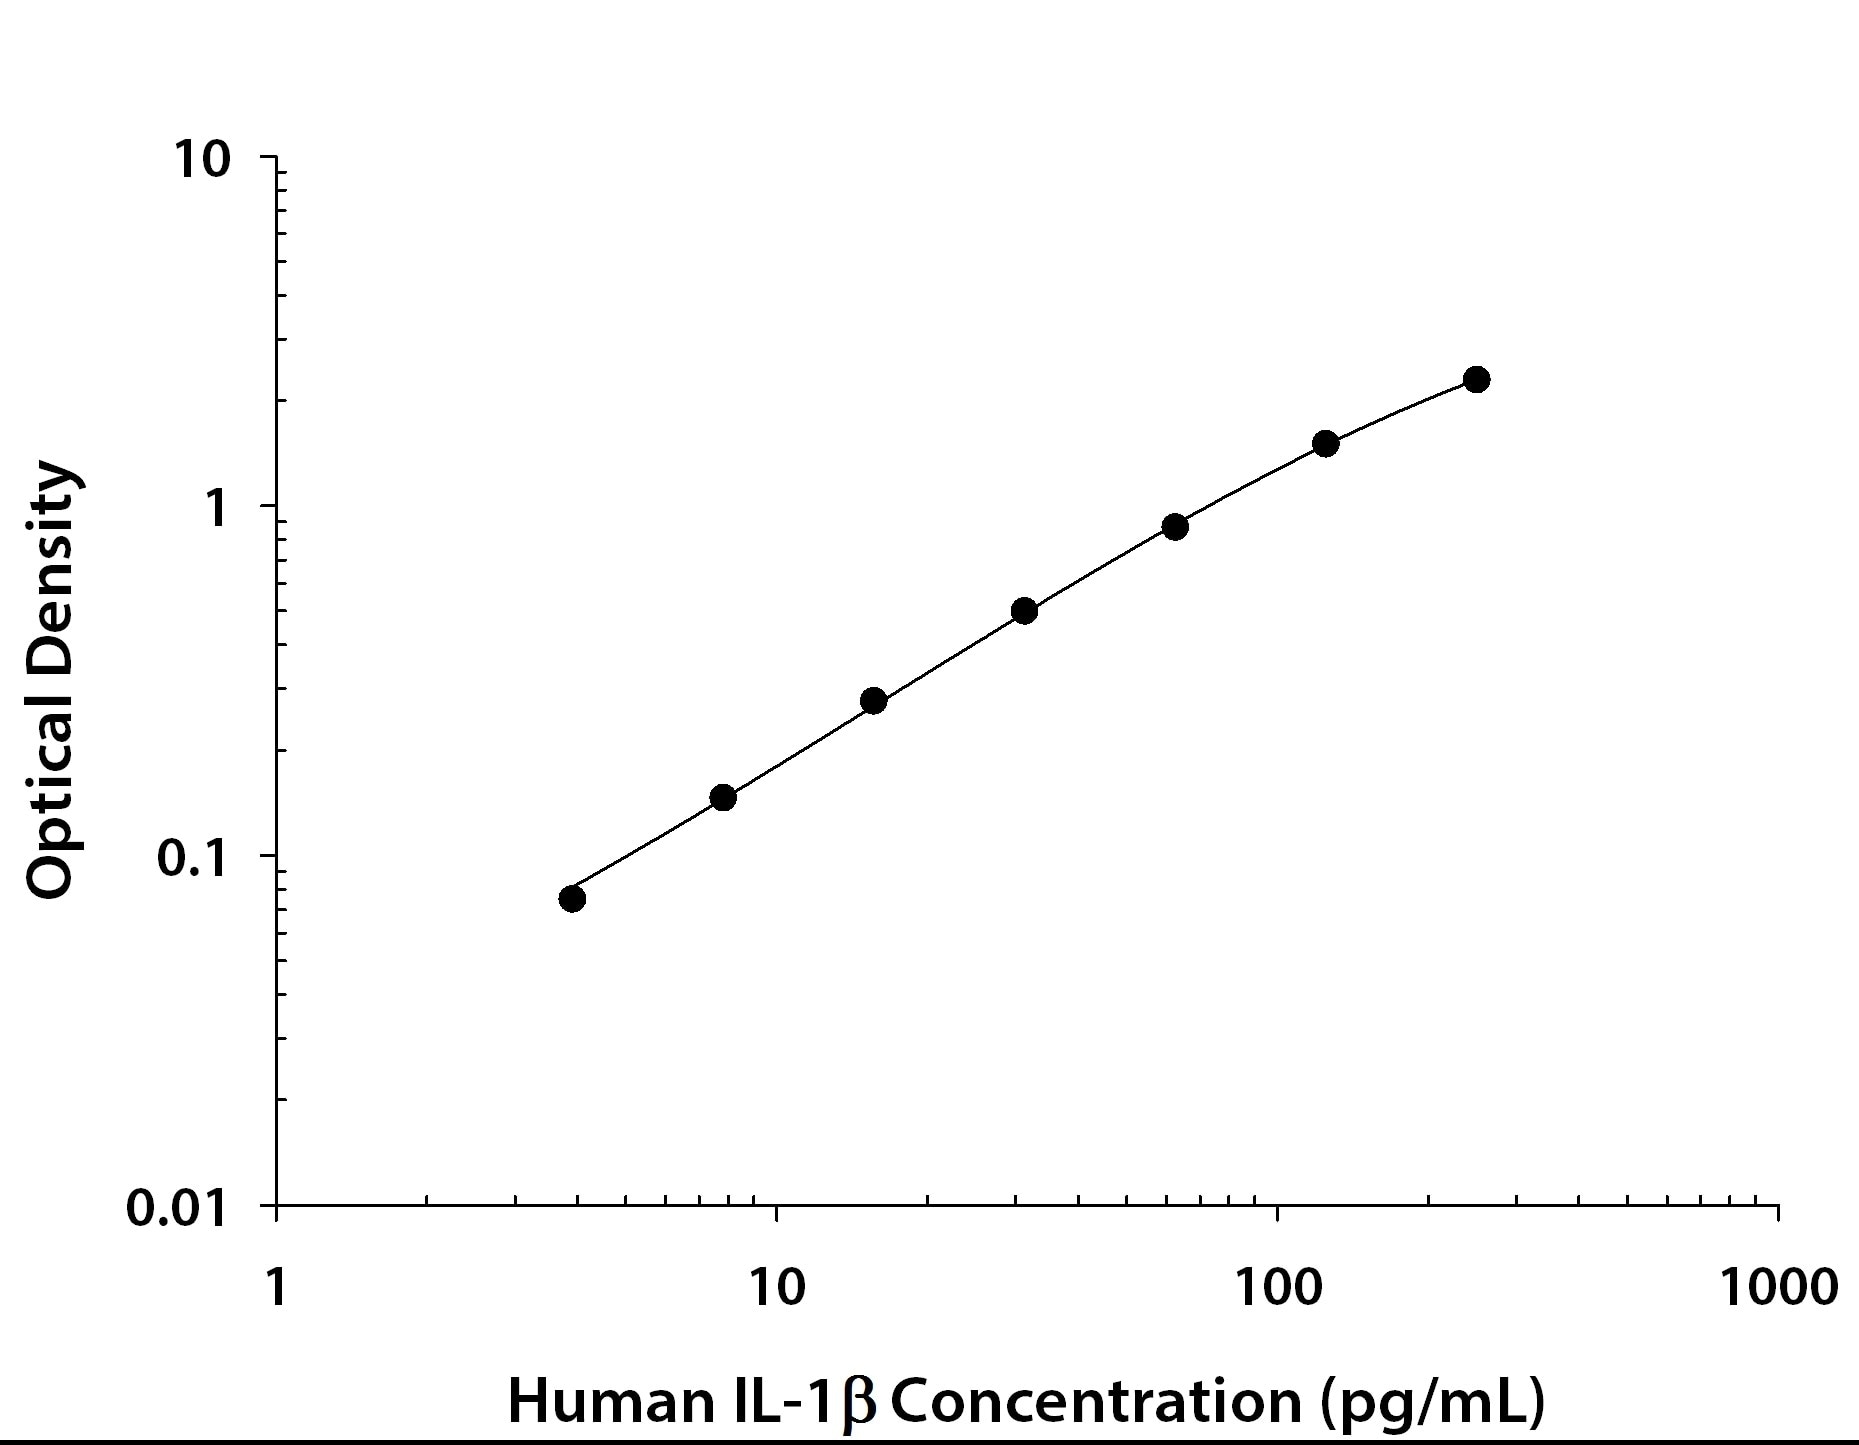
Human IL-1 beta / IL-1F2 ELISA Standard Curve
Recombinant Human IL‑1 beta /IL‑1F2 (Catalog # 201-LB) was serially diluted and captured by Mouse Anti-Human IL‑1 beta /IL‑1F2 Monoclonal Antibody (Catalog # MAB601) coated on a Clear Polystyrene Microplate (Catalog # DY990). Goat Anti-Human IL‑1 beta /IL‑1F2 Antigen Affinity-purified Polyclonal Antibody (Catalog # AF-201-NA) was biotinylated and incubated with the protein captured on the plate. Detection of the standard curve was achieved by incubating Streptavidin-HRP (Catalog # DY998)Applications for Human IL-1 beta/IL-1F2 Antibody (2805)
Immunocytochemistry
Sample: Immersion fixed human peripheral blood mononuclear cells and THP-1 human acute monocytic leukemia cell line untreated and treated with PMA and LPS
Simple Western
Sample: TF‑1 human erythroleukemic cell line
Western Blot
Sample: THP‑1 human acute monocytic leukemia cell line treated with PMA and LPS
Neutralization
Human IL-1 beta /IL-1F2 Sandwich Immunoassay
Reviewed Applications
Read 5 reviews rated 4 using MAB601 in the following applications:
Formulation, Preparation, and Storage
Purification
Reconstitution
Reconstitute at 0.5 mg/mL in sterile PBS. For liquid material, refer to CoA for concentration.
Formulation
Shipping
Stability & Storage
- 12 months from date of receipt, -20 to -70 °C as supplied.
- 1 month, 2 to 8 °C under sterile conditions after reconstitution.
- 6 months, -20 to -70 °C under sterile conditions after reconstitution.
Calculators
Background: IL-1 beta/IL-1F2
Long Name
Alternate Names
Entrez Gene IDs
Gene Symbol
Additional IL-1 beta/IL-1F2 Products
Product Documents for Human IL-1 beta/IL-1F2 Antibody (2805)
Certificate of Analysis
To download a Certificate of Analysis, please enter a lot or batch number in the search box below.
Note: Certificate of Analysis not available for kit components.
Product Specific Notices for Human IL-1 beta/IL-1F2 Antibody (2805)
This product is covered by one or more patents, including US Patent # 5,681,933.
For research use only
Related Research Areas
Citations for Human IL-1 beta/IL-1F2 Antibody (2805)
 Powered by Bioz
Customer Reviews for Human IL-1 beta/IL-1F2 Antibody (2805) (5)
Have you used Human IL-1 beta/IL-1F2 Antibody (2805)?
Submit a review and receive an Amazon gift card!
$25/€18/£15/$25CAN/¥2500 for a review with an image
$10/€7/£6/$10CAN/¥1110 for a review without an image
Submit a review
Customer Images
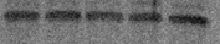
-
Application: Western BlotSample Tested: microglial cellsSpecies: HumanVerified Customer | Posted 08/12/2021

-
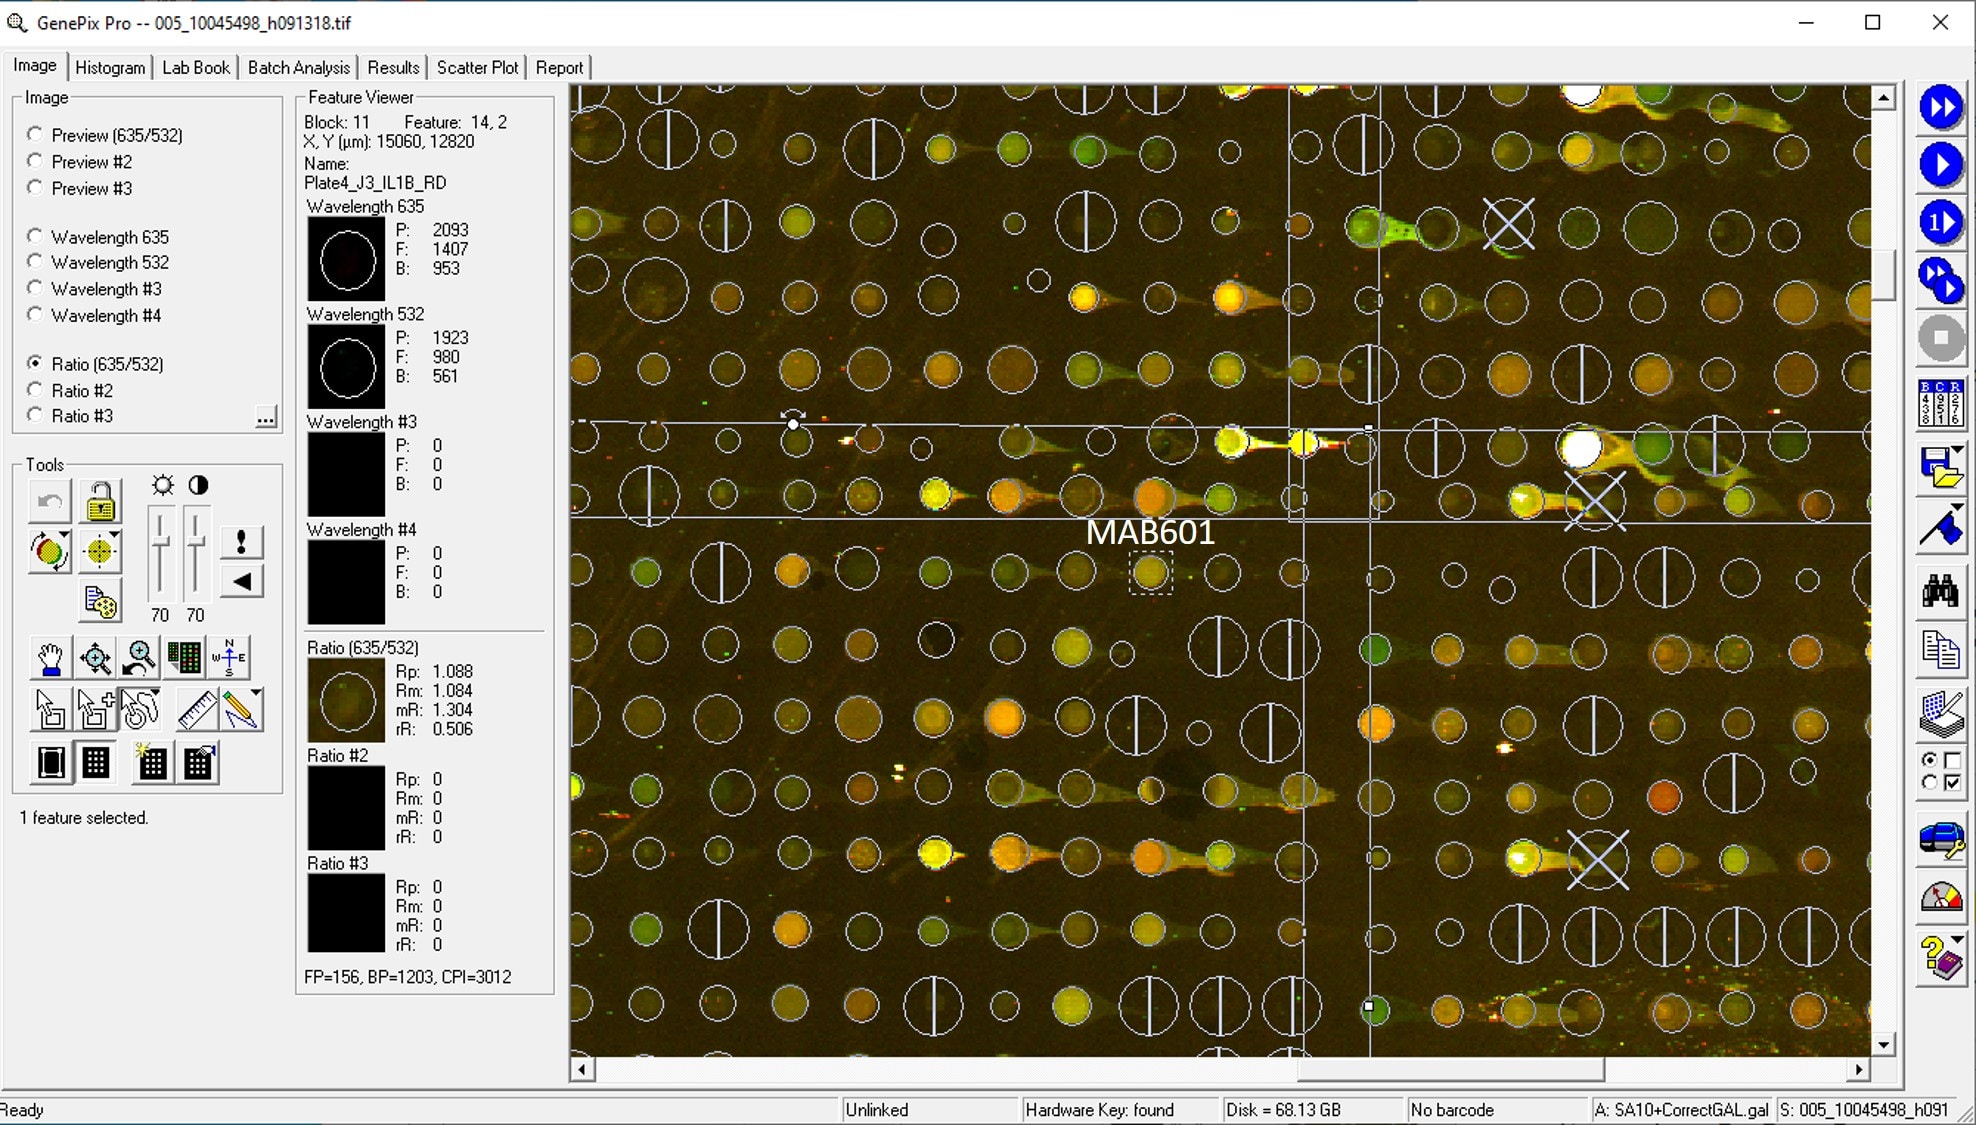
Application: MicroarraysSample Tested: EDTA PlasmaSpecies: HumanVerified Customer | Posted 06/10/2020
-
Application: MicroarraySample Tested: EDTA PlasmaSpecies: HumanVerified Customer | Posted 11/20/2018
-
Application: MicroarraysSample Tested: EDTA PlasmaSpecies: HumanVerified Customer | Posted 11/07/2018
-
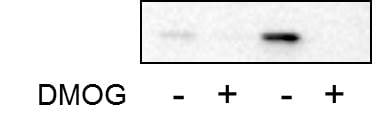
Application: Western BlotSample Tested: head and neck squamous cell carcinoma cellsSpecies: HumanVerified Customer | Posted 09/21/2018Human HNSCC cell lines FaDu and HN5 were treated with DMOG for 24 hours and the expression of IL-1beta was detected by western blot.
There are no reviews that match your criteria.
Protocols
Find general support by application which include: protocols, troubleshooting, illustrated assays, videos and webinars.
- Appropriate Fixation of IHC/ICC Samples
- Cellular Response to Hypoxia Protocols
- ClariTSA™ Fluorophore Kits
- Detection & Visualization of Antibody Binding
- ICC Cell Smear Protocol for Suspension Cells
- ICC Immunocytochemistry Protocol Videos
- ICC for Adherent Cells
- Immunocytochemistry (ICC) Protocol
- Immunocytochemistry Troubleshooting
- Immunofluorescence of Organoids Embedded in Cultrex Basement Membrane Extract
- Immunohistochemistry (IHC) and Immunocytochemistry (ICC) Protocols
- Preparing Samples for IHC/ICC Experiments
- Preventing Non-Specific Staining (Non-Specific Binding)
- Primary Antibody Selection & Optimization
- Protocol for VisUCyte™ HRP Polymer Detection Reagent
- Protocol for the Fluorescent ICC Staining of Cell Smears - Graphic
- Protocol for the Fluorescent ICC Staining of Cultured Cells on Coverslips - Graphic
- Protocol for the Preparation and Fluorescent ICC Staining of Cells on Coverslips
- Protocol for the Preparation and Fluorescent ICC Staining of Non-adherent Cells
- Protocol for the Preparation and Fluorescent ICC Staining of Stem Cells on Coverslips
- Protocol for the Preparation of a Cell Smear for Non-adherent Cell ICC - Graphic
- R&D Systems Quality Control Western Blot Protocol
- TUNEL and Active Caspase-3 Detection by IHC/ICC Protocol
- The Importance of IHC/ICC Controls
- Troubleshooting Guide: Western Blot Figures
- Western Blot Conditions
- Western Blot Protocol
- Western Blot Protocol for Cell Lysates
- Western Blot Troubleshooting
- Western Blot Troubleshooting Guide
- View all Protocols, Troubleshooting, Illustrated assays and Webinars
FAQs for Human IL-1 beta/IL-1F2 Antibody (2805)
-
Q: Can pro-IL-1 beta be detected by Catalog #s AF-201-NA and MAB601 ?
A: The amino acid sequence present in mature IL-1 beta (Ala117-Ser269) is also present in pro IL-1 beta. So in theory, both Catalog #s AF-201-NA and MAB601 should detect the pro form of IL-1 beta. The results would depend on whether the pro form is abundantly present in the sample type being evaluated.
Associated Pathways