
TrkA, the product of the proto-oncogene trk, is a member of the neurotrophic tyrosine kinase receptor family that has three members. TrkA, TrkB, and TrkC preferentially bind NGF, NT-4, and BDNF and NT-3, respectively. All Trk family proteins share a conserved complex subdomain organization consisting of a signal peptide, two cysteine-rich domains, a cluster of three leucine-rich motifs, and two immunoglobulin-like domains in the extracellular region, as well as an intracellular region that contains the tyrosine kinase domain. Two distinct rat TrkA isoforms (TrkA-I and Trk-A-II) that differ by a 6-amino acid insertion in their extracellular domain have been identified. The longer TrkA isoform is the only isoform expressed within neuronal tissues whereas the shorter TrkA-I is expressed mainly in non-neuronal tissues. NGF binds to TrkA with low affinity and activates its cytoplasmic kinase, initiating a signaling cascade that mediates neuronal survival and differentiation. Higher affinity binding of NGF requires the co-expression of TrkA with the p75 NGF receptor (NGF R), a member of the tumor necrosis factor receptor superfamily. NGF R binds all neurotrophins with low affinity and modulates Trk activity as well as alters the specificity of Trk receptors for their ligands. NGF R can also mediate cell death when expressed independent of Trk.

Scientific images may be resized, cropped, or adjusted for brightness or contrast for presentation purposes. These updates are limited to presentation and do not affect the underlying scientific interpretation of the data. Where available, additional source data may be provided upon request.
Key Product Details
Species Reactivity
Validated:
Cited:
Applications
Validated:
Cited:
Label
Antibody Source
Product Specifications
Immunogen
Ala33-Pro418
Accession # P35739
Specificity
Clonality
Host
Isotype
Scientific Data Images for Rat TrkA Antibody
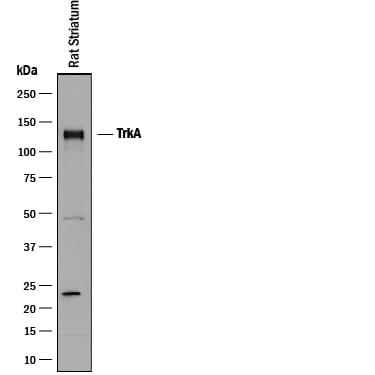
Detection of Rat TrkA by Western Blot.
Western blot shows lysate of rat striatum tissue. PVDF membrane was probed with 1 µg/mL of Goat Anti-Rat TrkA Antigen Affinity-purified Polyclonal Antibody (Catalog # AF1056) followed by HRP-conjugated Anti-Goat IgG Secondary Antibody (Catalog # HAF017). A specific band was detected for TrkA at approximately 140 kDa (as indicated). This experiment was conducted under reducing conditions and using Immunoblot Buffer Group 1.
TrkA in Rat Dorsal Root Ganglion.
TrkA was detected in perfusion fixed frozen sections of rat dorsal root ganglion using 15 µg/mL Rat TrkA Antigen Affinity-purified Polyclonal Antibody (Catalog # AF1056) overnight at 4 °C. Tissue was stained (red). View our protocol for Fluorescent IHC Staining of Frozen Tissue Sections.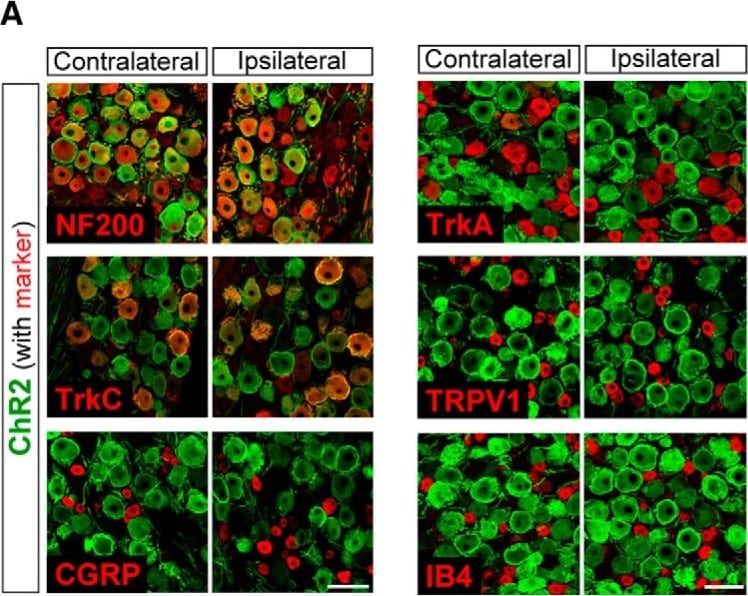
Detection of Porcine TrkA by Immunohistochemistry
Immunohistochemical characterization of ChR2-expressing DRG neurons. A, Immunolabeling of ChR2+ neurons (Venus; green) with either NF200, TrkC, CGRP, TrkA, TRPV1, or IB4 (red) in the L4 DRG contralateral and ipsilateral to PNI on day 14. B, Percentage of colocalization of each marker in ChR2+ DRG neurons [n = 4 rats (two to three slices per rat)]. Size-frequency histogram (inset) illustrating the distribution of the cross-sectional areas of ChR2+ NF200+ DRG neurons in the L4 DRG ipsilateral (371 cells) and contralateral (316 cells) to PNI on day 14. Values represent mean ± SEM. Scale bar: 100 μm. Image collected and cropped by CiteAb from the following open publication (https://pubmed.ncbi.nlm.nih.gov/29468190), licensed under a CC-BY license. Not internally tested by R&D Systems.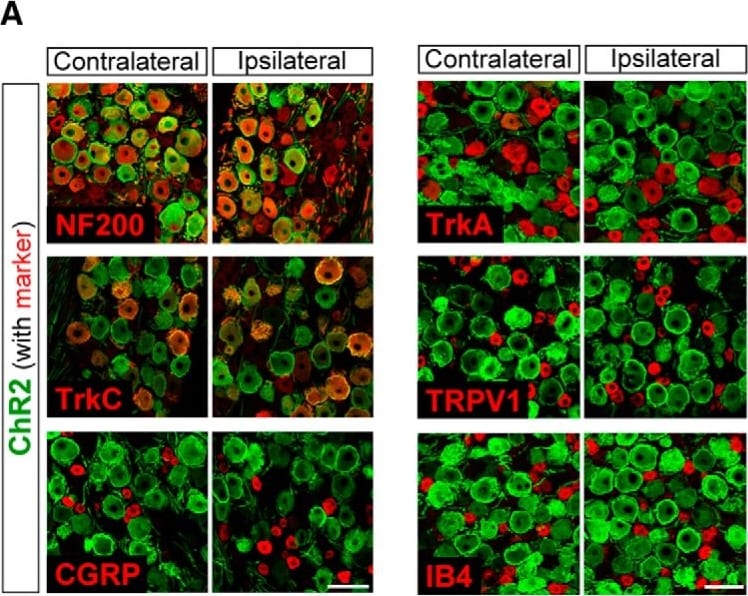
Detection of Rat TrkA by Immunohistochemistry
Immunohistochemical characterization of ChR2-expressing DRG neurons. A, Immunolabeling of ChR2+ neurons (Venus; green) with either NF200, TrkC, CGRP, TrkA, TRPV1, or IB4 (red) in the L4 DRG contralateral and ipsilateral to PNI on day 14. B, Percentage of colocalization of each marker in ChR2+ DRG neurons [n = 4 rats (two to three slices per rat)]. Size-frequency histogram (inset) illustrating the distribution of the cross-sectional areas of ChR2+ NF200+ DRG neurons in the L4 DRG ipsilateral (371 cells) and contralateral (316 cells) to PNI on day 14. Values represent mean ± SEM. Scale bar: 100 μm. Image collected and cropped by CiteAb from the following open publication (https://pubmed.ncbi.nlm.nih.gov/29468190), licensed under a CC-BY license. Not internally tested by R&D Systems.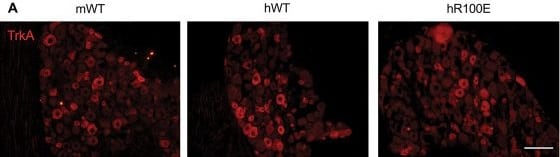
Detection of TrkA by Immunohistochemistry
Normal development of TrkA-expressing neurons in the L5 DRG and C peptidergic fibers in the sciatic nerve. Expression of the TrkA receptor (A) in mNGF-WT, hNGF-WT, and hNGF-R100E mouse DRG with no significant differences in the number of TrkA+ neurons between the mouse genotypes (B). Expression of CGRP (C) in the sciatic nerve of mNGF-WT, hNGF-WT, and hNGF-R100E mice. No significant differences in the proportion of CGRP fibers were found (D). Data are presented as mean ± SEM. Each dot represents one mouse. n = 4 to 5 mice/group. Scale bar = 100 μm. CGRP, calcitonin gene-related peptide; DRG, dorsal root ganglion; TrkA, tropomyosin receptor kinase A. Image collected and cropped by CiteAb from the following open publication (https://pubmed.ncbi.nlm.nih.gov/39324959), licensed under a CC-BY license. Not internally tested by R&D Systems.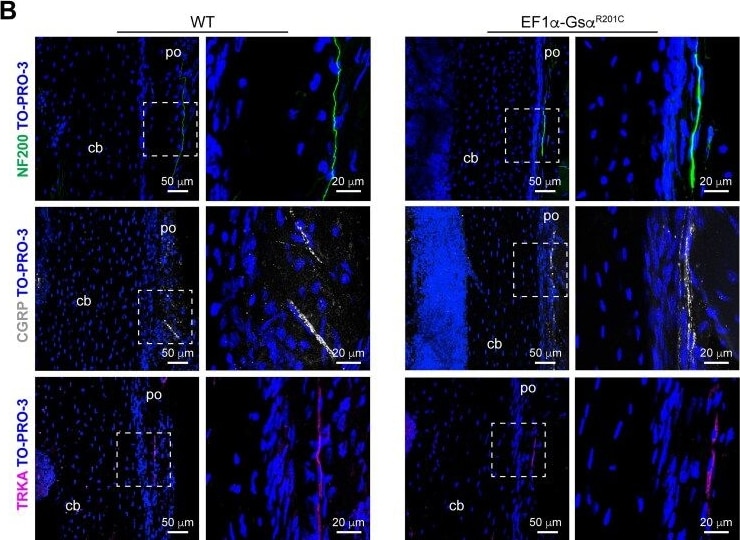
Detection of TrkA by Immunohistochemistry
Sensory nerve fibers in mouse FD lesions. (A) Representative confocal images of tibial FD lesions of EF1 alpha -Gs alpha R201C mice showing NF200, CGRP and TRKA-positive nerve fibers within the pathological fibrous tissue. (B) Confocal images of tibial periosteum of WT littermates and EF1 alpha -Gs alpha R201C mice immunostained with NF200, CGRP and TRKA antibodies showing similar representation of the different nerve markers in the 2 groups of mice. Abbreviations: po, periosteum; cb, cortical bone; ft, fibrous tissue; bt, bone trabecula. Image collected and cropped by CiteAb from the following open publication (https://pubmed.ncbi.nlm.nih.gov/40324210), licensed under a CC-BY license. Not internally tested by R&D Systems.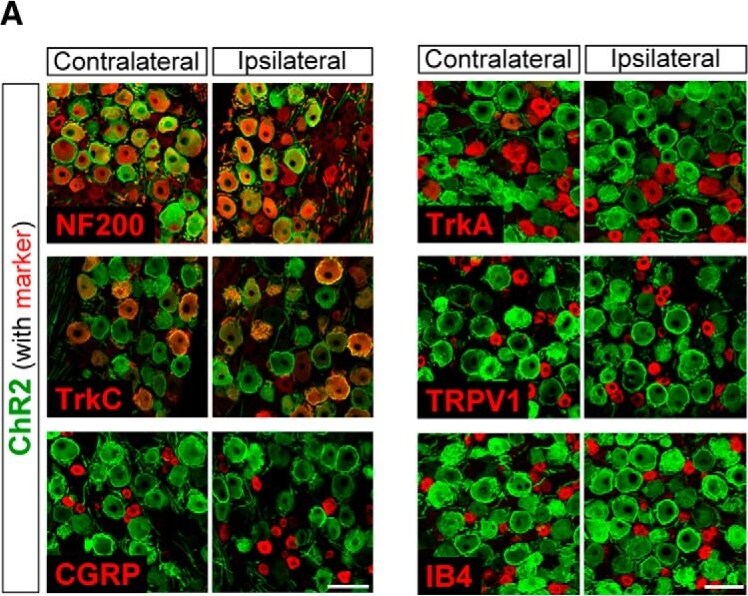
Detection of TrkA by Immunohistochemistry
Immunohistochemical characterization of ChR2-expressing DRG neurons. A, Immunolabeling of ChR2+ neurons (Venus; green) with either NF200, TrkC, CGRP, TrkA, TRPV1, or IB4 (red) in the L4 DRG contralateral and ipsilateral to PNI on day 14. B, Percentage of colocalization of each marker in ChR2+ DRG neurons [n = 4 rats (two to three slices per rat)]. Size-frequency histogram (inset) illustrating the distribution of the cross-sectional areas of ChR2+ NF200+ DRG neurons in the L4 DRG ipsilateral (371 cells) and contralateral (316 cells) to PNI on day 14. Values represent mean ± SEM. Scale bar: 100 μm. Image collected and cropped by CiteAb from the following open publication (https://www.eneuro.org/lookup/doi/10.1523/ENEURO.0450-17.2018), licensed under a CC-BY license. Not internally tested by R&D Systems.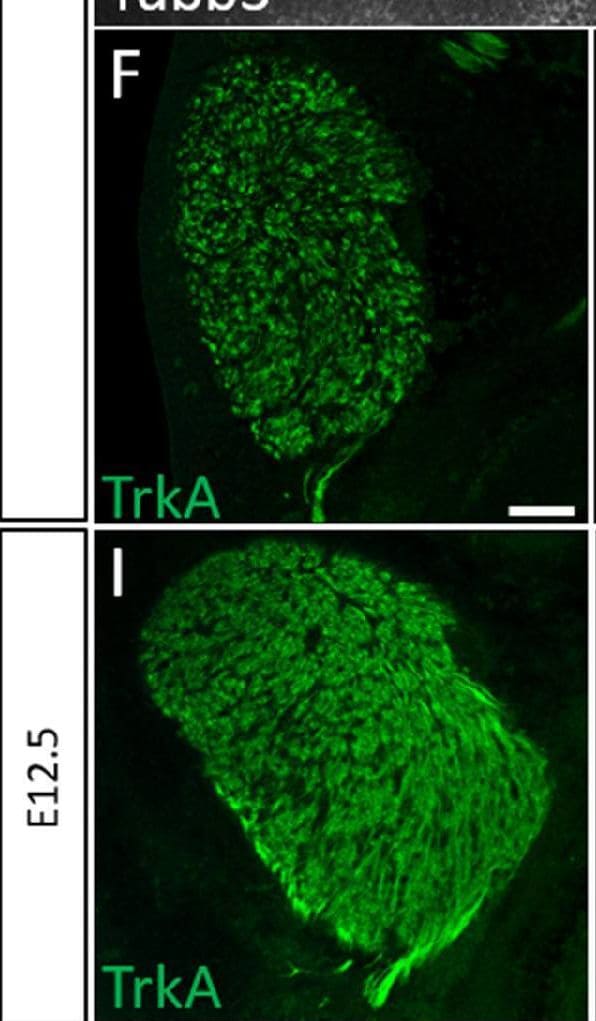
Detection of TrkA by Immunohistochemistry
Normal developmental Trk expression dynamics in the trigeminal ganglion and maxillary nerve.(A–C) Representative images of fluorescent immunohistochemistry on serial horizontal sections showing TrkA (A, green), TrkB (B, green), or TrkC (C, green) with Isl1 (A–C, purple) in Control embryos at embryonic day 11 (E11). Arrows point to the maxillary nerve (MxV). (D and E) Representative maximum intensity projections of confocal Z-stacks through the Control maxillary process at E11.5 after whole-mount immunohistochemistry to detect Tubb3 (D, white) and TrkA (E, white), followed by tissue clearing. (F–K) Representative images of fluorescent immunohistochemistry on serial horizontal sections showing TrkA (F and I, green), TrkB (G and J, green), or TrkC (H and K, green) in Control embryos at E11.5 (F–H) and E12.5 (I–K). Scale bars: 50 µm (A), applies to (B and C); 100 µm (D), applies to (E); 100 µm (F), applies to (G and K). Image collected and cropped by CiteAb from the following open publication (https://elifesciences.org/articles/71455), licensed under a CC-BY license. Not internally tested by R&D Systems.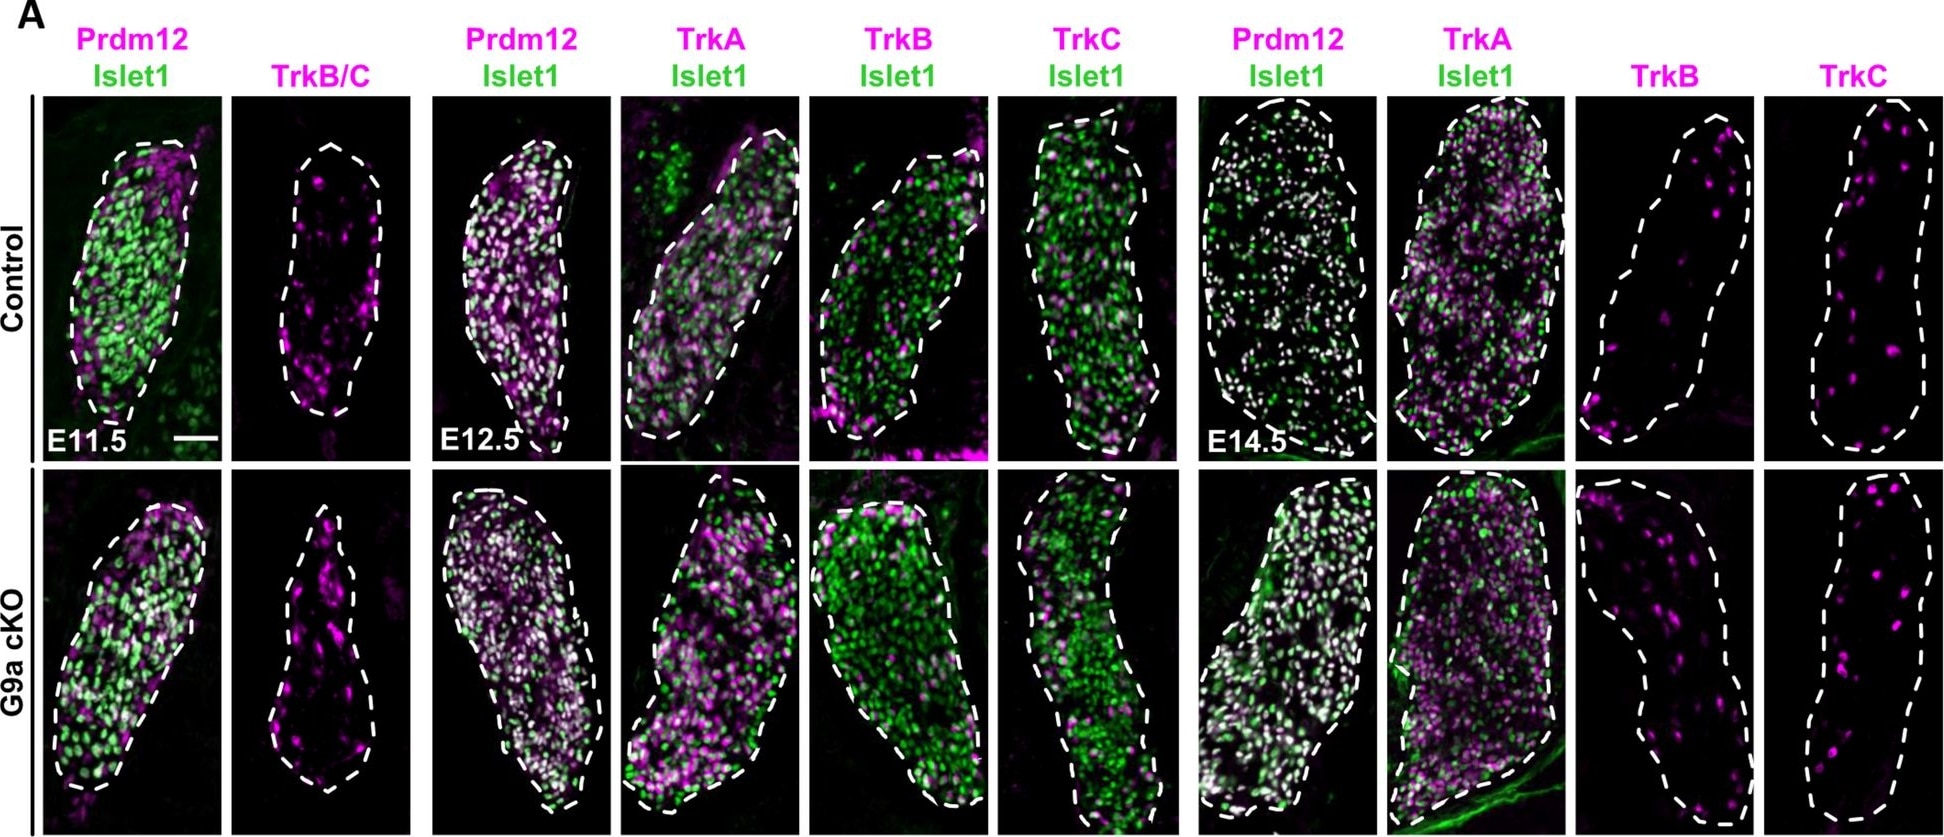
Detection of TrkA by Immunohistochemistry
Loss of G9a is dispensable for early sensory neuron development in dorsal root ganglia. A Double immunostainings with indicated markers on coronal sections through DRG of control or G9a cKO embryos at E11.5, E12.5 and E14.5. Scale bars, 50 μm. DRG are delineated by white dashed lines. B Quantification of embryonic DRG area comparing E14.5 control and G9a cKO embryos. Histograms are represented as mean ± SEM. Each dot represents the mean value obtained for an individual biological replicate. Mann-Whitney test. P-value, ns > 0.999. C Quantification of the mean number of cells positive for the indicated markers on DRG coronal sections of control or G9a cKO embryos at the indicated stages. Histograms are represented as mean ± SEM. Each dot represents the mean value obtained for an individual biological replicate. Mann-Whitney test. P-value, ns > 0.999. Image collected and cropped by CiteAb from the following open publication (https://neuraldevelopment.biomedcentral.com/articles/10.1186/s13064-023…), licensed under a CC-BY license. Not internally tested by R&D Systems.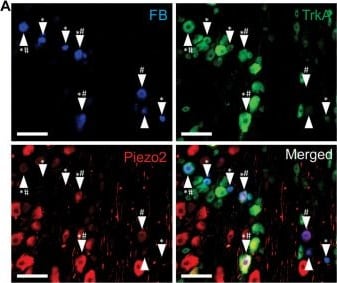
Detection of TrkA by Immunohistochemistry
Piezo2 knockdown prevents NGF-induced sensitization of A delta bone afferent neurons. (A) Retrograde labeling of bone afferent neurons (FB, blue, arrowheads) revealed that a substantial proportion of neurons that innervate bone express Piezo2 (red, hashes) and the NGF receptor TrkA (green, asterisks). Scale bars = 100 μm. (B) Frequency histogram showing that the majority of medium-sized bone afferent neurons expressed Piezo2, and that most Piezo2 expressing bone afferent neurons also expressed TrkA. (C) A significantly lower proportion of A delta bone afferent neurons were sensitized (increased discharge frequencies) by NGF in Piezo2 antisense treated animals compared to mismatch control animals [chi-square test, X2 (1, N = 32) = 10.86,*P < 0.05, n = 15 mismatch/17 antisense, N = 8 mismatch/9 antisense]. (D) A significantly lower proportion of A delta bone afferent neurons were sensitized (lower thresholds for activation) by NGF in Piezo2 antisense treated animals compared to mismatch control animals (chi-square test, X2 (1, N = 32) = 7.069,*P < 0.05, n = 15 mismatch/17 antisense, N = 8 mismatch/9 antisense). Image collected and cropped by CiteAb from the following open publication (https://pubmed.ncbi.nlm.nih.gov/34335288), licensed under a CC-BY license. Not internally tested by R&D Systems.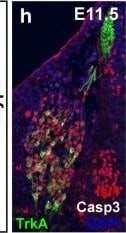
Detection of TrkA by Immunohistochemistry
Premature differentiation and aberrant cell death of Trk-positive neuronal subtypes in the DRG of Wnt1-Cre; Mib1fl/fl embryos (a–f). Transverse serial sections over the forelimb of wildtype and Wnt1-Cre; Mib1fl/fl embryos at E10.5 co-immunostained for the neuronal marker Isl1, cell death marker cleaved-Caspase 3 (Casp3), and the neurotrophin receptors TrkA (a, b), TrkB (c, d) and TrkC (e, f). Scale bar = 20 μm. g Quantitation of Trk and Isl1-double-positive cell bodies per DRG at E10.5. Number represents mean of n = 3 embryos, with 8 individual sections counted per embryo. *p < 0.05, **p < 0.01, ****p < 0.0001. h–m Transverse serial sections over the forelimb of wildtype and Wnt1-Cre; Mib1fl/fl embryos at E11.5 co-immunostained for Isl1, Casp3, and TrkA (h, i), TrkB (j, k) and TrkC (l, m). Scale bar = 20 μm. n Quantitation of Trk and Isl1-double-positive cell bodies per DRG at E11.5. Number represents mean of n = 3 embryos, with 8 individual sections counted per embryo, ns not significant, *p < 0.05, ****p < 0.0001. Image collected and cropped by CiteAb from the following open publication (https://pubmed.ncbi.nlm.nih.gov/31036074), licensed under a CC-BY license. Not internally tested by R&D Systems.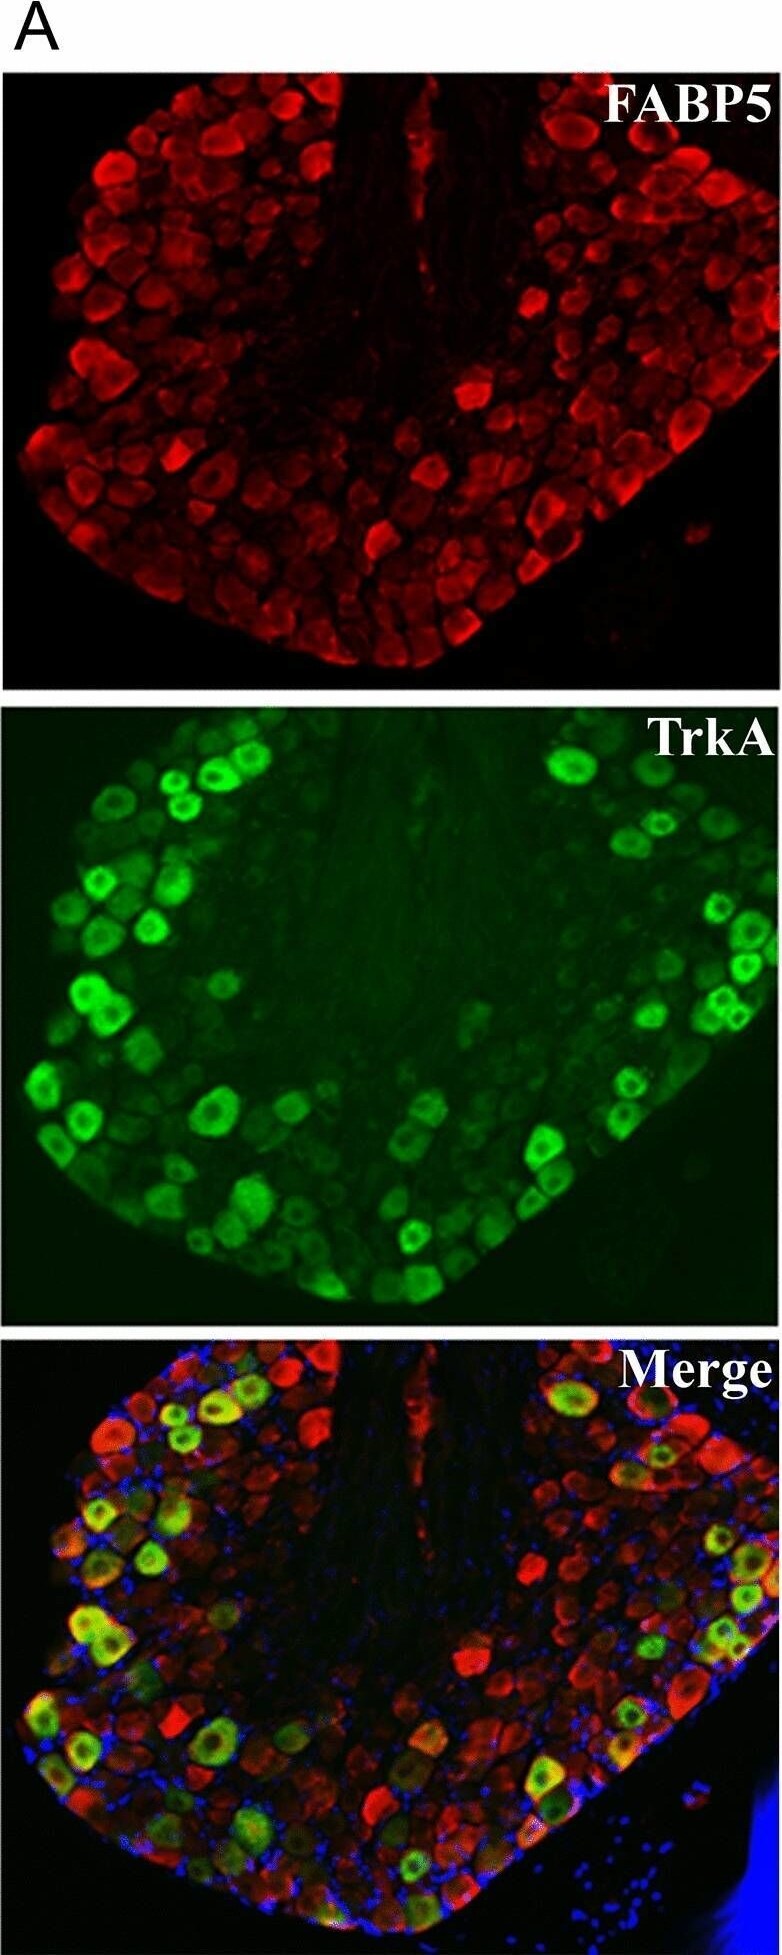
Detection of TrkA by Immunohistochemistry
Co-expression of FABP5 with (A) TrkA and (B) CB1 in DRG neurons. Representative images of FABP5, CB1, and TrkA distribution in L4-L5 DRGs. DAPI is shown in blue. Image collected and cropped by CiteAb from the following open publication (https://www.nature.com/articles/s41598-022-13284-0), licensed under a CC-BY license. Not internally tested by R&D Systems.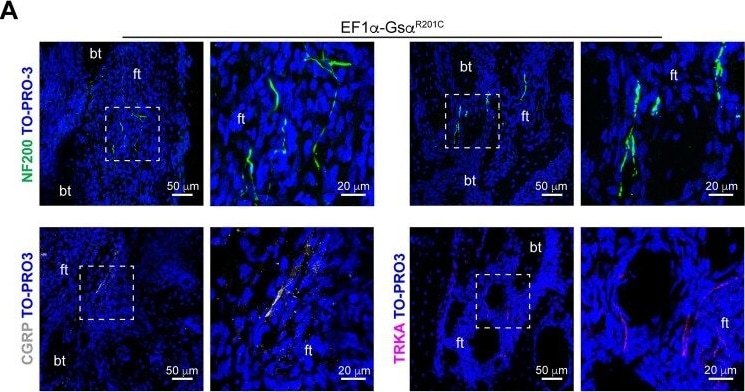
Detection of TrkA by Immunohistochemistry
Sensory nerve fibers in mouse FD lesions. (A) Representative confocal images of tibial FD lesions of EF1 alpha -Gs alpha R201C mice showing NF200, CGRP and TRKA-positive nerve fibers within the pathological fibrous tissue. (B) Confocal images of tibial periosteum of WT littermates and EF1 alpha -Gs alpha R201C mice immunostained with NF200, CGRP and TRKA antibodies showing similar representation of the different nerve markers in the 2 groups of mice. Abbreviations: po, periosteum; cb, cortical bone; ft, fibrous tissue; bt, bone trabecula. Image collected and cropped by CiteAb from the following open publication (https://pubmed.ncbi.nlm.nih.gov/40324210), licensed under a CC-BY license. Not internally tested by R&D Systems.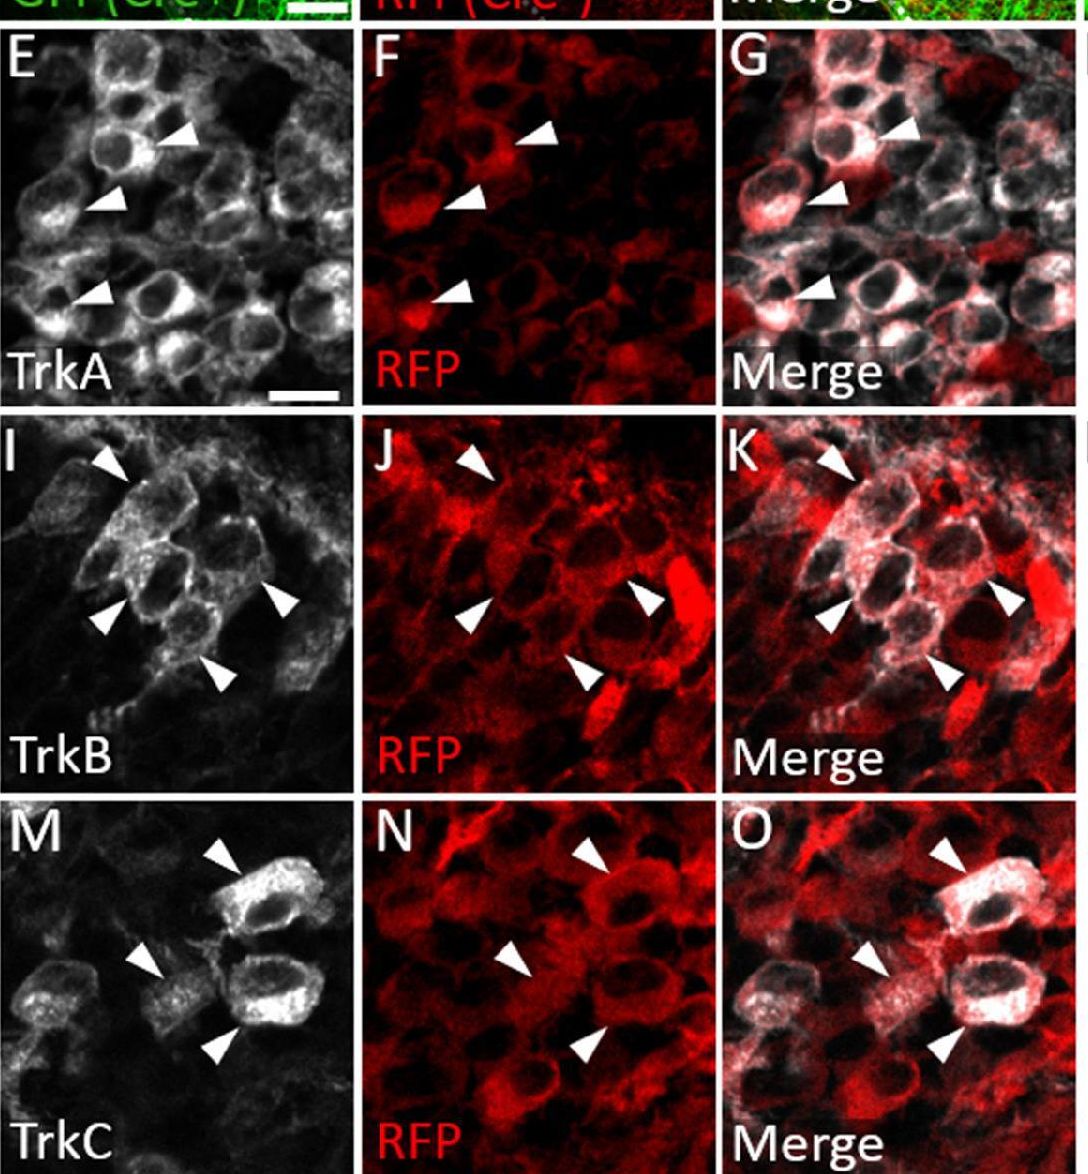
Detection of TrkA by Immunohistochemistry
Neural crest-derived trigeminal ganglion neurons are biased to a TrkA fate, while placodal neurons express TrkB or TrkC.(A–D) Representative images of fluorescent immunohistochemistry at embryonic day (E15.5) showing red fluorescent protein (RFP; B–D) with native green fluorescent protein (GFP) fluorescence indicating Wnt1-Cre-mediated recombination (A, C and D) in horizontal sections through the maxillary lobe of the trigeminal ganglion in Wnt1-Cre; ROSAmT/mG reporters. (D) Higher magnification of box in C. Arrowheads point to RFP-positive, non-recombined neurons. (E–G, I–K, and M–O) Fluorescent immunohistochemistry on serial sections through the maxillary lobe of Wnt1-Cre; ROSAmT-mG reporters (n=3) showing TrkA (E and G, white), TrkB (I and K, white), or TrkC (M and O, white) with RFP (F, G, J, K, N, and O, red). Arrowheads point to neurons that express RFP and TrkA (E–G), TrkB (I–K), or TrkC (M–O). (H, L and P) Quantification of the percentage of neurons expressing TrkA (H), TrkB (L), or TrkC (P) that also co-express RFP at E15.5 (n=3). Scale bars: 100 µm (A), applies to (B–C); 20 µm (D); 10 µm (E), applies to (F, G, I–K, and M–O). Refer to Figure 8—source data 1 for quantitative summary data represented in graphs.Figure 8—source data 1.Neural crest-derived trigeminal ganglion neurons are biased to a TrkA fate, while placodal neurons express TrkB or TrkC.Neural crest-derived trigeminal ganglion neurons are biased to a TrkA fate, while placodal neurons express TrkB or TrkC. Image collected and cropped by CiteAb from the following open publication (https://elifesciences.org/articles/71455), licensed under a CC-BY license. Not internally tested by R&D Systems.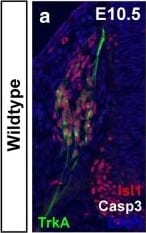
Detection of TrkA by Immunohistochemistry
Premature differentiation and aberrant cell death of Trk-positive neuronal subtypes in the DRG of Wnt1-Cre; Mib1fl/fl embryos (a–f). Transverse serial sections over the forelimb of wildtype and Wnt1-Cre; Mib1fl/fl embryos at E10.5 co-immunostained for the neuronal marker Isl1, cell death marker cleaved-Caspase 3 (Casp3), and the neurotrophin receptors TrkA (a, b), TrkB (c, d) and TrkC (e, f). Scale bar = 20 μm. g Quantitation of Trk and Isl1-double-positive cell bodies per DRG at E10.5. Number represents mean of n = 3 embryos, with 8 individual sections counted per embryo. *p < 0.05, **p < 0.01, ****p < 0.0001. h–m Transverse serial sections over the forelimb of wildtype and Wnt1-Cre; Mib1fl/fl embryos at E11.5 co-immunostained for Isl1, Casp3, and TrkA (h, i), TrkB (j, k) and TrkC (l, m). Scale bar = 20 μm. n Quantitation of Trk and Isl1-double-positive cell bodies per DRG at E11.5. Number represents mean of n = 3 embryos, with 8 individual sections counted per embryo, ns not significant, *p < 0.05, ****p < 0.0001. Image collected and cropped by CiteAb from the following open publication (https://pubmed.ncbi.nlm.nih.gov/31036074), licensed under a CC-BY license. Not internally tested by R&D Systems.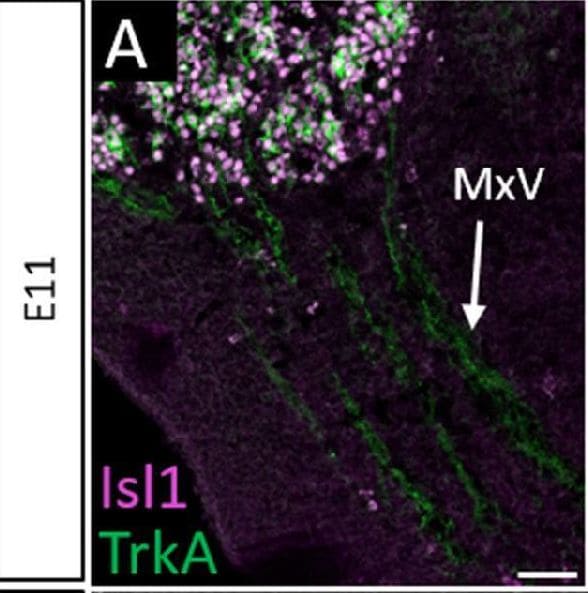
Detection of TrkA by Immunohistochemistry
Normal developmental Trk expression dynamics in the trigeminal ganglion and maxillary nerve.(A–C) Representative images of fluorescent immunohistochemistry on serial horizontal sections showing TrkA (A, green), TrkB (B, green), or TrkC (C, green) with Isl1 (A–C, purple) in Control embryos at embryonic day 11 (E11). Arrows point to the maxillary nerve (MxV). (D and E) Representative maximum intensity projections of confocal Z-stacks through the Control maxillary process at E11.5 after whole-mount immunohistochemistry to detect Tubb3 (D, white) and TrkA (E, white), followed by tissue clearing. (F–K) Representative images of fluorescent immunohistochemistry on serial horizontal sections showing TrkA (F and I, green), TrkB (G and J, green), or TrkC (H and K, green) in Control embryos at E11.5 (F–H) and E12.5 (I–K). Scale bars: 50 µm (A), applies to (B and C); 100 µm (D), applies to (E); 100 µm (F), applies to (G and K). Image collected and cropped by CiteAb from the following open publication (https://elifesciences.org/articles/71455), licensed under a CC-BY license. Not internally tested by R&D Systems.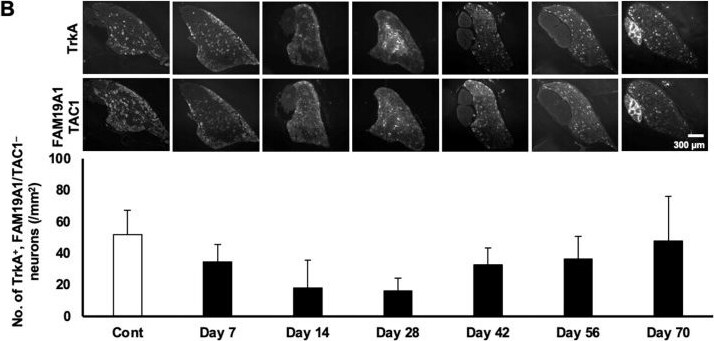
Detection of TrkA by Immunocytochemistry/ Immunofluorescence
Temporal downregulation and subsequent recovery of the number of neuronal subpopulations. (A) Representative images of NF staining in each time point (upper) and the average number of NF-positive neurons (lower). p = 0.002; F = 6.46. (B) Representative images of TrkA and FAM19A1/TAC1 staining at each time point (upper) and the average number of TrkA-positive with FAM19A1/TAC1-negative neurons (lower). p = 0.125, F = 2.05. (C) Representative images of SST staining at each time point (upper) and the average number of SST-positive neurons (lower). p = 0.00059; F = 8.77. (D) Representative images of TAC staining at each time point (upper) and the average number of TAC-positive neurons (lower). p = 0.073; F = 2.51. (E) Representative images of TrkA and FAM19A1 staining at each time point (upper) and the average number of TrkA- and FAM19A1-double-positive neurons (lower). p = 0.018; F = 3.83. The scale bars apply to all corresponding images. Data are shown as mean ± SD (n = 3). One-way ANOVA with post hoc Tukey–Kramer test. The degrees of freedom were 20 (total), 6 (between groups), and 14 (error variance) for all analyses. The corresponding p-values and F-values are shown in each figure legend. * p < 0.05 and ** p < 0.01 compared with control; + p < 0.05 and ++ p < 0.01 compared with Day 14, respectively, unless otherwise specified. Image collected and cropped by CiteAb from the following open publication (https://www.mdpi.com/1422-0067/27/1/116), licensed under a CC-BY license. Not internally tested by R&D Systems.Applications for Rat TrkA Antibody
Immunohistochemistry
Sample: Perfusion fixed frozen sections of rat dorsal root ganglion
Western Blot
Sample: Rat striatum
Reviewed Applications
Read 2 reviews rated 4.5 using AF1056 in the following applications:
Formulation, Preparation, and Storage
Purification
Reconstitution
Reconstitute at 0.2 mg/mL in sterile PBS. For liquid material, refer to CoA for concentration.
Formulation
Shipping
Stability & Storage
- 12 months from date of receipt, -20 to -70 °C as supplied.
- 1 month, 2 to 8 °C under sterile conditions after reconstitution.
- 6 months, -20 to -70 °C under sterile conditions after reconstitution.
Calculators
Background: TrkA
References
- Esposito, D. et al. (2001) J. Biol. Chem. 276:32687.
- Sofroniew, M.V. et al. (2001) Annu. Rev. Neurosci. 24:1217.
Long Name
Alternate Names
Gene Symbol
UniProt
Additional TrkA Products
Product Documents for Rat TrkA Antibody
Certificate of Analysis
To download a Certificate of Analysis, please enter a lot or batch number in the search box below.
Note: Certificate of Analysis not available for kit components.
Product Specific Notices for Rat TrkA Antibody
For research use only
Related Research Areas
Citations for Rat TrkA Antibody
 Powered by Bioz
Customer Reviews for Rat TrkA Antibody (2)
Have you used Rat TrkA Antibody?
Submit a review and receive an Amazon gift card!
$25/€18/£15/$25CAN/¥2500 for a review with an image
$10/€7/£6/$10CAN/¥1110 for a review without an image
Submit a review
Customer Images
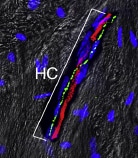
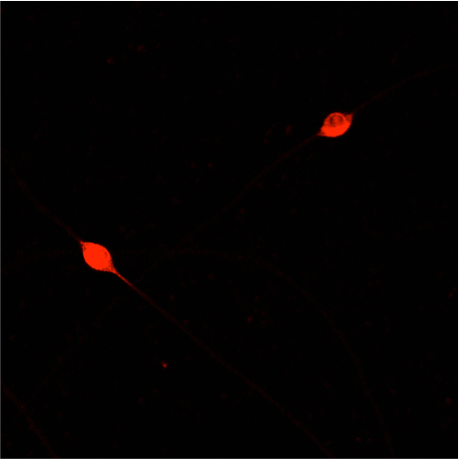
-
Application: Immunocytochemistry/ImmunofluorescenceSample Tested: Bone ExtractsSpecies: MouseVerified Customer | Posted 10/31/2020

-
Application: Immunocytochemistry/ImmunofluorescenceSample Tested: E12 DRG neuronsSpecies: MouseVerified Customer | Posted 11/22/2019E12 mouse DRG neurons grown overnight with 10ng/ml NGF, then fixed in 4% PFA, blocked for 1 h with 5% BSA, and incubated overnight in 1% BSA containing AF1056 (1:300). A fluorophore-conjugated secondary antibody was used to visualise reactivity.
There are no reviews that match your criteria.
Protocols
Find general support by application which include: protocols, troubleshooting, illustrated assays, videos and webinars.
- Antigen Retrieval Protocol (PIER)
- Antigen Retrieval for Frozen Sections Protocol
- Appropriate Fixation of IHC/ICC Samples
- Cellular Response to Hypoxia Protocols
- Chromogenic IHC Staining of Formalin-Fixed Paraffin-Embedded (FFPE) Tissue Protocol
- Chromogenic Immunohistochemistry Staining of Frozen Tissue
- ClariTSA™ Fluorophore Kits
- Detection & Visualization of Antibody Binding
- Fluorescent IHC Staining of Frozen Tissue Protocol
- Graphic Protocol for Heat-induced Epitope Retrieval
- Graphic Protocol for the Preparation and Fluorescent IHC Staining of Frozen Tissue Sections
- Graphic Protocol for the Preparation and Fluorescent IHC Staining of Paraffin-embedded Tissue Sections
- Graphic Protocol for the Preparation of Gelatin-coated Slides for Histological Tissue Sections
- IHC Sample Preparation (Frozen sections vs Paraffin)
- Immunofluorescent IHC Staining of Formalin-Fixed Paraffin-Embedded (FFPE) Tissue Protocol
- Immunohistochemistry (IHC) and Immunocytochemistry (ICC) Protocols
- Immunohistochemistry Frozen Troubleshooting
- Immunohistochemistry Paraffin Troubleshooting
- Preparing Samples for IHC/ICC Experiments
- Preventing Non-Specific Staining (Non-Specific Binding)
- Primary Antibody Selection & Optimization
- Protocol for Heat-Induced Epitope Retrieval (HIER)
- Protocol for Making a 4% Formaldehyde Solution in PBS
- Protocol for VisUCyte™ HRP Polymer Detection Reagent
- Protocol for the Preparation & Fixation of Cells on Coverslips
- Protocol for the Preparation and Chromogenic IHC Staining of Frozen Tissue Sections
- Protocol for the Preparation and Chromogenic IHC Staining of Frozen Tissue Sections - Graphic
- Protocol for the Preparation and Chromogenic IHC Staining of Paraffin-embedded Tissue Sections
- Protocol for the Preparation and Chromogenic IHC Staining of Paraffin-embedded Tissue Sections - Graphic
- Protocol for the Preparation and Fluorescent IHC Staining of Frozen Tissue Sections
- Protocol for the Preparation and Fluorescent IHC Staining of Paraffin-embedded Tissue Sections
- Protocol for the Preparation of Gelatin-coated Slides for Histological Tissue Sections
- R&D Systems Quality Control Western Blot Protocol
- TUNEL and Active Caspase-3 Detection by IHC/ICC Protocol
- The Importance of IHC/ICC Controls
- Troubleshooting Guide: Immunohistochemistry
- Troubleshooting Guide: Western Blot Figures
- Western Blot Conditions
- Western Blot Protocol
- Western Blot Protocol for Cell Lysates
- Western Blot Troubleshooting
- Western Blot Troubleshooting Guide
- View all Protocols, Troubleshooting, Illustrated assays and Webinars
Associated Pathways

