ATF6 Antibody (70B1413.1) - BSA Free
Novus Biologicals | Catalog # NBP1-40256
 [NBP1-40256] -")
Key Product Details
Validated by
Species Reactivity
Validated:
Cited:
Applications
Validated:
Cited:
Label
Antibody Source
Format
Product Specifications
Immunogen
Reactivity Notes
Specificity
Clonality
Host
Isotype
Description
(2) The ATF6 transfected cell lysate (40210) is recommended as a useful western blot positive control to run in parallel with your experimental samples.
(3) Active/cleaved forms of ATF6 are generated through proteolytic cleavage during ER stress. Different molecular weights have been described for cleaved forms. A sample protocol was first described in Luo and Lee (2002) wherein NIH3T3 cells were treated with the amino acid analogue azetidine (AzC), and full-length and cleaved forms ATF6 were detected with IMG-273. The results show that in addition to the major 90 kDa full length ATF6, protein bands over the range of 50-70 kDa were detectable following AzC treatment (Luo and Lee, 2002: Figure 4A, page 791). Many protocols and other cleaved forms have been described since, please consult the literature for additional information.
(4) For immunofluorescence microscopy, cells were fixed in methanol at -20 degrees C (Thomas et al, 2005). Thomas et al used immunofluorescence to identify ATF6 with IMG-273 in the nucleus.
(5) The active/cleaved 50 kDa nuclear form of ATF6 using IMG-273 has been found to be strongly expressed in certain tumor cell lines derived from B cell lymphoma (DEL), primary effusion lymphoma [BC-3 (ATCC CRL-2277), PEL-SY, HBL-6], lymphoblastic leukemia (DS-1) and multiple myeloma (RPMI-8226, NCI-H929), (Jenner et al. 2003).
(6) Cleaved 60 and 36 kDa ATF6 forms have also been described in the nucleus (Mao et al, 2007).
(7) The ATF6 antibody is reported to be specific for ATF6a, recognizing ATF6a but not ATF6b (Bommiasamy et al, 2009).
(8) In western blots, the binding pattern of ATF6 may vary. Researchers are encouraged to consult the body of literature citing the ATF6 IMG-273 antibody (see Product citation list) for additional information. General ATF6 literature is also helpful. For example, Yoshida (1998) show a multiple band pattern in HeLa in both untreated and stressed cells (Fig 11B). In this early landmark ATF6 publication, multiple bands were seen between the 66 and 116 kDa markers as well as one or more bands between the 45 and 66 kDa markers.
(9) We highly recommend the use of a maximum sensitivity ECL substrate (Femto sensitive) for efficient detection of this antibody in Western blot applications.
Scientific Data Images for ATF6 Antibody (70B1413.1) - BSA Free
![Western Blot: ATF6 Antibody (70B1413.1)BSA Free [NBP1-40256]](https://resources.rndsystems.com/images/products/ATF6-Antibody-70B1413-1-Western-Blot-NBP1-40256-img0005.jpg "Western Blot: ATF6 Antibody (70B1413.1)BSA Free [NBP1-40256]")
Western Blot: ATF6 Antibody (70B1413.1)BSA Free [NBP1-40256]
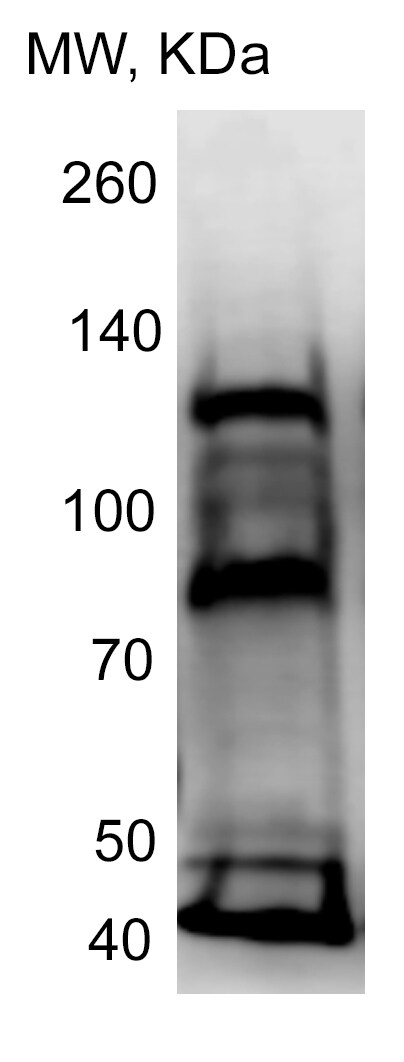
Western Blot: ATF6 Antibody (70B1413.1) [NBP1-40256] - Analysis of ATF6 in mouse liver tissue using 3 ug/ml of ATF6 antibody and 0.25 ug/ml of GAPDH antibody. Lane A contains 20 ugs of whole mouse liver lysate, lane B contains 20 ugs of total ER fraction, and lane C contains 20 ugs of rough ER fraction. The ATF6 band may represent under glycosylated or cleaved/active ATF6.![Immunocytochemistry/ Immunofluorescence: ATF6 Antibody (70B1413.1) - BSA Free [NBP1-40256]](https://resources.rndsystems.com/images/products/ATF6-Antibody-70B1413-1-Immunocytochemistry-Immunofluorescence-NBP1-40256-img0014.jpg "Immunocytochemistry/ Immunofluorescence: ATF6 Antibody (70B1413.1) - BSA Free [NBP1-40256]")
Immunocytochemistry/ Immunofluorescence: ATF6 Antibody (70B1413.1) - BSA Free [NBP1-40256]
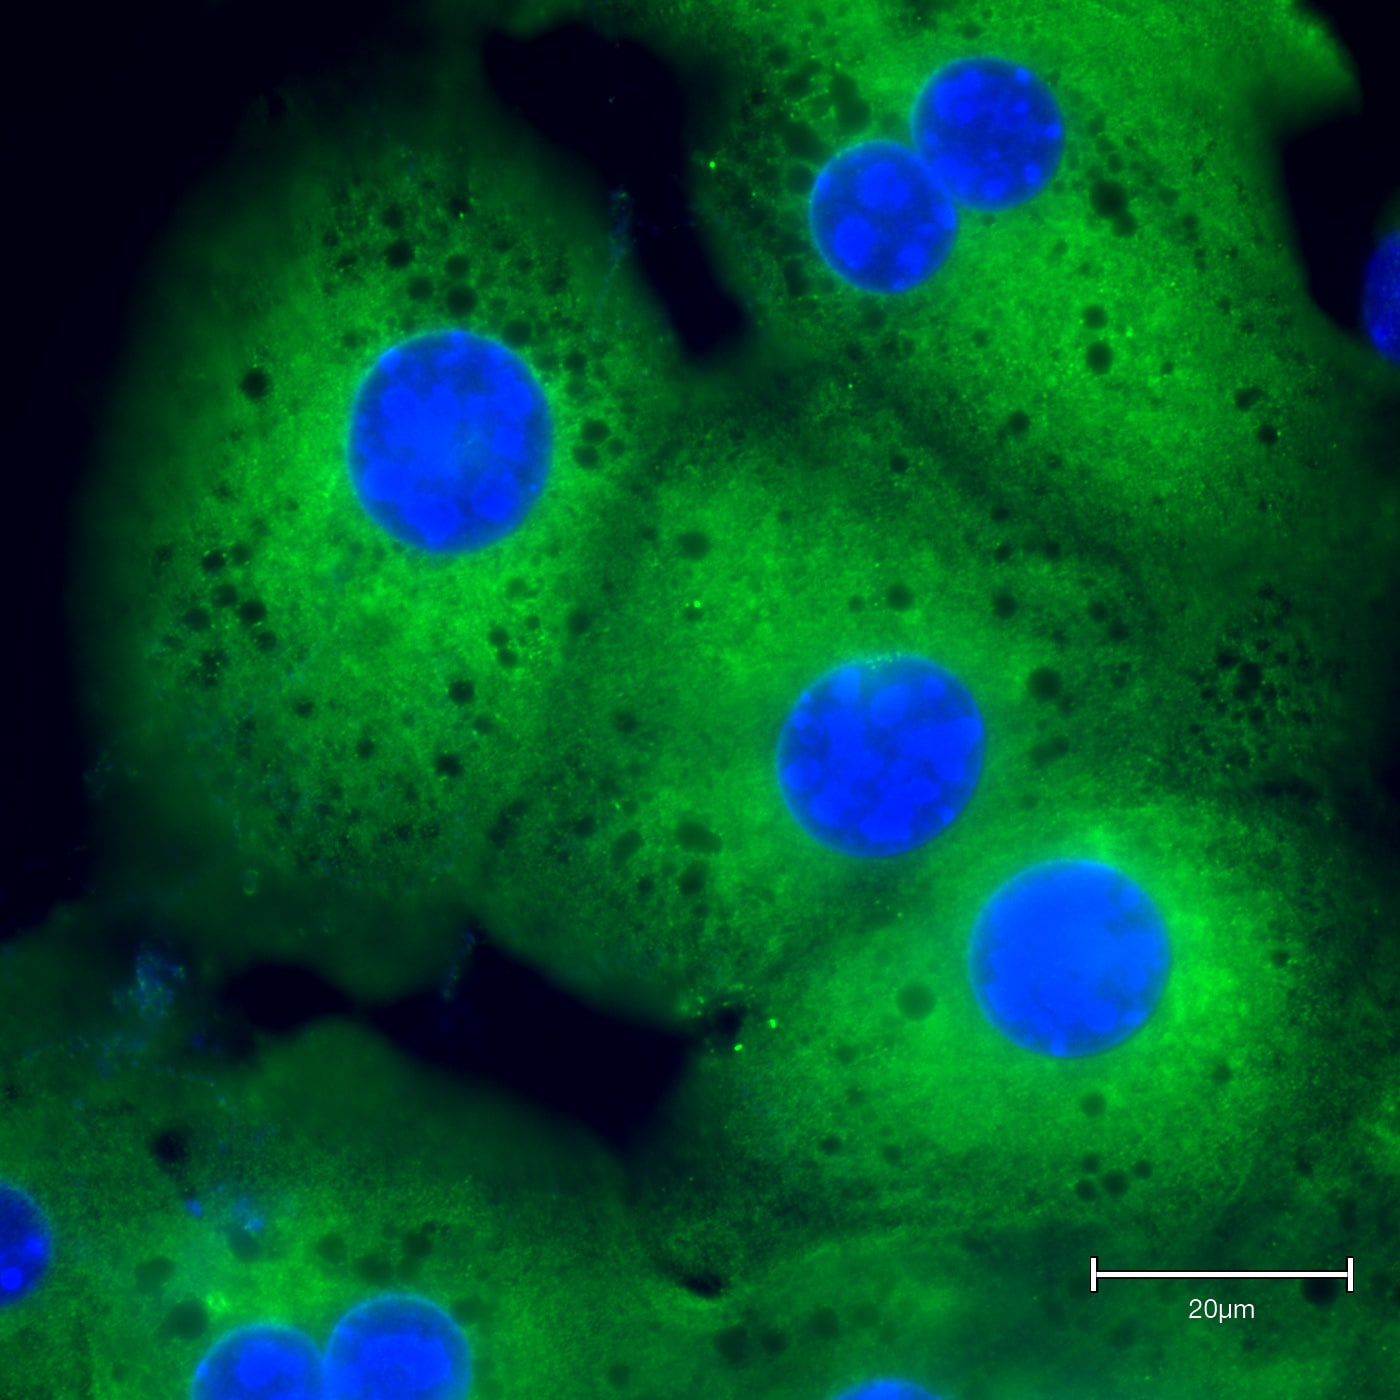
Immunocytochemistry/Immunofluorescence: ATF6 Antibody (70B1413.1) [NBP1-40256] - Untreated HeLa cells were fixed in -20C methanol for 10 min, air dried and rehydrated in PBS at room temperature for 5 minutes. Cells were incubated with anti-ATF6 (1:20) for one hour at room temperature. ATF6 reactivity (green) was detected with anti-mouse Dylight-488 secondary antibody. Nuclei were counterstained with DAPI (blue). Note the ER localization of ATF6.![Immunohistochemistry-Paraffin: ATF6 Antibody (70B1413.1) - BSA Free [NBP1-40256]](https://resources.rndsystems.com/images/products/ATF6-Antibody-70B1413-1-Immunohistochemistry-Paraffin-NBP1-40256-img0017.jpg "Immunohistochemistry-Paraffin: ATF6 Antibody (70B1413.1) - BSA Free [NBP1-40256]")
Immunohistochemistry-Paraffin: ATF6 Antibody (70B1413.1) - BSA Free [NBP1-40256]
Immunohistochemistry-Paraffin: ATF6 Antibody (70B1413.1) [NBP1-40256] - Analysis of ATF6 antibody on Human placenta. Fixed paraffin-embedded sections. Antibody dilution 1:50. Incubated overnight in 4C. Image from verified customer review.![Flow (Intracellular): ATF6 Antibody (70B1413.1) - BSA Free [NBP1-40256]](https://resources.rndsystems.com/images/products/ATF6-Antibody-70B1413-1-Flow-Intracellular-NBP1-40256-img0016.jpg "Flow (Intracellular): ATF6 Antibody (70B1413.1) - BSA Free [NBP1-40256]")
Flow (Intracellular): ATF6 Antibody (70B1413.1) - BSA Free [NBP1-40256]
Flow (Intracellular): ATF6 Antibody (70B1413.1) [NBP1-40256] - An intracellular stain was performed on HeLa cells with ATF6 Antibody (70B1413.1) NBP1-40256F (blue) and a matched isotype control (orange). Cells were fixed with 4% PFA and then permeablized with 0.1% saponin. Cells were incubated in an antibody dilution of 10 ug/mL for 30 minutes at room temperature. Both antibodies were conjugated to FITC.. Using the FITC format of this antibody.![Western Blot: ATF6 Antibody (70B1413.1)BSA Free [NBP1-40256]](https://resources.rndsystems.com/images/products/ATF6-Antibody-70B1413-1-Western-Blot-NBP1-40256-img0007.jpg "Western Blot: ATF6 Antibody (70B1413.1)BSA Free [NBP1-40256]")
Western Blot: ATF6 Antibody (70B1413.1)BSA Free [NBP1-40256]
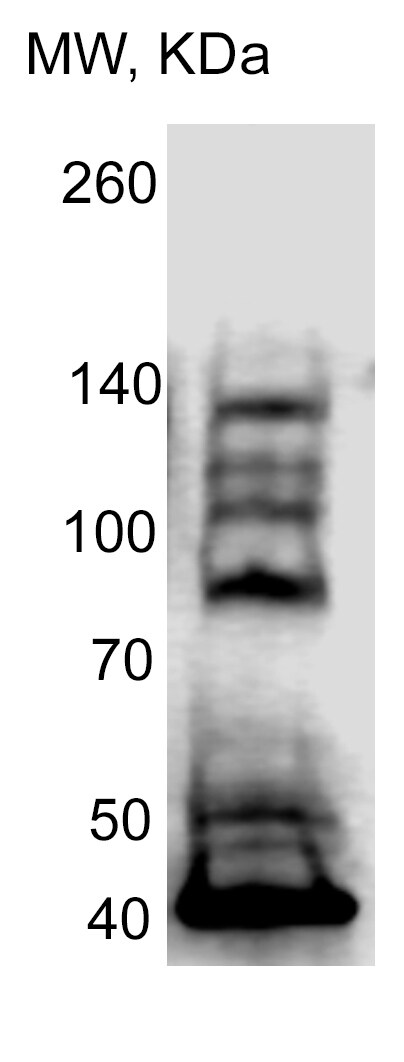
Western Blot: ATF6 Antibody (70B1413.1) [NBP1-40256] - Lane 1: 293 cells transfected with full-length ATF6.Lane 2: 293 cells transfected with partial length ATF6 (amino acids 1-373).
Lane 3: Untransfected 293 cells.
Western blots were probed with 4 ug/ml of the ATF6 monoclonal antibody and visualized with PicoTect Western Blot Chemiluminescence Substrate (10087K). Film was exposed for 1 min. The top arrow corresponds to the 90 kDa form of ATF6 described as full-length in the literature. The human full-length and partial length ATF6 plasmids are described in Luo and Lee (2002).
![Immunohistochemistry-Paraffin: ATF6 Antibody (70B1413.1) - BSA Free [NBP1-40256]](https://resources.rndsystems.com/images/products/ATF6-Antibody-70B1413-1-Immunohistochemistry-Paraffin-NBP1-40256-img0001.jpg "Immunohistochemistry-Paraffin: ATF6 Antibody (70B1413.1) - BSA Free [NBP1-40256]")
Immunohistochemistry-Paraffin: ATF6 Antibody (70B1413.1) - BSA Free [NBP1-40256]
Immunohistochemistry-Paraffin: ATF6 Antibody (70B1413.1) [NBP1-40256] - Human placenta, followed by biotinylated horse anti-mouse IgG secondary antibody, alkaline phosphatase-streptavidin and chromogen. Dilution 10ug/ml![Flow Cytometry: ATF6 Antibody (70B1413.1) - BSA Free [NBP1-40256]](https://resources.rndsystems.com/images/products/ATF6-Antibody-70B1413-1-Flow-Cytometry-NBP1-40256-img0009.jpg "Flow Cytometry: ATF6 Antibody (70B1413.1) - BSA Free [NBP1-40256]")
Flow Cytometry: ATF6 Antibody (70B1413.1) - BSA Free [NBP1-40256]
Flow Cytometry: ATF6 Antibody (70B1413.1) [NBP1-40256] - Intracellular flow cytometric staining of 1 x 10^6 MCF-7 cells using ATF6 antibody (dark blue). Isotype control shown in orange. An antibody concentration of 1 ug/1x10^6 cells was used. [NBP1-40256] -")
Western Blot: ATF6 Antibody (70B1413.1) [NBP1-40256] -
Western Blot: ATF6 Antibody (70B1413.1) [NBP1-40256] - Lysate of DU145 cells. Image from verified customer review. [NBP1-40256] -")
Western Blot: ATF6 Antibody (70B1413.1) [NBP1-40256] -
Western Blot: ATF6 Antibody (70B1413.1) [NBP1-40256] - Lysate of PC-3 cells. Image from verified customer review. - BSA Free [NBP1-40256] -")
Western Blot: ATF6 Antibody (70B1413.1) - BSA Free [NBP1-40256] -
Expression of ER stress-associated transcription factors in NASH, NAFL and normal liver tissues beta -Actin was used as an internal control. Horizontal lines represent means of densitometry signals from the western blot analyses for all tissue groups. #, significant differences in signals between NASH and normal liver tissues (P < 0.05). Data for NAFL tissues were not used for statistical comparisons because of limited sample number (n = 2). - BSA Free [NBP1-40256] -")
Western Blot: ATF6 Antibody (70B1413.1) - BSA Free [NBP1-40256] -
Abnormal Paneth cells show ER stress.(A, B) Representative transmission electron microscopy images of Paneth cells at the base of ileal crypts in (A) ICR & (B) SAMP1/YitFc mice. Scale bars indicate 2 μm. (C, D) Quantitative analysis of (C) granule number & (D) ER lumen diameter in Paneth cells (n = 3/each week for SAMP1/YitFc mice). For the measurements, three Paneth cells were randomly selected from each mouse. (E) SDS–PAGE Western blot analysis of ER stress markers, pIRE1 alpha, ATF4, cleaved-ATF6, & GRP78 in ileal crypts (n = 4/each group). Total-IRE1 alpha & HPRT1 was used as loading control. (F) Relative expression level of ER stress markers calculated from the band intensity. Error bars represent mean ± SEM. (C, D, F) Statistical significance was evaluated by t test in (C, D), & one-way ANOVA followed by Tukey’s post hoc test in (F). P < 0.05 was considered statistically significant. *P < 0.05, †P < 0.01, §P < 0.001. E, ER; G, granules; N, nucleus; n.s., not significant. Image collected & cropped by CiteAb from the following publication (https://pubmed.ncbi.nlm.nih.gov/32345659), licensed under a CC-BY license. Not internally tested by Novus Biologicals. - BSA Free [NBP1-40256] -")
Western Blot: ATF6 Antibody (70B1413.1) - BSA Free [NBP1-40256] -
Western Blot: ATF6 Antibody (70B1413.1) - BSA Free [NBP1-40256] - The ISR is active in the retinas of rd16 mice.Western blots & corresponding graphs of ISR markers in the retinas of rd16 mice at P15 (a) & P20 (b). At P15, p-eIF2 alpha, ATF4, CHOP, & TRB3 are significantly elevated. At P20, levels of p-eIF2 alpha, ATF4, CHOP, & GADD34 are increased. Markers of the UPR are elevated in rd16 retinas. BiP & cleaved (~50 kD) ATF6 are upregulated in the retinas of rd16 mice at P15 (c) & P20 (d). Relative density measurements correspond to the intensities of the immunoblotting bands or lanes normalized to an internal control. Data are shown as mean ± SEM. a.u. arbitrary units. P15 n = 3. P20 n = 4. *p < 0.05, **p < 0.01, ***p < 0.001 Image collected & cropped by CiteAb from the following publication (https://pubmed.ncbi.nlm.nih.gov/29706649), licensed under a CC-BY license. Not internally tested by Novus Biologicals. - BSA Free [NBP1-40256] -")
Western Blot: ATF6 Antibody (70B1413.1) - BSA Free [NBP1-40256] -
Western Blot: ATF6 Antibody (70B1413.1) - BSA Free [NBP1-40256] - Expression of ER stress-associated transcription factors in NASH, NAFL & normal liver tissues beta -Actin was used as an internal control. Horizontal lines represent means of densitometry signals from the western blot analyses for all tissue groups. #, significant differences in signals between NASH & normal liver tissues (P < 0.05). Data for NAFL tissues were not used for statistical comparisons because of limited sample number (n = 2). Image collected & cropped by CiteAb from the following publication (https://pubmed.ncbi.nlm.nih.gov/28968997), licensed under a CC-BY license. Not internally tested by Novus Biologicals. - BSA Free [NBP1-40256] -")
Western Blot: ATF6 Antibody (70B1413.1) - BSA Free [NBP1-40256] -
Western Blot: ATF6 Antibody (70B1413.1) - BSA Free [NBP1-40256] - Restoration of Plk3 induction rescues ATF2 phosphorylation & ER stress resolution in Lrh-1LKO mice, & loss or gain of ATF2 transcriptional activity also alters ER stress resolution capacity.(A) Primary hepatocytes prepared from Lrh-1f/fand Lrh-1LKO mice & transduced with Ad-Plk3 or Ad-control at a MOI of 100. Cells treated 36 hr later with vehicle or tunicamycin (TM) (0.01 µg/ml) & doxycycline (1 µg/ml) to induce Plk3 or LacZ control. Nuclear protein was obtained at timepoints indicated & immunoblotted for UPR transcription factors, with TBP as a loading control. Results representative of 3 independent experiments. Image collected & cropped by CiteAb from the following publication (https://elifesciences.org/articles/01694), licensed under a CC-BY license. Not internally tested by Novus Biologicals. - BSA Free [NBP1-40256] -")
Western Blot: ATF6 Antibody (70B1413.1) - BSA Free [NBP1-40256] -
Western Blot: ATF6 Antibody (70B1413.1) - BSA Free [NBP1-40256] - The ISR is active in the retinas of rd16 mice.Western blots & corresponding graphs of ISR markers in the retinas of rd16 mice at P15 (a) & P20 (b). At P15, p-eIF2 alpha, ATF4, CHOP, & TRB3 are significantly elevated. At P20, levels of p-eIF2 alpha, ATF4, CHOP, & GADD34 are increased. Markers of the UPR are elevated in rd16 retinas. BiP & cleaved (~50 kD) ATF6 are upregulated in the retinas of rd16 mice at P15 (c) & P20 (d). Relative density measurements correspond to the intensities of the immunoblotting bands or lanes normalized to an internal control. Data are shown as mean ± SEM. a.u. arbitrary units. P15 n = 3. P20 n = 4. *p < 0.05, **p < 0.01, ***p < 0.001 Image collected & cropped by CiteAb from the following publication (https://pubmed.ncbi.nlm.nih.gov/29706649), licensed under a CC-BY license. Not internally tested by Novus Biologicals. - BSA Free [NBP1-40256] -")
Western Blot: ATF6 Antibody (70B1413.1) - BSA Free [NBP1-40256] -
Western Blot: ATF6 Antibody (70B1413.1) - BSA Free [NBP1-40256] - APPswe induction of OB-senescence via ER stress.a Heat map of differentially expressed ER stress or anti-stress related genes identified by RNA-seq in control (OCN-Cre; Ai9) & TgAPPsweOCN; Ai9 Td+ OB-progenitors (detail analysis was described in Methods). b RT-PCR analysis of ER stress-related genes Grp78, Atf6, Hsp90b1, Eif2ak3, Ern1, Hsp90aa1, & Hspa2 & anti-stress related gene Sirt3 gene expression in purified Td+ BMSCs from 6-MO control (OCN-Cre; Ai9) & TgAPPsweOCN; Ai9 mice, *p < 0.05, **p < 0.01, ***p < 0.001, mean ± SD, n = 3, Mann–Whitney U test. c Western blot analysis of indicated protein expression in BMSCs from mice with indicated genotypes (at 6-MO). GAPDH was used as a loading control. d Quantification of data in c, *p < 0.05, **p < 0.01. mean ± SD, n = 4, Student’s t test. e Western blot analysis of indicated protein expression in BMSCs from 6-MO control & TgAPPsweOCN with or without 0.25 mM 4-PBA (4-Phenylbutyric acid) treatment. f Quantification analyses of the data in e, *p < 0.05, n = 3. g SA-beta -gal staining of 6-MO control & TgAPPsweOCN BMSCs with vehicle (Veh)(PBS) & 4-PBA treatment, respectively, scale bar, 20 µm. h Quantification of SA-beta -gal+ cell densities in g (mean ± SD; n = 5, **p < 0.01, ***p < 0.001). Two-way analysis of variance test was used in f & h. Image collected & cropped by CiteAb from the following publication (https://pubmed.ncbi.nlm.nih.gov/34824365), licensed under a CC-BY license. Not internally tested by Novus Biologicals. - BSA Free [NBP1-40256] -")
Western Blot: ATF6 Antibody (70B1413.1) - BSA Free [NBP1-40256] -
Western Blot: ATF6 Antibody (70B1413.1) - BSA Free [NBP1-40256] - Disturbance of ER homeostasis in ADTKD-UMOD.(A) ADTKD-UMOD is characterized by maturation & trafficking defect of mutant UMOD & intracellular accumulation of UMOD in TAL cells. UMOD immunolocalization revealed a diffuse cytoplasmic staining with enforcement of the luminal membrane in TAL cells of a wild-type mouse. In contrast, TAL cells of an UmodC93F mutant mouse displayed a strong paranuclear immunopositivity for UMOD. Wild-type: Umodwt mouse; UmodC93F: homozygous UmodC93F mutant mouse. Age of mice analysed: four months. Chromogen: DAB, nuclear staining: haemalum. (B) Heat map of relative expression values (z scores) showed differential abundance of several proteins localized in the ER. (C) In the outer medulla of Umod mutant mice of both mouse lines, a strong accumulation of immature UMOD was present. (D) Protein abundances of BiP, phospho-eIF2 alpha, eIF2 alpha, ATF4, both full-length (§) & cleaved activated (#) ATF6, & CHOP were increased in Umod mutant mice compared to wild-type mice. Signal intensities were corrected for GAPDH signal intensities of the same PVDF-membrane, which was stripped several times to facilitate the detection of multiple proteins. Mean of protein abundance of wild-type mice was set on a value of 1 [mean (wild-type) = 1]. Data are shown as means ± SD. One-way ANOVA with Newman-Keuls’s post hoc test: p vs. wild-type, *p < 0.05; **p < 0.01; ***p < 0.001. Image collected & cropped by CiteAb from the following publication (https://www.nature.com/articles/srep42970), licensed under a CC-BY license. Not internally tested by Novus Biologicals. - BSA Free [NBP1-40256] -")
Western Blot: ATF6 Antibody (70B1413.1) - BSA Free [NBP1-40256] -
Western Blot: ATF6 Antibody (70B1413.1) - BSA Free [NBP1-40256] - The effect of Ezetimibe on unfolded protein response (UPR) gene expression in THP-1 cells exposed to ischemia-reperfusion (IR). (a) The mRNA expression of activating transcription factor 6 (ATF6) & CCAAT-enhancer-binding protein homologous protein (CHOP). (b) Representative Western blot analyses for the indicated proteins. (c,d) The average quantification of ATF6 & CHOP obtained by the densitometric analysis of three independent experiments. mRNA was analyzed by quantitative real-time PCR; normalized gene expression levels are given as the ratio between the mean value for the target gene & that for beta -actin in each sample. Data are expressed as mean ± SD. * p < 0.01 vs. control (up-regulation); ** p < 0.01 vs. IR; §p < 0.01 vs. control (down-regulation). Image collected & cropped by CiteAb from the following publication (https://pubmed.ncbi.nlm.nih.gov/32340270), licensed under a CC-BY license. Not internally tested by Novus Biologicals. - BSA Free [NBP1-40256] -")
Western Blot: ATF6 Antibody (70B1413.1) - BSA Free [NBP1-40256] -
Western Blot: ATF6 Antibody (70B1413.1) - BSA Free [NBP1-40256] - APPswe induction of OB-senescence via ER stress.a Heat map of differentially expressed ER stress or anti-stress related genes identified by RNA-seq in control (OCN-Cre; Ai9) & TgAPPsweOCN; Ai9 Td+ OB-progenitors (detail analysis was described in Methods). b RT-PCR analysis of ER stress-related genes Grp78, Atf6, Hsp90b1, Eif2ak3, Ern1, Hsp90aa1, & Hspa2 & anti-stress related gene Sirt3 gene expression in purified Td+ BMSCs from 6-MO control (OCN-Cre; Ai9) & TgAPPsweOCN; Ai9 mice, *p < 0.05, **p < 0.01, ***p < 0.001, mean ± SD, n = 3, Mann–Whitney U test. c Western blot analysis of indicated protein expression in BMSCs from mice with indicated genotypes (at 6-MO). GAPDH was used as a loading control. d Quantification of data in c, *p < 0.05, **p < 0.01. mean ± SD, n = 4, Student’s t test. e Western blot analysis of indicated protein expression in BMSCs from 6-MO control & TgAPPsweOCN with or without 0.25 mM 4-PBA (4-Phenylbutyric acid) treatment. f Quantification analyses of the data in e, *p < 0.05, n = 3. g SA-beta -gal staining of 6-MO control & TgAPPsweOCN BMSCs with vehicle (Veh)(PBS) & 4-PBA treatment, respectively, scale bar, 20 µm. h Quantification of SA-beta -gal+ cell densities in g (mean ± SD; n = 5, **p < 0.01, ***p < 0.001). Two-way analysis of variance test was used in f & h. Image collected & cropped by CiteAb from the following publication (https://pubmed.ncbi.nlm.nih.gov/34824365), licensed under a CC-BY license. Not internally tested by Novus Biologicals. - BSA Free [NBP1-40256] -")
Immunocytochemistry/ Immunofluorescence: ATF6 Antibody (70B1413.1) - BSA Free [NBP1-40256] -
Immunocytochemistry/ Immunofluorescence: ATF6 Antibody (70B1413.1) - BSA Free [NBP1-40256] - Effect of rapamycin on markers of the UPR pathways(A) Cells were incubated in medium alone (0.05% FBS), with 3 nM IGF-1 or with both 3 nM IGF-1 & 10 nM rapamycin (IGF-1 + rapamycin). Total protein extracts prepared from cells incubated for 24 h in those conditions were subjected to Western Blot analysis. Protein expression levels were assessed for phosphorylated or total forms of PERK, eIF2 alpha & for CHOP, BiP, XBP1-s & XBP1-u proteins. Efficiency of rapamycin to inhibit mTORC1 pathway was also checked by immunoblot with phosphorylated & total forms of p70S6K1 & 4E-BP1. alpha -tubulin was used as internal control. (B & C) Cells were incubated with 10nM rapamycin for 1 h (B) or 24 h (C). Immunoblots for phosphorylated & total forms of PERK, eIF2 alpha, p70S6K1 & 4E-BP1 or for ATF4, CHOP, BiP, XBP1-s & XBP1-u protein expression were performed. alpha -tubulin was used as internal control. Blots of P-p70S6K1, p70S6K1, P-PERK, PERK, & alpha -tubulin of Figure 4B & blots of Figure 4C have been performed on the same electrophoresis gel, but cut & reconstituted. (D) Cells were incubated in medium alone (Ctrl) or with 10 nM rapamycin for 24 h. Nuclear localization of ATF6 was assessed using immunofluorescence with ATF6-antibody (red) & Hoechst dye. Magnification ×1000. (E) Bar graphs were obtained by quantification of ATF6 nuclear staining. Results are representative of at least 3 experiments. Image collected & cropped by CiteAb from the following publication (https://www.oncotarget.com/lookup/doi/10.18632/oncotarget.15469), licensed under a CC-BY license. Not internally tested by Novus Biologicals. - BSA Free [NBP1-40256] -")
Immunocytochemistry/ Immunofluorescence: ATF6 Antibody (70B1413.1) - BSA Free [NBP1-40256] -
Immunocytochemistry/ Immunofluorescence: ATF6 Antibody (70B1413.1) - BSA Free [NBP1-40256] - Activation of the UPR during hypoxia or glucose depletionSTC-1 & GluTag cells were subjected to hypoxia (1%) or cultivated with decreasing concentration of glucose i.e. 25, 5 or 1 mM, for 24 h. (A) & (C) Protein expression level of phosphorylated & total forms of PERK, eIF2 alpha & ATF4, CHOP, BiP & C-Caspase 3 protein expression was examined using immunoblots, during hypoxia (A) & glucose depletion (C). alpha -tubulin was used as internal control. Blots of Figure 2A have been performed on the same electrophoresis gel, but cut & reconstituted. (B) & (D) XBP1 mRNA splicing was analyzed by RT-PCR after Pst1 digestion: XBP1-u, unspliced; XBP1-h, hybrid; XBP1-s, spliced variant of XBP1; *, XBP1-u mRNA fragments after Pst1 digestion. (E) ATF6 nuclear localization was assessed in STC-1 cells using immunofluorescence with anti-ATF6 antibody & hoechst dye. Magnification x1000. Results are presentative of at least 3 independent experiments (A–E). (F) Bar graphs were obtained by quantification of ATF6 nuclear staining (*P < 0.05 versus control). Results are presentative of 3 independent experiments (A–E) or the mean ± S.E.M. of an experimental n = 3 (F). Image collected & cropped by CiteAb from the following publication (https://www.oncotarget.com/lookup/doi/10.18632/oncotarget.15469), licensed under a CC-BY license. Not internally tested by Novus Biologicals. - BSA Free [NBP1-40256] -")
Immunocytochemistry/ Immunofluorescence: ATF6 Antibody (70B1413.1) - BSA Free [NBP1-40256] -
Immunocytochemistry/ Immunofluorescence: ATF6 Antibody (70B1413.1) - BSA Free [NBP1-40256] - UPR status in STC-1 & GluTag cell lines & effect of UPR inducers on markers of the UPR pathwaysSTC-1 & GluTag cells were incubated in medium (Ctrl) or ER stress-inducing agents thapsigargin (Tg, 300 nM), tunicamycin (Tn, 0.05 μg/mL) & brefeldin A (Bref A, 3 μM) for 4 h, 16 h & 8 h respectively. (A) Protein expression level of phosphorylated or total forms of PERK, eIF2 alpha & CHOP, BiP & cleaved-caspase 3 (C-Caspase 3) protein expression was examined using Western Blot analysis. alpha -tubulin was used as internal control (B) Densitometric quantification of P-PERK/PERK, P-eIF2 alpha /eIF2 alpha & BiP/ alpha -tubulin ratios analysis in STC-1 or GluTag cell lines (*P < 0.05 versus control). (C–D) The effect of Tg, Tn & Bref A on ATF6 nuclear localization was assessed by immunofluorescence in STC-1 cells (C) & GluTag cells (D) using anti-ATF6 antibody & Hoechst dye. Magnification ×1000. (E) Bar graphs obtained by quantification of ATF6 nuclear staining (*P < 0.05 versus control). (F) XBP1 mRNA splicing was analyzed by RT-PCR after Pst1 digestion: XBP1-h, hybrid, XBP1-u, unspliced; XBP1-s, spliced variant of XBP1; *, XBP1-u mRNA fragments after Pst1 digestion. Results are presentative of 3 independent experiments (A, C, D, F) or the mean ± S.E.M. of an experimental n = 3 (B, E). Image collected & cropped by CiteAb from the following publication (https://www.oncotarget.com/lookup/doi/10.18632/oncotarget.15469), licensed under a CC-BY license. Not internally tested by Novus Biologicals. - BSA Free [NBP1-40256] -")
Western Blot: ATF6 Antibody (70B1413.1) - BSA Free [NBP1-40256] -
Western Blot: ATF6 Antibody (70B1413.1) - BSA Free [NBP1-40256] - Tm‐induced UPR increases expression of RANKL in cultured osteoblastic & osteocytic cells. (A) Western blotting of cell lysates obtained from neonatal calvaria‐derived osteoblastic cells (Calvaria Ob) treated with 2.2 µg/mL Tm for the indicated times. (B‐D) Gene expression as determined by qRT‐PCR in (B) calvaria‐derived osteoblastic cells (n = 3/group) (C) Osteoblastic UAMS‐32 cells (UAMS‐32 Ob) (n = 4/group) or (D) osteocytic MLO‐Y4 cells (MLO‐Y4 Ot) (n = 4/group),maintained in presence of vehicle (, 0.1% DMSO) or 2.2 µg/ml Tm () for 4 hours. (E) Western blot of RANKL protein in cell lysates obtained from calvaria‐derived osteoblastic cells as described in A in a separate study. Data shown are the mean & SD with individual data points. *P < .05 vs vehicle by Student's t‐test Image collected & cropped by CiteAb from the following publication (https://pubmed.ncbi.nlm.nih.gov/32259048), licensed under a CC-BY license. Not internally tested by Novus Biologicals. [IMGENEX: IMG-273] [NBP1-40256]")
Immunocytochemistry/Immunofluorescence: Mouse Monoclonal ATF6 Antibody (70B1413.1) [IMGENEX: IMG-273] [NBP1-40256]
Immunocytochemistry/Immunofluorescence: Mouse Monoclonal ATF6 Antibody (70B1413.1) [IMGENEX: IMG-273] [NBP1-40256] - Mice hepatocytes were stained for ATF6. Image from a verified customer review. [IMGENEX: IMG-273] [NBP1-40256]")
Western Blot: Mouse Monoclonal ATF6 Antibody (70B1413.1) [IMGENEX: IMG-273] [NBP1-40256]
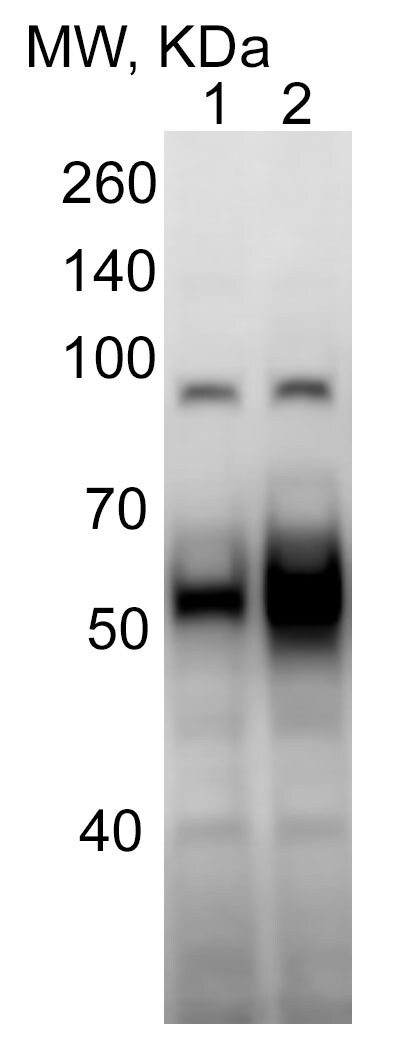
Western Blot: Mouse Monoclonal ATF6 Antibody (70B1413.1) [IMGENEX: IMG-273] [NBP1-40256] - Western blot of the mouse liver homogenates from control (1) and alcohol-fed mice (2). Image from a verified customer review.Applications for ATF6 Antibody (70B1413.1) - BSA Free
Chromatin Immunoprecipitation (ChIP)
Flow Cytometry
Immunocytochemistry/ Immunofluorescence
Immunohistochemistry
Immunohistochemistry-Frozen
Immunohistochemistry-Paraffin
Immunoprecipitation
Western Blot
Reviewed Applications
Read 7 reviews rated 4.1 using NBP1-40256 in the following applications:
Flow Cytometry Panel Builder
Bio-Techne Knows Flow Cytometry
Save time and reduce costly mistakes by quickly finding compatible reagents using the Panel Builder Tool.
Advanced Features
- Spectra Viewer - Custom analysis of spectra from multiple fluorochromes
- Spillover Popups - Visualize the spectra of individual fluorochromes
- Antigen Density Selector - Match fluorochrome brightness with antigen density

Formulation, Preparation, and Storage
Purification
Formulation
Format
Preservative
Concentration
Shipping
Stability & Storage
Background: ATF6
Long Name
Alternate Names
Entrez Gene IDs
Gene Symbol
UniProt
Additional ATF6 Products
Product Documents for ATF6 Antibody (70B1413.1) - BSA Free
Certificate of Analysis
To download a Certificate of Analysis, please enter a lot or batch number in the search box below.
Product Specific Notices for ATF6 Antibody (70B1413.1) - BSA Free
This product is for research use only and is not approved for use in humans or in clinical diagnosis. Primary Antibodies are guaranteed for 1 year from date of receipt.
Citations for ATF6 Antibody (70B1413.1) - BSA Free
 Powered by Bioz
Customer Reviews for ATF6 Antibody (70B1413.1) - BSA Free (7)
Have you used ATF6 Antibody (70B1413.1) - BSA Free?
Submit a review and receive an Amazon gift card!
$25/€18/£15/$25CAN/¥2500 Yen for a review with an image
$10/€7/£6/$10CAN/¥1110 Yen for a review without an image
Submit a review
Customer Images

-
Application: Western BlotSample Tested: Liver homogenates sampleSpecies: MouseVerified Customer | Posted 11/19/2024W-B of the mouse liver homogenates from control (1) and alcohol-fed mice (2).

-
Application: ImmunofluorescenceSample Tested: Primary mouse hepatocytesSpecies: MouseVerified Customer | Posted 11/19/2024Mice hepatocytes were stained for NBP1-40256
-
Application: Western BlotSample Tested: PC-3 human prostate cancer cell lineSpecies: HumanVerified Customer | Posted 06/27/2023Lysate of PC-3 cells
-
Application: Western BlotSample Tested: DU145 human prostate carcinoma cell lineSpecies: HumanVerified Customer | Posted 06/27/2023Lysate of DU145 cells
-
Application: Immunohistochemistry-ParaffinSample Tested: Placental tissueSpecies: HumanVerified Customer | Posted 01/24/2022Placenta stainingFixed paraffin-embedded sections. Antibody dilution 1:50. Incubated overnight in 4C.
-
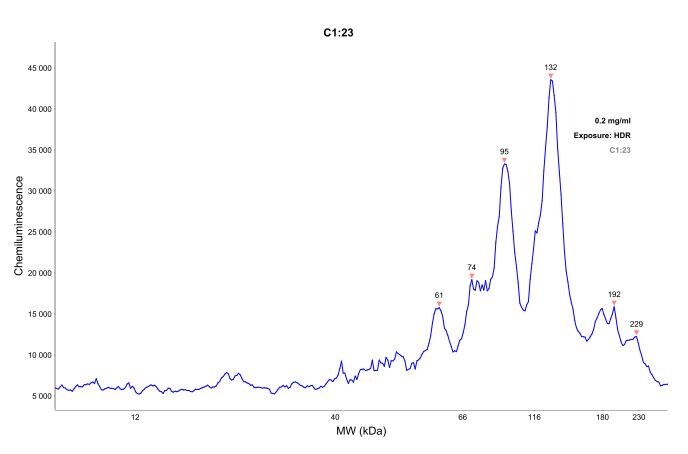
Application: WES protein simpleSample Tested: cultured embryonic cortical neuron lysate 0Species: RatVerified Customer | Posted 09/14/2018ATF6 1/25eLysate protein cortical neuron 0,2 mg/ml. test antibody: 1/25e, 1/50e, 1/100e
-
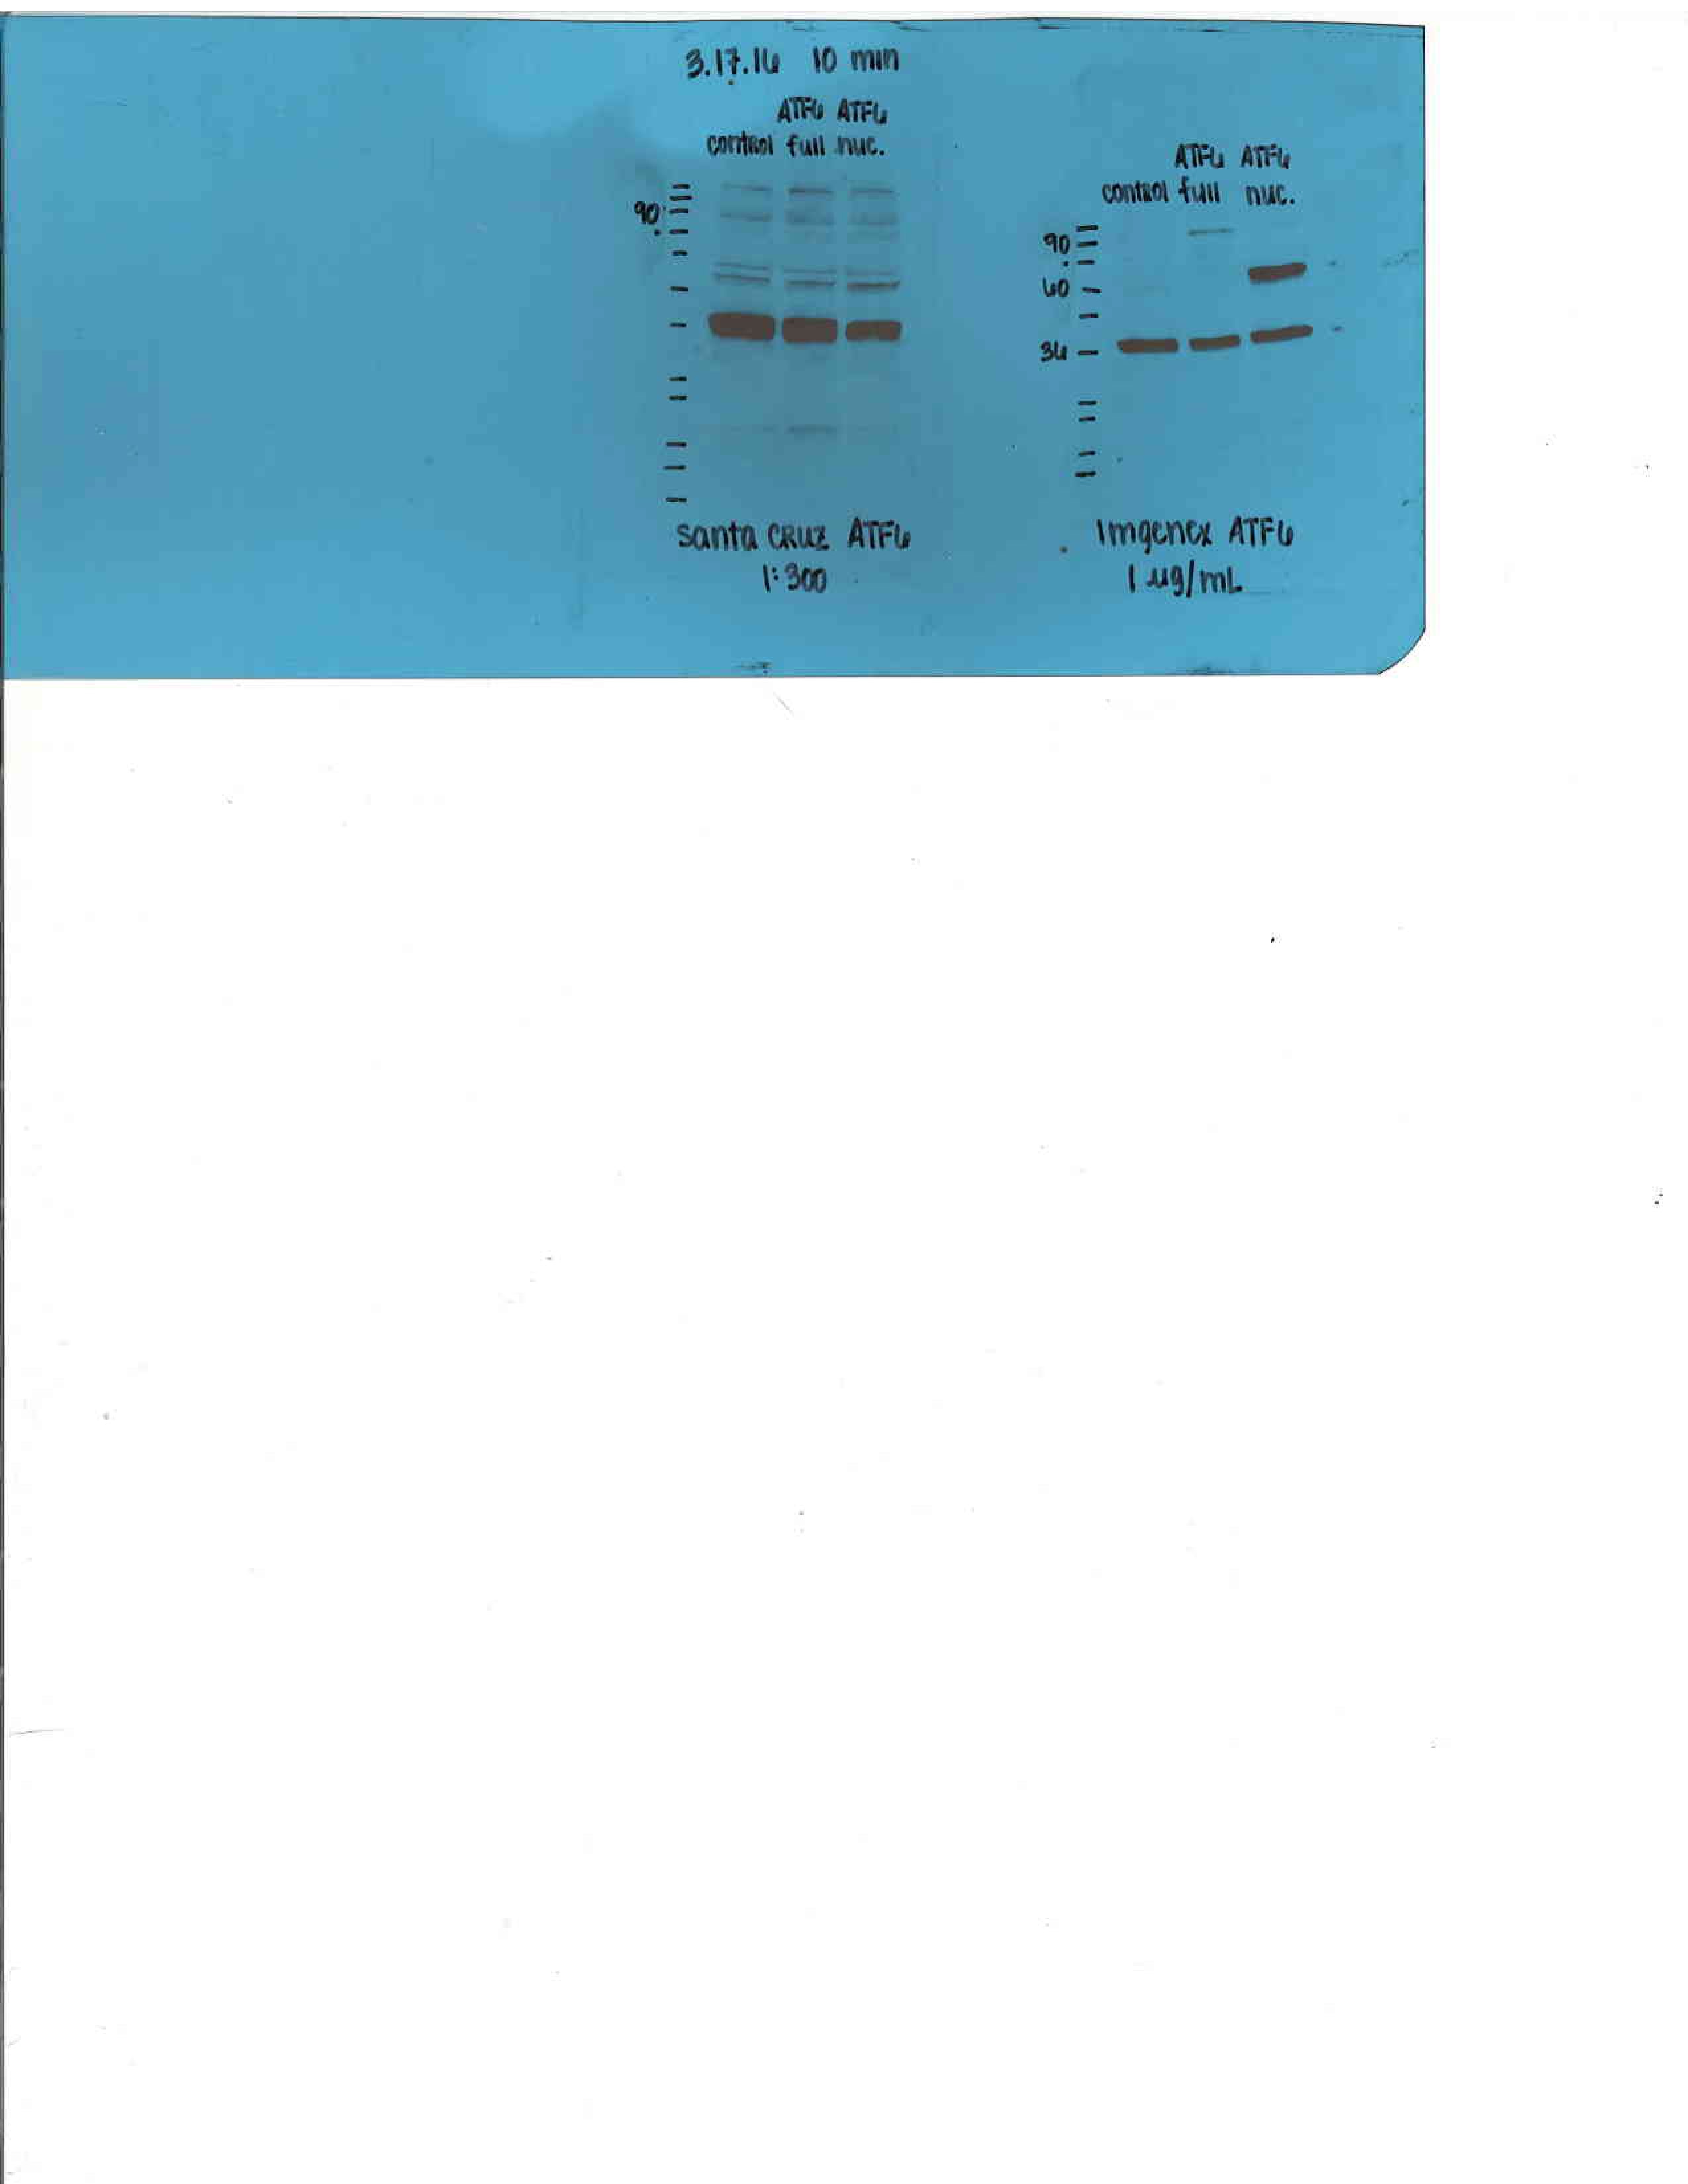
Application: Western BlotSample Tested: Whole cell lysateSpecies: MouseVerified Customer | Posted 03/18/2016ATF6 antibody review
There are no reviews that match your criteria.
Protocols
View specific protocols for ATF6 Antibody (70B1413.1) - BSA Free (NBP1-40256):
Sample Preparation.
1. Grow cells to 60-85% confluency. Flow cytometry requires between 2 x 10⁵ and 1 x 10⁶ cells for optimal performance.
2. If cells are adherent, harvest gently by washing once with staining buffer and then scraping. Avoid using trypsin as this can disrupt certain epitopes of interest. If enzymatic harvest is required, use Accutase, Collagenase, or TrypLE Express for a less damaging option.
3. Reserve 100 uL for counting, then transfer cell volume into a 50 mL conical tube and centrifuge for 8 minutes at 400 RCF.
a. Count cells using a hemocytometer and a 1:1 trypan blue exclusion stain to determine cell viability before starting the flow protocol. If cells appear blue, do not proceed.
4. Re-suspend cells to a concentration of 1 x 10⁶ cells/mL in staining buffer (NBP2-26247).
5. Aliquot out 1 mL samples in accordance with your experimental samples.
Tip: When cell surface and intracellular staining are required in the same sample, it is advisable that the cell surface staining be performed first since the fixation and permeablization steps might reduce the availability of surface antigens.
Intracellular Staining.
Tip: When performing intracellular staining, it is important to use appropriate fixation and permeabilization reagents based upon the target and its subcellular location. Generally, our Intracellular Flow Assay Kit (NBP2-29450) is a good place to start as it contains an optimized combination of reagents for intracellular staining as well as an inhibitor of intracellular protein transport (necessary if staining secreted proteins). Certain targets may require more gentle or transient permeabilization protocols such as the commonly employed methanol or saponin-based methods.
Protocol for Cytoplasmic Targets:
Optional: Perform cell surface staining as described in the previous section.
1. Fix the cells by adding 100 uL fixation solution (such as 4% PFA) to each sample for 10-15 minutes.
2. Permeabilize cells by adding 100 uL of a permeabization buffer to every 1 x 10⁶ cells present in the sample. Mix well and incubate at room temperature for 15 minutes.
a. For cytoplasmic targets, use a gentle permeabilization solution such as 1X PBS + 0.5% Saponin or 1X PBS + 0.5% Tween-20.
b. To maintain the permeabilized state throughout your experiment, use staining buffer + 0.1% of the permeabilization reagent (i.e. 0.1% Tween-20 or 0.1% Saponin).
3. Following the 15 minute incubation, add 2 mL of the staining buffer + 0.1% permeabilizer to each sample.
4. Centrifuge for 5 minutes at 400 RCF.
5. Discard supernatant and re-suspend in 1 mL of staining buffer + 0.1% permeabilizer.
6. Stain each sample at 1 uL/ 1 x 10⁶ cells of primary antibody or 1-3 uL/ 1 x 10⁶ cells for directly conjugated antibodies. Mix well and incubate at room temperature for 30 minutes- 1 hour. Gently mix samples every 10-15 minutes.
7. Following the primary/conjugate incubation, add 2 mL/sample of staining buffer +0.1% permeabilizer and centrifuge for 5 minutes at 400 RCF.
8. Remove supernatant and re-suspend each sample in 2 mL staining buffer + 0.1% permeabilizer, repeat wash for 5 minutes at 400 RCF.
9. If using a directly conjugated antibody, after the second wash, re-suspend cell pellet to a final volume of 500 uL per sample and proceed with flow analysis.
Culture cells to appropriate density in 35 mm culture dishes or 6-well plates.
1. Remove culture medium and wash the cells briefly in PBS. Add 10% formalin to the dish and fix at room temperature for 10 minutes.
2. Remove the formalin and wash the cells in PBS.
3. Permeablize the cells with 0.1% Triton X100 or other suitable detergent for 10 min.
4. Remove the permeablization buffer and wash three times for 10 minutes each in PBS. Be sure to not let the specimen dry out.
5. To block nonspecific antibody binding, incubate in 10% normal goat serum from 1 hour to overnight at room temperature.
6. Add primary antibody at appropriate dilution and incubate overnight at 4C.
7. Remove primary antibody and replace with PBS. Wash three times for 10 minutes each.
8. Add secondary antibody at appropriate dilution. Incubate for 1 hour at room temperature.
9. Remove secondary antibody and replace with PBS. Wash three times for 10 minutes each.
10. Counter stain DNA with DAPi if required.
Antigen Unmasking:
Bring slides to a boil in 10 mM sodium citrate buffer (pH 6.0) then maintain at a sub-boiling temperature for 10 minutes. Cool slides on bench-top for 30 minutes (keep slides in the sodium citrate buffer at all times).
Staining:
1. Wash sections in deionized water three times for 5 minutes each.
2. Wash sections in PBS for 5 minutes.
3. Block each section with 100-400 ul blocking solution (1% BSA in PBS) for 1 hour at room temperature.
4. Remove blocking solution and add 100-400 ul diluted primary antibody. Incubate overnight at 4 C.
5. Remove antibody solution and wash sections in wash buffer three times for 5 minutes each.
6. Add 100-400 ul HRP polymer conjugated secondary antibody. Incubate 30 minutes at room temperature.
7. Wash sections three times in wash buffer for 5 minutes each.
8. Add 100-400 ul DAB substrate to each section and monitor staining closely.
9. As soon as the sections develop, immerse slides in deionized water.
10. Counterstain sections in hematoxylin.
11. Wash sections in deionized water two times for 5 minutes each.
12. Dehydrate sections.
13. Mount coverslips.
1. Perform SDS-PAGE on samples to be analyzed, loading 10-25 ug of total protein per lane.
2. Transfer proteins to PVDF membrane according to the instructions provided by the manufacturer of the membrane and transfer apparatus.
3. Stain the membrane with Ponceau S (or similar product) to assess transfer success, and mark molecular weight standards where appropriate.
4. Rinse the blot TBS -0.05% Tween 20 (TBST).
5. Block the membrane in 5% Non-fat milk in TBST (blocking buffer) for at least 1 hour.
6. Wash the membrane in TBST three times for 10 minutes each.
7. Dilute primary antibody in blocking buffer and incubate overnight at 4C with gentle rocking.
8. Wash the membrane in TBST three times for 10 minutes each.
9. Incubate the membrane in diluted HRP conjugated secondary antibody in blocking buffer (as per manufacturer's instructions) for 1 hour at room temperature.
10. Wash the blot in TBST three times for 10 minutes each (this step can be repeated as required to reduce background).
11. Apply the detection reagent of choice in accordance with the manufacturer's instructions.
Find general support by application which include: protocols, troubleshooting, illustrated assays, videos and webinars.
- 7-Amino Actinomycin D (7-AAD) Cell Viability Flow Cytometry Protocol
- Antigen Retrieval Protocol (PIER)
- Antigen Retrieval for Frozen Sections Protocol
- Appropriate Fixation of IHC/ICC Samples
- Cellular Response to Hypoxia Protocols
- ChIP Protocol Video
- Chromatin Immunoprecipitation (ChIP) Protocol
- Chromatin Immunoprecipitation Protocol
- Chromogenic IHC Staining of Formalin-Fixed Paraffin-Embedded (FFPE) Tissue Protocol
- Chromogenic Immunohistochemistry Staining of Frozen Tissue
- ClariTSA™ Fluorophore Kits
- Detection & Visualization of Antibody Binding
- Extracellular Membrane Flow Cytometry Protocol
- Flow Cytometry Protocol for Cell Surface Markers
- Flow Cytometry Protocol for Staining Membrane Associated Proteins
- Flow Cytometry Staining Protocols
- Flow Cytometry Troubleshooting Guide
- Fluorescent IHC Staining of Frozen Tissue Protocol
- Graphic Protocol for Heat-induced Epitope Retrieval
- Graphic Protocol for the Preparation and Fluorescent IHC Staining of Frozen Tissue Sections
- Graphic Protocol for the Preparation and Fluorescent IHC Staining of Paraffin-embedded Tissue Sections
- Graphic Protocol for the Preparation of Gelatin-coated Slides for Histological Tissue Sections
- ICC Cell Smear Protocol for Suspension Cells
- ICC Immunocytochemistry Protocol Videos
- ICC for Adherent Cells
- IHC Sample Preparation (Frozen sections vs Paraffin)
- Immunocytochemistry (ICC) Protocol
- Immunocytochemistry Troubleshooting
- Immunofluorescence of Organoids Embedded in Cultrex Basement Membrane Extract
- Immunofluorescent IHC Staining of Formalin-Fixed Paraffin-Embedded (FFPE) Tissue Protocol
- Immunohistochemistry (IHC) and Immunocytochemistry (ICC) Protocols
- Immunohistochemistry Frozen Troubleshooting
- Immunohistochemistry Paraffin Troubleshooting
- Immunoprecipitation Protocol
- Intracellular Flow Cytometry Protocol Using Alcohol (Methanol)
- Intracellular Flow Cytometry Protocol Using Detergents
- Intracellular Nuclear Staining Flow Cytometry Protocol Using Detergents
- Intracellular Staining Flow Cytometry Protocol Using Alcohol Permeabilization
- Intracellular Staining Flow Cytometry Protocol Using Detergents to Permeabilize Cells
- Preparing Samples for IHC/ICC Experiments
- Preventing Non-Specific Staining (Non-Specific Binding)
- Primary Antibody Selection & Optimization
- Propidium Iodide Cell Viability Flow Cytometry Protocol
- Protocol for Heat-Induced Epitope Retrieval (HIER)
- Protocol for Liperfluo
- Protocol for Making a 4% Formaldehyde Solution in PBS
- Protocol for VisUCyte™ HRP Polymer Detection Reagent
- Protocol for the Characterization of Human Th22 Cells
- Protocol for the Characterization of Human Th9 Cells
- Protocol for the Fluorescent ICC Staining of Cell Smears - Graphic
- Protocol for the Fluorescent ICC Staining of Cultured Cells on Coverslips - Graphic
- Protocol for the Preparation & Fixation of Cells on Coverslips
- Protocol for the Preparation and Chromogenic IHC Staining of Frozen Tissue Sections
- Protocol for the Preparation and Chromogenic IHC Staining of Frozen Tissue Sections - Graphic
- Protocol for the Preparation and Chromogenic IHC Staining of Paraffin-embedded Tissue Sections
- Protocol for the Preparation and Chromogenic IHC Staining of Paraffin-embedded Tissue Sections - Graphic
- Protocol for the Preparation and Fluorescent ICC Staining of Cells on Coverslips
- Protocol for the Preparation and Fluorescent ICC Staining of Non-adherent Cells
- Protocol for the Preparation and Fluorescent ICC Staining of Stem Cells on Coverslips
- Protocol for the Preparation and Fluorescent IHC Staining of Frozen Tissue Sections
- Protocol for the Preparation and Fluorescent IHC Staining of Paraffin-embedded Tissue Sections
- Protocol for the Preparation of Gelatin-coated Slides for Histological Tissue Sections
- Protocol for the Preparation of a Cell Smear for Non-adherent Cell ICC - Graphic
- Protocol: Annexin V and PI Staining by Flow Cytometry
- Protocol: Annexin V and PI Staining for Apoptosis by Flow Cytometry
- R&D Systems Quality Control Western Blot Protocol
- TUNEL and Active Caspase-3 Detection by IHC/ICC Protocol
- The Importance of IHC/ICC Controls
- Troubleshooting Guide: Fluorokine Flow Cytometry Kits
- Troubleshooting Guide: Immunohistochemistry
- Troubleshooting Guide: Western Blot Figures
- Western Blot Conditions
- Western Blot Protocol
- Western Blot Protocol for Cell Lysates
- Western Blot Troubleshooting
- Western Blot Troubleshooting Guide
- View all Protocols, Troubleshooting, Illustrated assays and Webinars
FAQs for ATF6 Antibody (70B1413.1) - BSA Free
-
Q: I learn from your company web that you are providing atf6, xbp1, cbx4 antibodies against human for immunofluorescence. And from the provided pictures, it seems very good. But I am wondering if anyone use them for immunofluorescence in human cells in your memory or in published papers? And how about them? By the way, you are providing free sample size for the atf6, xbp1 antibodies, aren't you? Could you send me some for tests? One more question, do they work on endogenous proteins but not only on overexpressed proteins?
A: These products have been validated for use in IF on human: catalog numbers NBP1-40256, NB100-80861, and NBP1-83225. Yes these antibodies should work on the native protein/endogenous protein.
-
Q: Is there a blocking peptide available for your ATF6 antibody (NBP1-40256)?
A:
This antibody was made against a partial recombinant protein (not a short peptide). As such we do not have a blocking peptide for this antibody nor do we have a blocking protein. We do however have a positive control, ready to use ATF6 lysate NBP1-70778.
-
Q: IS THIS ATF6 ANTIBODY FOR WESTERN BLOT FROM MOUSE? SO WE NEED THE ANTI-MOUSE SECONDARY?
A: NBP1-40256 (ATF6 Antibody/70B1413.1) can be used in WB with mouse tissue/cell line samples. We have many secondary antibodies that can potentially be used with NBP1-40256. However, since the primary antibody has an isotype of IgG1, it is better to use the WB-validated anti-mouse IgG1 secondary antibodies.
-
Q: We are having trouble with the following antibody, we did not observe any signal for ATF6 (full length or cleaved), only a non-specific band at around 37 kDa. We've tested on human MRC-5 fibrablasts. Do you have any suggestions that may be helpful to us?
A:
The nature of the protein target ATF6 is differently expressed as the unglycosylated and/or glycosylated forms, with the different levels of glycosylation (http://www.uniprot.org/uniprot/P18850#ptm_processing), in the different organs/tissues/cells under the different physiological/pathological conditions. This ATF6 Antibody/70B1413.1 is a mouse monoclonal antibody with a very narrow epitope (even though we don't map any epitopes for our antibodies, it is known that almost all monoclonal epitopes have the sizes less than 15 a.a.). In other words, NBP1-40256 can bind to the full-length ATF6 and the long fragment of the cleaved protein target (not both cleaved protein species, and see #3 below). In order to detect the full-length and both two cleaved fragments of ATF6, the immunogen has to extend before and after the cleavage site at a.a. 419/420, in both directions, and therefore the epitopes can present in both sides of the cleavage site. ATF6 has 1 transmembrane domain, 1 leucine-zipper, and three glycosylation sites that could affect the mobility in electrophoresis. As the rule of thumb, we use 110 Da as an average of one amino acid. Therefore the full-length ATF6 gives 73,700 Da (vs. 74,585 Da calculated by the exact sequence). Since it is cleaved at a.a. 419 of ATF6, two fragments will be 419 a.a. and 251 a.a. (670 - 419). Take each of them and times 110 Da individually, and these are the results: 46,090 Da and 27,610 Da (the estimated values), respectively. Thefore your ~37 kDa species might be the short protein species with glycosylations (please double check with #1 above). Finally, we would like to suggest two things: please include other human cell lines as the controls: http://www.proteinatlas.org/ENSG00000118217-ATF6/antibody shows the WB positive results derived from using two cell lines and one organ. These could be used as the positive control. Also, the glycosylation levels are likely to be different in the different cells/tissues/organs, and therefor the different sizes of ATF can be viewed. The second thing is to use a real positive control lysate, such as ATF6 cell lysate or ATF6 overexpression lysate for the specificity of NBP1-40256.
-
Q: We are looking for an antibody specific to ATF6 alpha that will not cross-react with ATF6 beta. Would you please help confirm if any of the following are ATF6 alpha specific antibodies: NBP1-40256, NBP1-77251, NBP1-76675 & NBP1-41439?
A:
The antibodies NBP1-77251 and NBP1-76675 are specific to ATF6 alpha and should not cross-react with ATF6 beta.
-
Q: I learn from your company web that you are providing atf6, xbp1, cbx4 antibodies against human for immunofluorescence. And from the provided pictures, it seems very good. But I am wondering if anyone use them for immunofluorescence in human cells in your memory or in published papers? And how about them? By the way, you are providing free sample size for the atf6, xbp1 antibodies, aren't you? Could you send me some for tests? One more question, do they work on endogenous proteins but not only on overexpressed proteins?
A: These products have been validated for use in IF on human: catalog numbers NBP1-40256, NB100-80861, and NBP1-83225. Yes these antibodies should work on the native protein/endogenous protein.
-
Q: Is there a blocking peptide available for your ATF6 antibody (NBP1-40256)?
A:
This antibody was made against a partial recombinant protein (not a short peptide). As such we do not have a blocking peptide for this antibody nor do we have a blocking protein. We do however have a positive control, ready to use ATF6 lysate NBP1-70778.
-
Q: IS THIS ATF6 ANTIBODY FOR WESTERN BLOT FROM MOUSE? SO WE NEED THE ANTI-MOUSE SECONDARY?
A: NBP1-40256 (ATF6 Antibody/70B1413.1) can be used in WB with mouse tissue/cell line samples. We have many secondary antibodies that can potentially be used with NBP1-40256. However, since the primary antibody has an isotype of IgG1, it is better to use the WB-validated anti-mouse IgG1 secondary antibodies.
-
Q: We are having trouble with the following antibody, we did not observe any signal for ATF6 (full length or cleaved), only a non-specific band at around 37 kDa. We've tested on human MRC-5 fibrablasts. Do you have any suggestions that may be helpful to us?
A:
The nature of the protein target ATF6 is differently expressed as the unglycosylated and/or glycosylated forms, with the different levels of glycosylation (http://www.uniprot.org/uniprot/P18850#ptm_processing), in the different organs/tissues/cells under the different physiological/pathological conditions. This ATF6 Antibody/70B1413.1 is a mouse monoclonal antibody with a very narrow epitope (even though we don't map any epitopes for our antibodies, it is known that almost all monoclonal epitopes have the sizes less than 15 a.a.). In other words, NBP1-40256 can bind to the full-length ATF6 and the long fragment of the cleaved protein target (not both cleaved protein species, and see #3 below). In order to detect the full-length and both two cleaved fragments of ATF6, the immunogen has to extend before and after the cleavage site at a.a. 419/420, in both directions, and therefore the epitopes can present in both sides of the cleavage site. ATF6 has 1 transmembrane domain, 1 leucine-zipper, and three glycosylation sites that could affect the mobility in electrophoresis. As the rule of thumb, we use 110 Da as an average of one amino acid. Therefore the full-length ATF6 gives 73,700 Da (vs. 74,585 Da calculated by the exact sequence). Since it is cleaved at a.a. 419 of ATF6, two fragments will be 419 a.a. and 251 a.a. (670 - 419). Take each of them and times 110 Da individually, and these are the results: 46,090 Da and 27,610 Da (the estimated values), respectively. Thefore your ~37 kDa species might be the short protein species with glycosylations (please double check with #1 above). Finally, we would like to suggest two things: please include other human cell lines as the controls: http://www.proteinatlas.org/ENSG00000118217-ATF6/antibody shows the WB positive results derived from using two cell lines and one organ. These could be used as the positive control. Also, the glycosylation levels are likely to be different in the different cells/tissues/organs, and therefor the different sizes of ATF can be viewed. The second thing is to use a real positive control lysate, such as ATF6 cell lysate or ATF6 overexpression lysate for the specificity of NBP1-40256.
-
Q: We are looking for an antibody specific to ATF6 alpha that will not cross-react with ATF6 beta. Would you please help confirm if any of the following are ATF6 alpha specific antibodies: NBP1-40256, NBP1-77251, NBP1-76675 & NBP1-41439?
A:
The antibodies NBP1-77251 and NBP1-76675 are specific to ATF6 alpha and should not cross-react with ATF6 beta.