
BICD1 Antibody - BSA Free
Novus Biologicals | Catalog # NBP1-78735

![Western Blot: BICD1 Antibody [NBP1-78735]](https://resources.rndsystems.com/images/products/BICD1-Antibody-Western-Blot-NBP1-78735-img0004.jpg "Western Blot: BICD1 Antibody [NBP1-78735]")
![Western Blot: BICD1 Antibody [NBP1-78735]](https://resources.rndsystems.com/images/products/BICD1-Antibody-Western-Blot-NBP1-78735-img0002.jpg "Western Blot: BICD1 Antibody [NBP1-78735]")
Scientific images may be resized, cropped, or adjusted for brightness or contrast for presentation purposes. These updates are limited to presentation and do not affect the underlying scientific interpretation of the data. Where available, additional source data may be provided upon request.
Key Product Details
Validated by
Species Reactivity
Validated:
Cited:
Applications
Validated:
Cited:
Label
Antibody Source
Format
Product Specifications
Immunogen
Clonality
Host
Isotype
Scientific Data Images for BICD1 Antibody - BSA Free
Western Blot: BICD1 Antibody [NBP1-78735]
Western Blot: BICD1 Antibody [NBP1-78735] - Whole cell lysate from Jurkat (15 and 50 mcg for WB; 1 mg for IP, 20% of IP loaded), 293T (T; 50 mcg) and HeLa (H; 50 mcg) cells. Affinity purified rabbit anti-BICD1 antibody used for WB at 0.1 mcg/ml (A) and 1 mcg/ml (B) and used for IP at 6 mcg/mg lysate. BICD1 was also immunoprecipitated by rabbit anti-BICD1 antibody NBP1-78734 which recognizes an upstream epitope.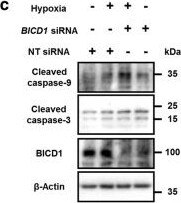
Western Blot: BICD1 Antibody [NBP1-78735] -
Western Blot: BICD1 Antibody [NBP1-78735] - Role of BICD1 in UCB-MSCs survival under hypoxia. a, b The UCB-MSCs were transfected with BICD1 or NT siRNA for 24 h prior to hypoxia treatment. a Cells were exposed to various durations of hypoxia (0–72 h). Cell viability of UCB-MSCs was measured by WST-1 cell viability assay. n = 8. b Cells were incubated in normoxia or hypoxia conditions for 72 h. Representative images of experimental groups at 0, 24, 48, & 72 h of normoxia or hypoxia incubation are presented. Red-marked cells in representative images indicate PI-positive cells. n = 4. Scale bars are 50 μm (Magnification, × 200). cBICD1 or NT siRNA-transfected cells were incubated in hypoxia for 24 h. Cleaved caspase-9, cleaved caspase-3, & beta -Actin protein expressions were detected by western blot analysis. n = 4. d Cells were transfected with BICD1 or NT siRNA for 24 h prior to hypoxia treatment for 48 h. The percentages of apoptotic cells were analyzed by Annexin V/PI analysis, measured by flowcytometer. Annexin V-positive cells were considered as apoptotic cells. n = 4. Quantitative data are presented as a mean ± S.E.M. All blot images are representative. *p < 0.05 vs. normoxia control with NT siRNA transfection, #p < 0.05 vs. hypoxia with NT siRNA transfection. e The UCB-MSCs were transfected with pcDNA3.1/BICD1-cEGFP vector, pcDNA3.1/cEGFP vector, HIF1A siRNA or NT siRNA for 24 h prior to hypoxia treatment for 72 h. Cell viability data are presented as a mean ± S.E.M. n = 5. *p < 0.05 vs. normoxia control with pcDNA3.1/cEGFP vector & NT siRNA cotransfection, #p < 0.05 vs. hypoxia control with pcDNA3.1/cEGFP vector & NT siRNA cotransfection, @p < 0.05 vs. hypoxia control with pcDNA3.1/BICD1-cEGFP vector & NT siRNA cotransfection Image collected & cropped by CiteAb from the following publication (https://pubmed.ncbi.nlm.nih.gov/30464225), licensed under a CC-BY license. Not internally tested by Novus Biologicals.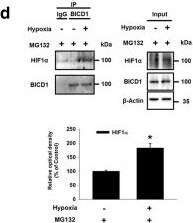
Western Blot: BICD1 Antibody [NBP1-78735] -
Western Blot: BICD1 Antibody [NBP1-78735] - Effect of hypoxia on the interaction between HIF1 alpha & BICD1. a Co-immunoprecipitation of HIF1 alpha, Dynein IC, Importin alpha 3, RanBP2 w/ IgG & BICD1 antibodies shown in left panel. Total protein expressions in lysate shown in right panel. n = 3. b Cells immunostained w/ HIF1 alpha & BICD1-specific antibodies. Scale bars are 8 μm (Magnification, × 1,000). White arrow heads indicate co-localization of HIF1 alpha w/ BICD1. c Interaction between HIF1 alpha & BICD1 (HIF1 alpha /BICD1, red) analyzed by PLA. Scale bars are 8 μm (Magnification, × 1,000). n = 6. *p < 0.05 vs. normoxia control. d–f Cells pretreated w/ MG132 (1 μM) for 30 min prior to hypoxia treatment for 24 h. d Co-immunoprecipitation of HIF1 alpha w/ IgG & BICD1 shown in left panel. Total protein expressions in lysate shown in right panel. n = 3. e Cells immunostained w/ HIF1 alpha & BICD1-specific antibodies. White arrow heads indicate co-localization of HIF1 alpha w/ BICD1 in MG132-pretreated UCB-MSCs. Scale bars are 8 μm (Magnification, × 1,000). n = 5. f HIF1 activity measured by dual luciferase reporter assay. n = 6. *p < 0.05 vs. normoxia control w/ MG132 pretreatment. g, h Cells transfected w/ BICD1 or NT siRNA for 24 h prior to hypoxia treatment for 24 h. g Co-immunoprecipitation of Dynein IC w/ IgG & HIF1 alpha antibodies shown in left panel. Total protein expressions in lysate shown in right panel. n = 3. h Interaction between HIF1 alpha & Dynein IC (HIF1 alpha /Dynein IC, red) analyzed by PLA. Scale bars are 8 μm (Magnification, × 1,000). Quantitative data are presented as a mean ± S.E.M. All blots & immunofluorescence images are representative. *p < 0.05 vs. normoxia control w/ NT siRNA transfection, #p < 0.05 vs. hypoxia w/ NT siRNA transfection Image collected & cropped by CiteAb from the following publication (https://pubmed.ncbi.nlm.nih.gov/30464225), licensed under a CC-BY license. Not internally tested by Novus Biologicals.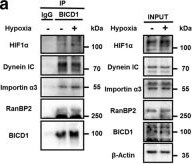
Western Blot: BICD1 Antibody [NBP1-78735] -
Western Blot: BICD1 Antibody [NBP1-78735] - Effect of hypoxia on the interaction between HIF1 alpha & BICD1. a Co-immunoprecipitation of HIF1 alpha, Dynein IC, Importin alpha 3, RanBP2 w/ IgG & BICD1 antibodies shown in left panel. Total protein expressions in lysate shown in right panel. n = 3. b Cells immunostained w/ HIF1 alpha & BICD1-specific antibodies. Scale bars are 8 μm (Magnification, × 1,000). White arrow heads indicate co-localization of HIF1 alpha w/ BICD1. c Interaction between HIF1 alpha & BICD1 (HIF1 alpha /BICD1, red) analyzed by PLA. Scale bars are 8 μm (Magnification, × 1,000). n = 6. *p < 0.05 vs. normoxia control. d–f Cells pretreated w/ MG132 (1 μM) for 30 min prior to hypoxia treatment for 24 h. d Co-immunoprecipitation of HIF1 alpha w/ IgG & BICD1 shown in left panel. Total protein expressions in lysate shown in right panel. n = 3. e Cells immunostained w/ HIF1 alpha & BICD1-specific antibodies. White arrow heads indicate co-localization of HIF1 alpha w/ BICD1 in MG132-pretreated UCB-MSCs. Scale bars are 8 μm (Magnification, × 1,000). n = 5. f HIF1 activity measured by dual luciferase reporter assay. n = 6. *p < 0.05 vs. normoxia control w/ MG132 pretreatment. g, h Cells transfected w/ BICD1 or NT siRNA for 24 h prior to hypoxia treatment for 24 h. g Co-immunoprecipitation of Dynein IC w/ IgG & HIF1 alpha antibodies shown in left panel. Total protein expressions in lysate shown in right panel. n = 3. h Interaction between HIF1 alpha & Dynein IC (HIF1 alpha /Dynein IC, red) analyzed by PLA. Scale bars are 8 μm (Magnification, × 1,000). Quantitative data are presented as a mean ± S.E.M. All blots & immunofluorescence images are representative. *p < 0.05 vs. normoxia control w/ NT siRNA transfection, #p < 0.05 vs. hypoxia w/ NT siRNA transfection Image collected & cropped by CiteAb from the following publication (https://pubmed.ncbi.nlm.nih.gov/30464225), licensed under a CC-BY license. Not internally tested by Novus Biologicals.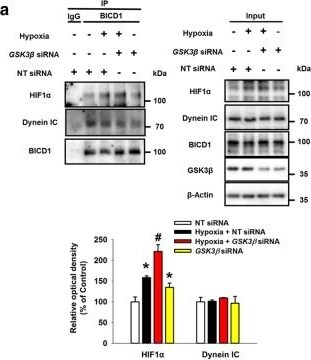
Western Blot: BICD1 Antibody [NBP1-78735] -
Western Blot: BICD1 Antibody [NBP1-78735] - Involvement of Akt/GSK3 beta pathway in BICD1-mediated HIF1 alpha nuclear translocation. a–e The UCB-MSCs were transfected with GSK3 beta or NT siRNA for 24 h prior to hypoxia treatment for 24 h. a Co-immunoprecipitation of HIF1 alpha & Dynein IC with IgG & BICD1 antibodies were shown in left panel. Total protein expressions in lysate were shown in right panel. n = 3. b Interaction between HIF1 alpha & BICD1 (HIF1 alpha /BICD1, red) was analyzed by PLA assay. Scale bars are 8 μm (Magnification, × 1,000). n = 5. c HIF1 alpha, Lamin A/C, & alpha -Tubulin in cytosolic & nuclear fractionized samples were detected by western blot. n = 4. d Cells were immunostained with HIF1 alpha -specific antibody. Scale bars are 8 μm (Magnification, × 1,000). n = 4. e HIF1 activities in NT or GSK3 beta siRNA-transfected cells were analyzed by dual luciferase reporter assay. n = 6. Quantitative data are presented as a mean ± S.E.M. All blots & immunofluorescence images are representative. *p < 0.05 vs. normoxia control with NT siRNA transfection, #p < 0.05 vs. hypoxia with NT siRNA transfection Image collected & cropped by CiteAb from the following publication (https://pubmed.ncbi.nlm.nih.gov/30464225), licensed under a CC-BY license. Not internally tested by Novus Biologicals.Applications for BICD1 Antibody - BSA Free
Immunoprecipitation
Western Blot
Formulation, Preparation, and Storage
Purification
Formulation
Format
Preservative
Concentration
Shipping
Stability & Storage
Background: BICD1
Alternate Names
Gene Symbol
UniProt
Additional BICD1 Products
Product Documents for BICD1 Antibody - BSA Free
Certificate of Analysis
To download a Certificate of Analysis, please enter a lot or batch number in the search box below.
Product Specific Notices for BICD1 Antibody - BSA Free
This product is for research use only and is not approved for use in humans or in clinical diagnosis. Primary Antibodies are guaranteed for 1 year from date of receipt.
Citations for BICD1 Antibody - BSA Free
 Powered by Bioz
Customer Reviews for BICD1 Antibody - BSA Free
There are currently no reviews for this product. Be the first to review BICD1 Antibody - BSA Free and earn rewards!
Have you used BICD1 Antibody - BSA Free?
Submit a review and receive an Amazon gift card!
$25/€18/£15/$25CAN/¥2500 for a review with an image
$10/€7/£6/$10CAN/¥1110 for a review without an image
Submit a review
Protocols
Find general support by application which include: protocols, troubleshooting, illustrated assays, videos and webinars.
- Cellular Response to Hypoxia Protocols
- Immunoprecipitation Protocol
- R&D Systems Quality Control Western Blot Protocol
- Troubleshooting Guide: Western Blot Figures
- Western Blot Conditions
- Western Blot Protocol
- Western Blot Protocol for Cell Lysates
- Western Blot Troubleshooting
- Western Blot Troubleshooting Guide
- View all Protocols, Troubleshooting, Illustrated assays and Webinars