PECAM-1 (Platelet-Endothelial Cell Adhesion Molecule-1), also known as CD31, is a 130 kDa type I transmembrane glycoprotein adhesion molecule in the immunoglobulin superfamily (1, 2). Expression is restricted to cells involved in circulation, especially endothelial cells, platelets, monocytes, neutrophils and lymphocyte subsets. PECAM-1 is concentrated at cell-cell junctions and is required for Transendothelial Migration (TEM) (1-3). The Extracellular Domain (ECD) of PECAM-1 has ten potential N-linked glycosylation sites and six C2-type Ig-like domains, the first of which is critical for adhesion and extravasation (3, 4). The cytoplasmic domain contains Immunoregulatory Tyrosine-based Inhibitory and Switch Motifs (ITIM, ITSM) that mediate both inhibition and activation via phosphotyrosine-mediated engagement of SH2-containing signaling molecules (1, 5). Metalloproteinase-mediated ectodomain shedding occurs during apoptosis (6) but increased serum PECAM-1 ectodomain in HIV and active multiple sclerosis occurs independent of apoptosis (7, 8). In humans, expression of six isoforms with exon deletions in the cytoplasmic domain is tissue- and stage-specific, but full-length PECAM-1 is predominant. A form lacking the ITSM predominates in mouse (9). Mouse PECAM-1 ECD shows 77%, 63%, 63%, 63%, and 61% amino acid (aa) identity with rat, human, canine, porcine, and bovine PECAM-1, respectively. PECAM-1 participates with other adhesion molecules in some functions, but is the critical molecule for TEM. Homotypic PECAM-1 adhesion in trans, combined with cycling of PECAM-1 to and from surface-connected endothelial cell vesicles, leads leukocytes across endothelial tight junctions (3, 10). Homotypic adhesion and signaling functions also strongly suppress mitochondria-dependent apoptosis (11). In platelets, PECAM-1 is necessary for limiting thrombus formation (12) and promoting integrin-mediated clot retraction and platelet spreading (13), but mechanisms for these phenomena are unclear. PECAM-/- mice are deficient in chemokine-mediated chemotaxis (14).
CD31/PECAM-1 Antibody
R&D Systems | Catalog # AF3628

Key Product Details
Validated by
Species Reactivity
Validated:
Cited:
Applications
Validated:
Cited:
Label
Antibody Source
Product Specifications
Immunogen
Glu18-Lys590
Accession # Q08481
Specificity
Clonality
Host
Isotype
Scientific Data Images for CD31/PECAM-1 Antibody
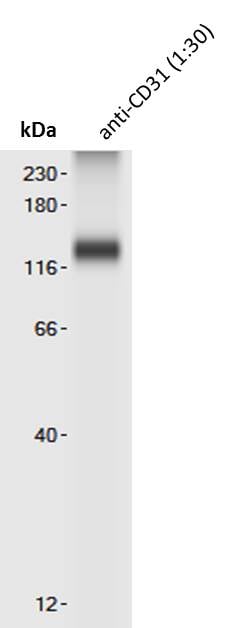
Detection of Mouse CD31/PECAM‑1 by Western Blot.
Western blot shows lysates of bEnd.3 mouse endothelioma cell line. PVDF membrane was probed with 0.5 µg/mL of Goat Anti-Human/Mouse/Rat CD31/PECAM-1 Antigen Affinity-purified Polyclonal Antibody (Catalog # AF3628) followed by HRP-conjugated Anti-Goat IgG Secondary Antibody (HAF017). A specific band was detected for CD31/PECAM-1 at approximately 130 kDa (as indicated). This experiment was conducted under reducing conditions and using Immunoblot Buffer Group 1.
Detection of Mouse CD31/PECAM‑1 by Simple WesternTM.
Simple Western shows lysates of bEnd.3 mouse endothelioma cell line, loaded at 0.5 mg/ml. A specific band was detected for CD31/PECAM‑1 at approximately 165 kDa (as indicated) using 10 µg/mL of Goat Anti-Human/Mouse/Rat CD31/PECAM‑1 Antigen Affinity-purified Polyclonal Antibody (Catalog # AF3628). This experiment was conducted under reducing conditions and using the 12-230kDa separation system.
Detection of CD31/PECAM‑1 in Mouse Splenocytes by Flow Cytometry.
Mouse splenocytes were stained with Goat Anti-Human/Mouse/Rat CD31/PECAM-1 Antigen Affinity-purified Polyclonal Antibody (Catalog # AF3628, filled histogram) or control antibody (AB-108-C, open histogram), followed by Allophycocyanin-conjugated Anti-Goat IgG Secondary Antibody (F0108).
Detection of CD31/PECAM‑1 in Rat Splenocytes by Flow Cytometry.
Rat splenocytes were stained with Goat Anti-Human/Mouse/Rat CD31/PECAM-1 Antigen Affinity-purified Polyclonal Antibody (Catalog # AF3628, filled histogram) or isotype control antibody (AB-108-C, open histogram), followed by Allophycocyanin-conjugated Anti-Goat IgG Secondary Antibody (F0108).
CD31/PECAM‑1 in bEnd.3 Mouse Cell Line.
CD31/PECAM-1 was detected in immersion fixed bEnd.3 mouse endothelioma cell line using Goat Anti-Human/Mouse/Rat CD31/PECAM-1 Antigen Affinity-purified Polyclonal Antibody (Catalog # AF3628) at 10 µg/mL for 3 hours at room temperature. Cells were stained using the NorthernLights™ 493-conjugated Anti-Goat IgG Secondary Antibody (green; NL003) and counterstained with DAPI (blue). Specific staining was localized to cell membrane. View our protocol for Fluorescent ICC Staining of Cells on Coverslips.
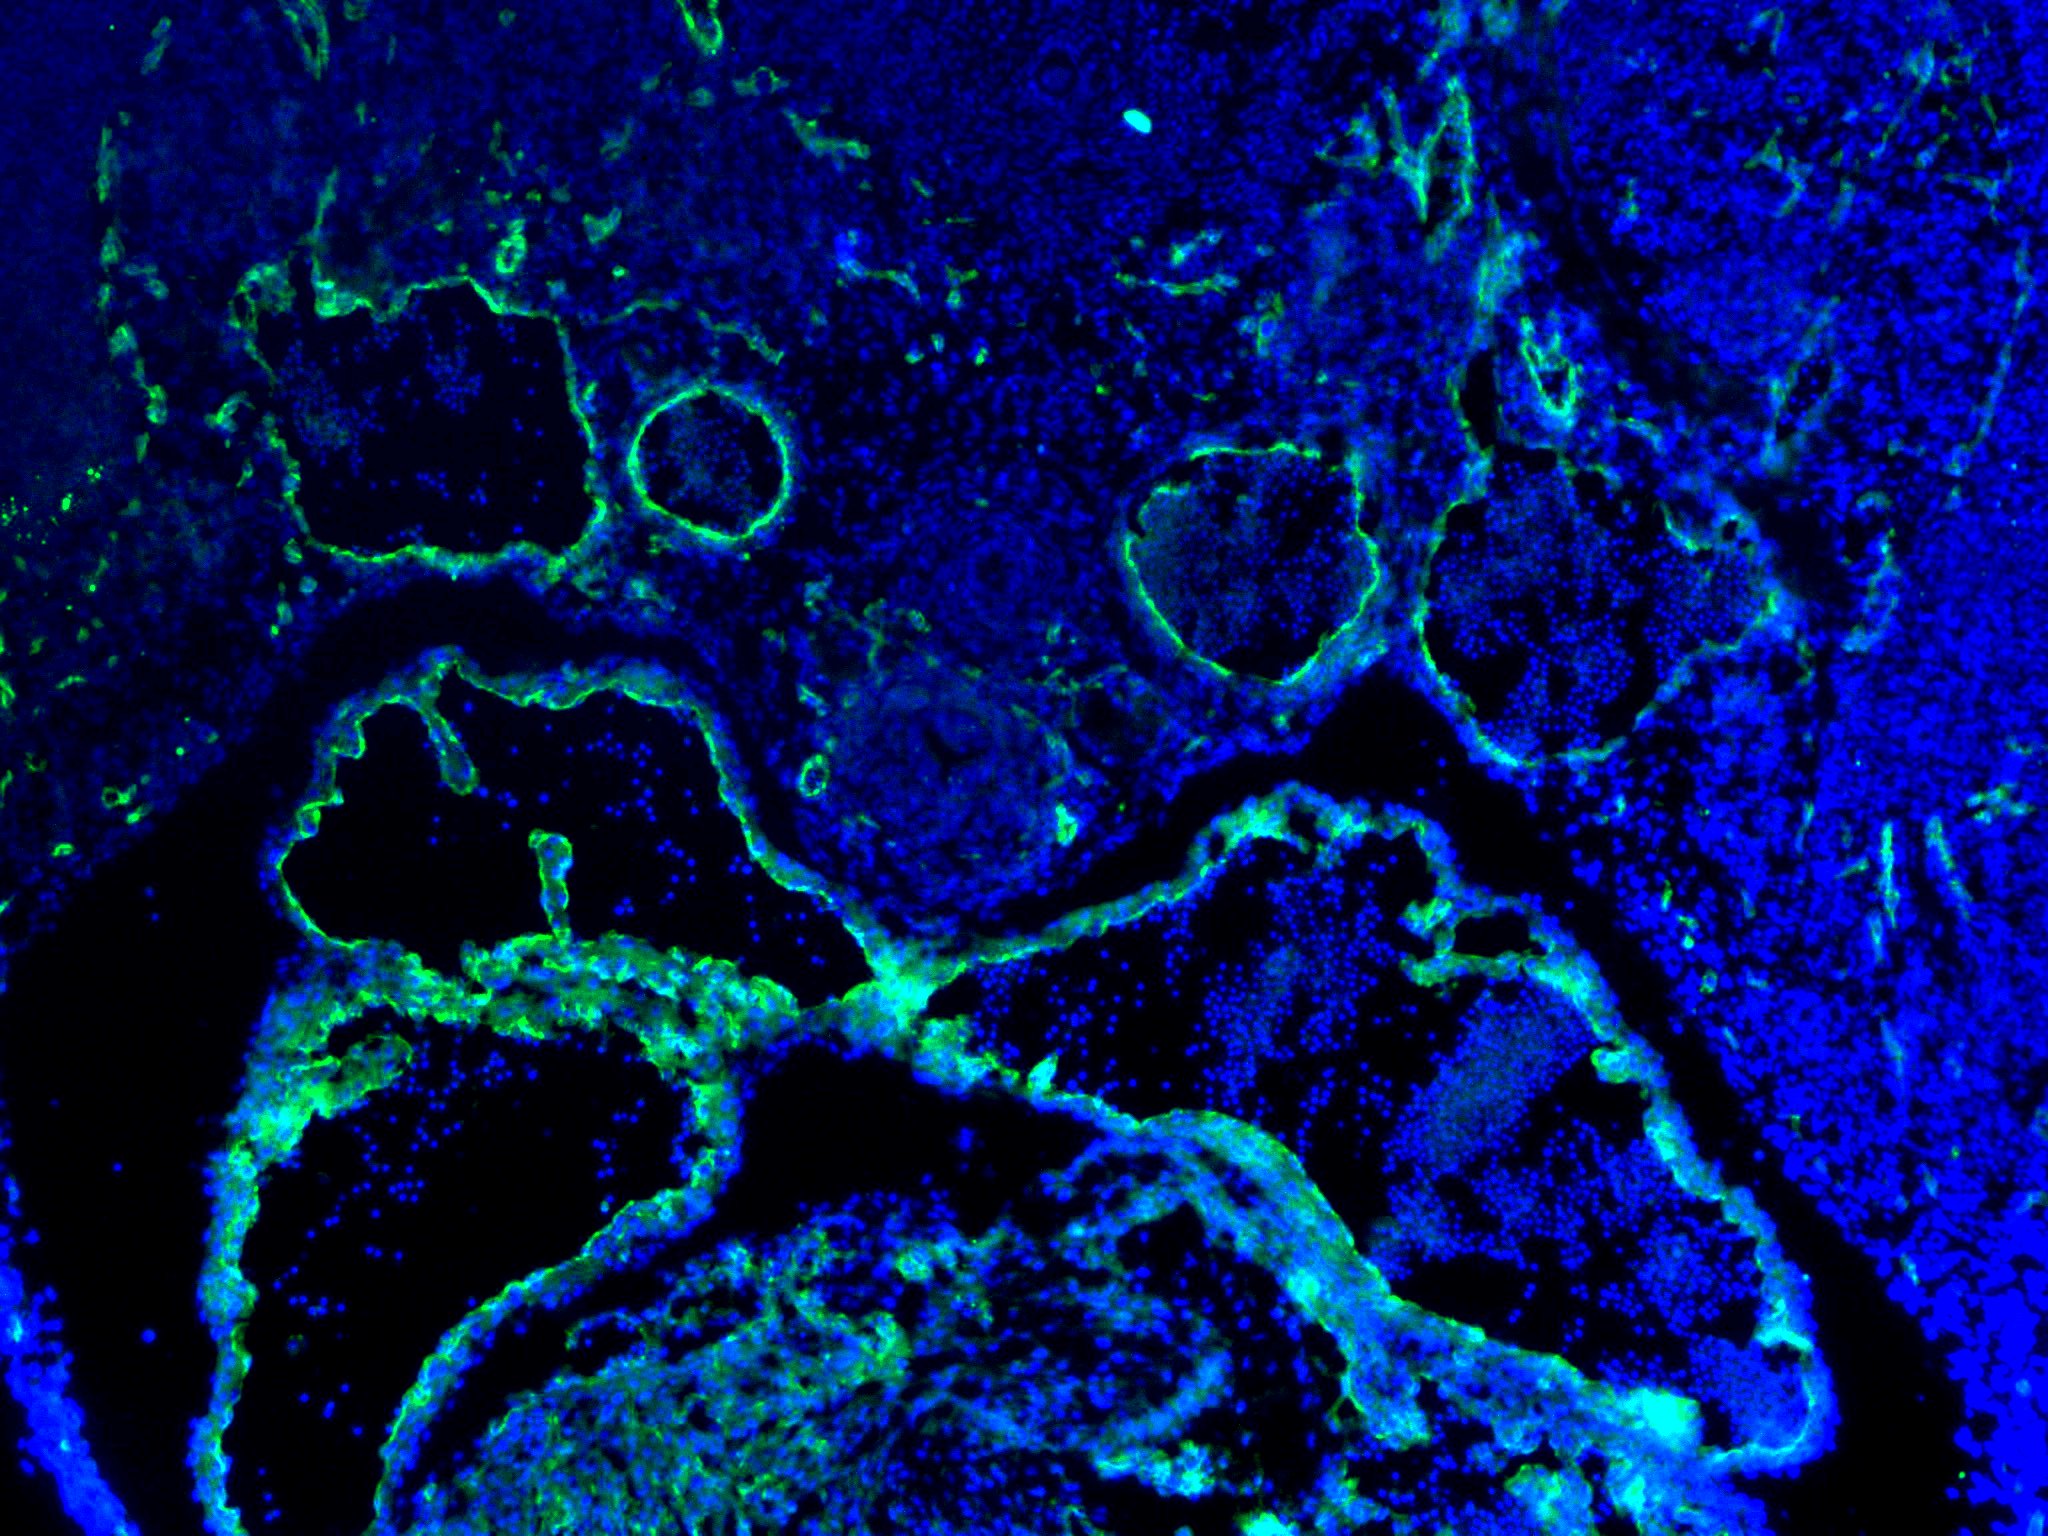
CD31/PECAM‑1 in Mouse Embryo.
CD31/PECAM-1 was detected in immersion fixed frozen sections of mouse embryo (E13.5) using Goat Anti-Human/Mouse/Rat CD31/PECAM-1 Antigen Affinity-purified Polyclonal Antibody (Catalog # AF3628) at 10 µg/mL overnight at 4 °C. Tissue was stained using the NorthernLights™ 557-conjugated Anti-Goat IgG Secondary Antibody (yellow; NL001) and counterstained with DAPI (blue). Specific staining was localized to developing endothelium. View our protocol for Fluorescent IHC Staining of Frozen Tissue Sections.
CD31/PECAM‑1 in Mouse Embryo.
CD31/PECAM-1 was detected in immersion fixed frozen sections of mouse embryo (14 d.p.c.) using Goat Anti-Human/Mouse/Rat CD31/PECAM-1 Antigen Affinity-purified Polyclonal Antibody (Catalog # AF3628) at 10 µg/mL for 1 hour at room temperature followed by incubation with the Anti-Goat IgG VisUCyte™ HRP Polymer Antibody (VC004). Tissue was stained using DAB (brown) and counterstained with hematoxylin (blue). Specific staining was localized to developing guts. View our protocol for IHC Staining with VisUCyte HRP Polymer Detection Reagents.
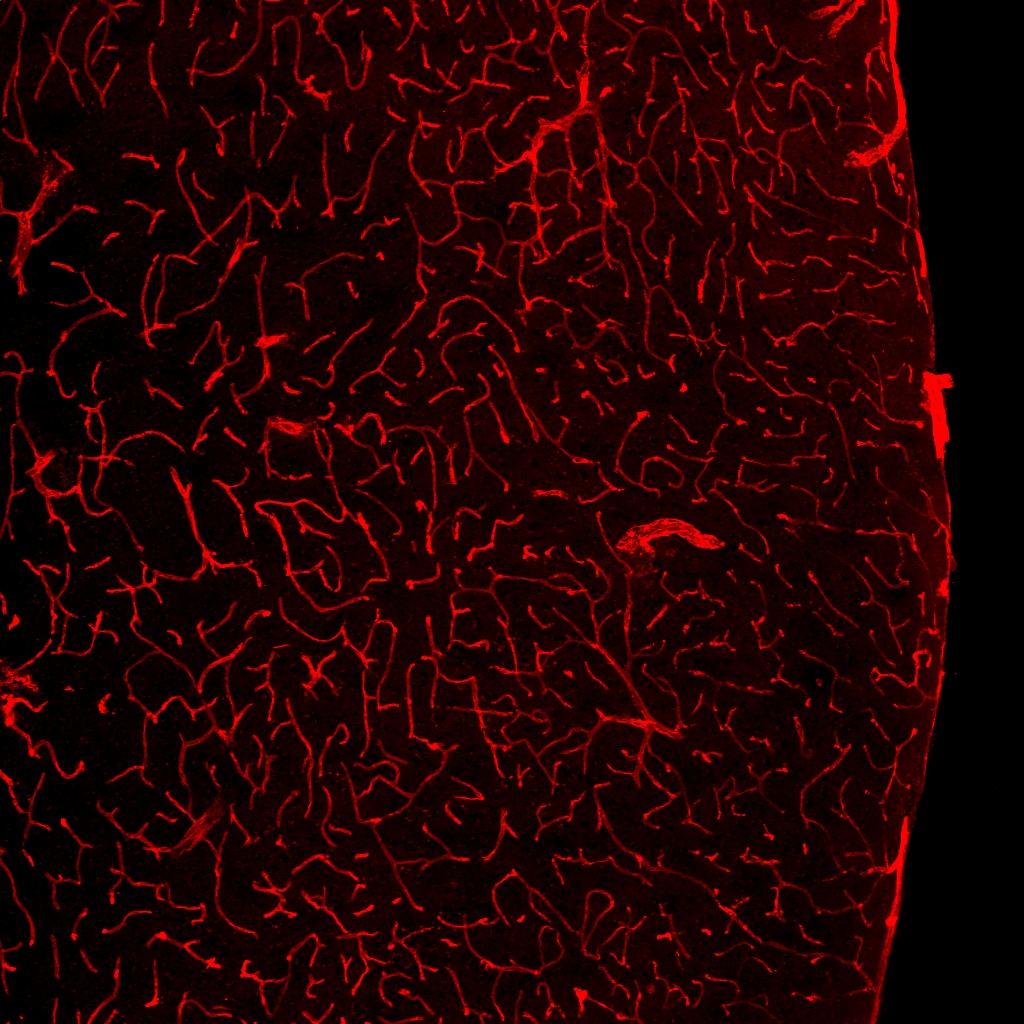
CD31/PECAM‑1 in Rat Heart.
CD31/PECAM‑1 was detected in immersion fixed paraffin-embedded sections of rat heart using Goat Anti-Human/Mouse/Rat CD31/PECAM‑1 Antigen Affinity-purified Polyclonal Antibody (Catalog # AF3628) at 3 µg/mL for 1 hour at room temperature followed by incubation with the Anti-Mouse IgG VisUCyte™ HRP Polymer Antibody (VC001). Before incubation with the primary antibody, tissue was subjected to heat-induced epitope retrieval using Antigen Retrieval Reagent-Basic (CTS013). Tissue was stained using DAB (brown) and counterstained with hematoxylin (blue). Specific staining was localized to endothelial cells in vasculature.
Detection of CD31/PECAM‑1 in Human Placenta.
CD31/PECAM‑1 was detected in immersion fixed paraffin-embedded sections of Human Placenta using Goat Anti-Human/Mouse/Rat CD31/PECAM‑1 Antigen Affinity-purified Polyclonal Antibody (Catalog # AF3628) at 15 µg/mL for 1 hour at room temperature followed by incubation with the Anti-Goat IgG VisUCyte™ HRP Polymer Antibody (Catalog # VC004). Before incubation with the primary antibody, tissue was subjected to heat-induced epitope retrieval using VisUCyte Antigen Retrieval Reagent-Basic (Catalog # VCTS021). Tissue was stained using DAB (brown) and counterstained with hematoxylin (blue). Specific staining was localized to endothelial cells in chorionic villi. View our protocol for IHC Staining with VisUCyte HRP Polymer Detection Reagents.
Detection of CD31/PECAM‑1 in HUVEC cells by Flow Cytometry.
HUVEC cells were stained with Goat Anti-Human/Mouse/Rat CD31/PECAM‑1 Antigen Affinity-purified Polyclonal Antibody (Catalog # AF3628, filled histogram) or isotype control antibody (Catalog # AB-108-C, open histogram), followed by Phycoerythrin-conjugated Anti-Goat IgG Secondary Antibody (Catalog # F0107). View our protocol for Staining Membrane-associated Proteins.
Detection of Human CD31/PECAM‑1 by Western Blot.
Western blot shows lysates of U937 human histiocytic lymphoma cell line. PVDF membrane was probed with 0.5 µg/ml of Goat Anti-Human/Mouse/Rat CD31/PECAM‑1 Antigen Affinity-purified Polyclonal Antibody (AF3628) followed by HRP-conjugated Anti-Goat IgG Secondary Antibody (Catalog # HAF017). A specific band was detected for CD31/PECAM‑1 at approximately 130 kDa (as indicated). This experiment was conducted under reducing conditions and using Western Blot Buffer Group 1.
Detection of Mouse CD31/PECAM-1 by Immunohistochemistry
Representative image of immunostaining corresponding to the glucose transporter protein SLC2A1 (GLUT1) in 30 week-old Ins2AKITA and WT cerebral cortex. Mural cells (ANPEP, green), glucose transporter 1 (GLUT1, red), endothelium (PECAM1, cyan). n = 2, scale bar 50 µm. Image collected and cropped by CiteAb from the following publication (https://pubmed.ncbi.nlm.nih.gov/30498224), licensed under a CC-BY license. Not internally tested by R&D Systems.
Detection of Human CD31/PECAM-1 by Western Blot
AcSDKP suppresses TGF beta /smad signaling and EndMT through the FGFR1/FRS2 pathway. (a) HMVECs were treated with N-FGFR1 for 48 h, and the FGFR1, TGF beta R1 and TGF beta R2 protein levels were analyzed by western blot. (b) HMVECs were treated with TGF beta 2 in the presence or absence of N-FGFR1 for 15 min with or without AcSDKP preincubation. The p-smad3 and TGF beta R1 protein levels were analyzed by western blot. Densitometric analysis of the p-smad3/smad3 and TGF beta R1/ beta -actin levels (n=3) in each group was performed. (c) HMVECs were incubated with either N-FGFR1 in the presence or absence of TGF beta 2 for 48 h with or without preincubation with AcSDKP for 2 h or with N-FGFR1 in the presence or absence of TGF beta 2 for 48 h with or without 24 h of incubation with FGF2 (50 ng/ml). The CD31, SM22 alpha, FSP1 and alpha -SMA protein levels were analyzed by western blot. (d) HMVECs were transfected with FRS2 siRNA (100 nM) for 48 h with or without AcSDKP preincubation. The VE-cadherin, FSP1, vimentin, SM22 alpha and p-smad3 levels were analyzed by western blot. (e) HMVECs were treated with N-FGFR1 for 48 h or 15 min in the presence or absence of N-TGF beta (1, 2, 3) (1.0 μg/ml). The CD31, VE-cadherin, SM22 alpha, FSP1, TGF beta R1, TGF beta R2 and p-smad3 levels were analyzed by western blot Image collected and cropped by CiteAb from the following publication (https://pubmed.ncbi.nlm.nih.gov/28771231), licensed under a CC-BY license. Not internally tested by R&D Systems.
Detection of Mouse CD31/PECAM-1 by Immunocytochemistry/Immunofluorescence
AcSDKP inhibits TGF beta /smad signaling and EndMT and restores the FGFR1 and P-MAP4K4 levels in diabetic hearts. (a) Immunofluorescence microscopy analysis of CD31/FGFR1 and CD31/P-MAP4K4 in the heart tissues from each group of mice. The scale bar is 60 μm in each panel. The CD31 and FGFR1 double-labeled cells and the CD31 and P-MAP4K4 double-labeled cells in each visual field were assessed by fluorescence microscopy and quantified. For each section, images from six different fields of view at × 400 magnification were evaluated. (b and c) Immunofluorescence microscopy analysis of CD31/ alpha -SMA, VE-cadherin /SM22 alpha and CD31/p-smad3 expression levels in the heart tissues from each group of mice. The scale bar is 60 μm in each panel. The CD31 and alpha -SMA double-labeled cells, the VE-cadherin and SM22 alpha double-labeled cells and the CD31 and p-smad3 double-labeled cells in each visual field were analyzed by fluorescence microscopy and quantified. For each section, images from six different fields of view at × 400 magnification were evaluated. Four mice from each group were analyzed. (d) Western blot analysis of the FGFR1, P-MAP4K4, TGF beta 1, TGF beta 2 and TGF beta 3 levels in cardiac tissues. A representative blot from four independent experiments was shown. The densitometric analysis of western blot data was presented (n=4). The diabetic mice are abbreviated as DM in the figure Image collected and cropped by CiteAb from the following publication (https://pubmed.ncbi.nlm.nih.gov/28771231), licensed under a CC-BY license. Not internally tested by R&D Systems.
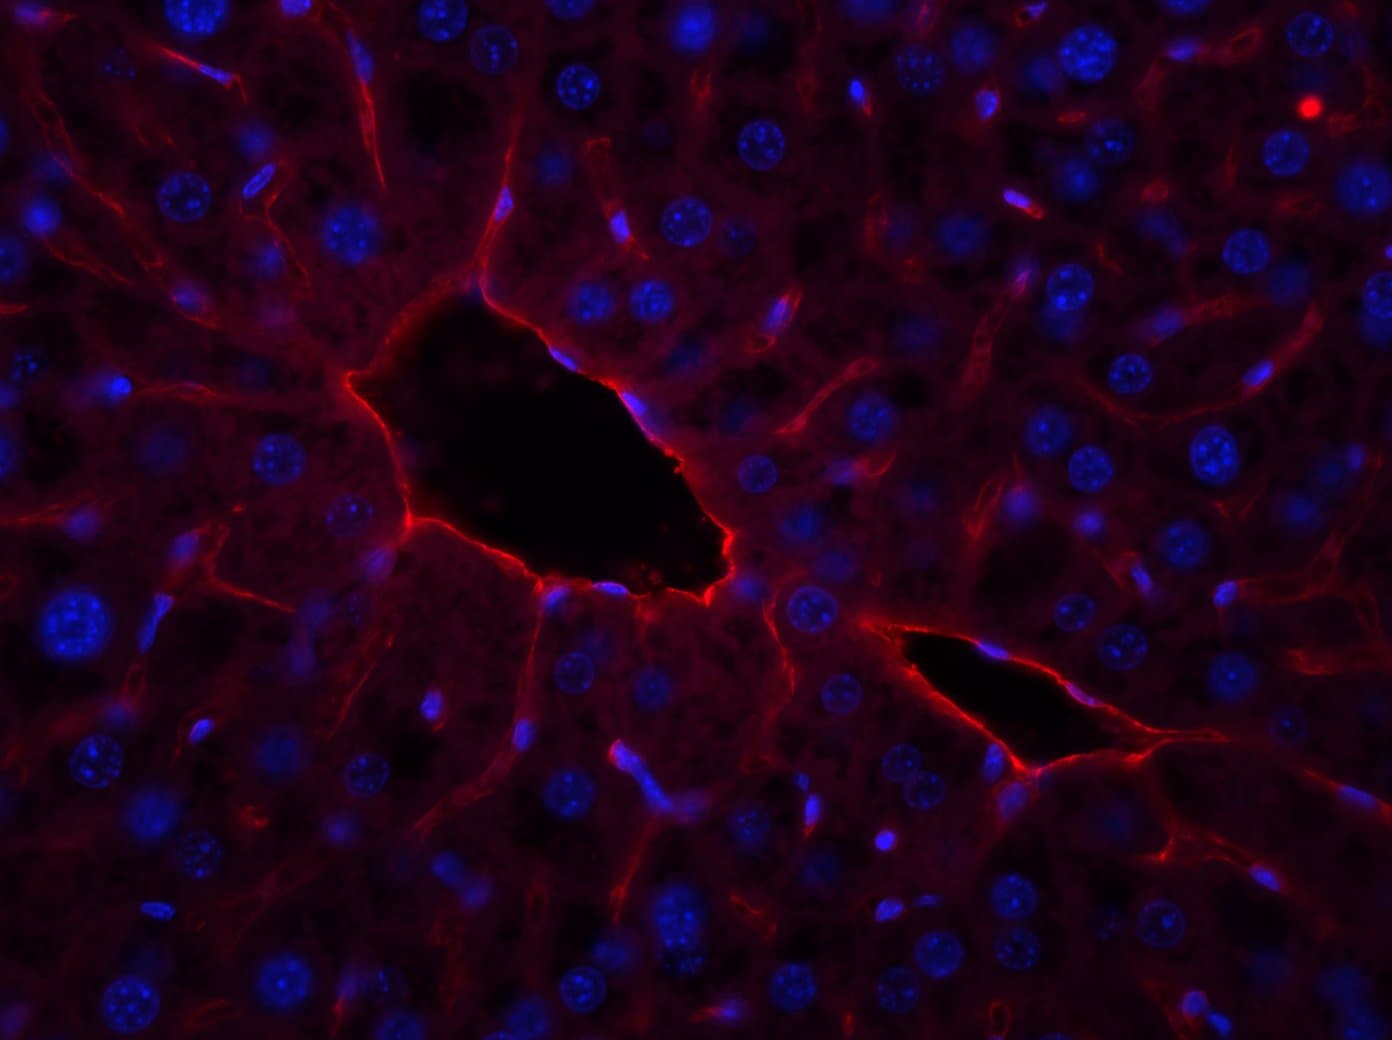
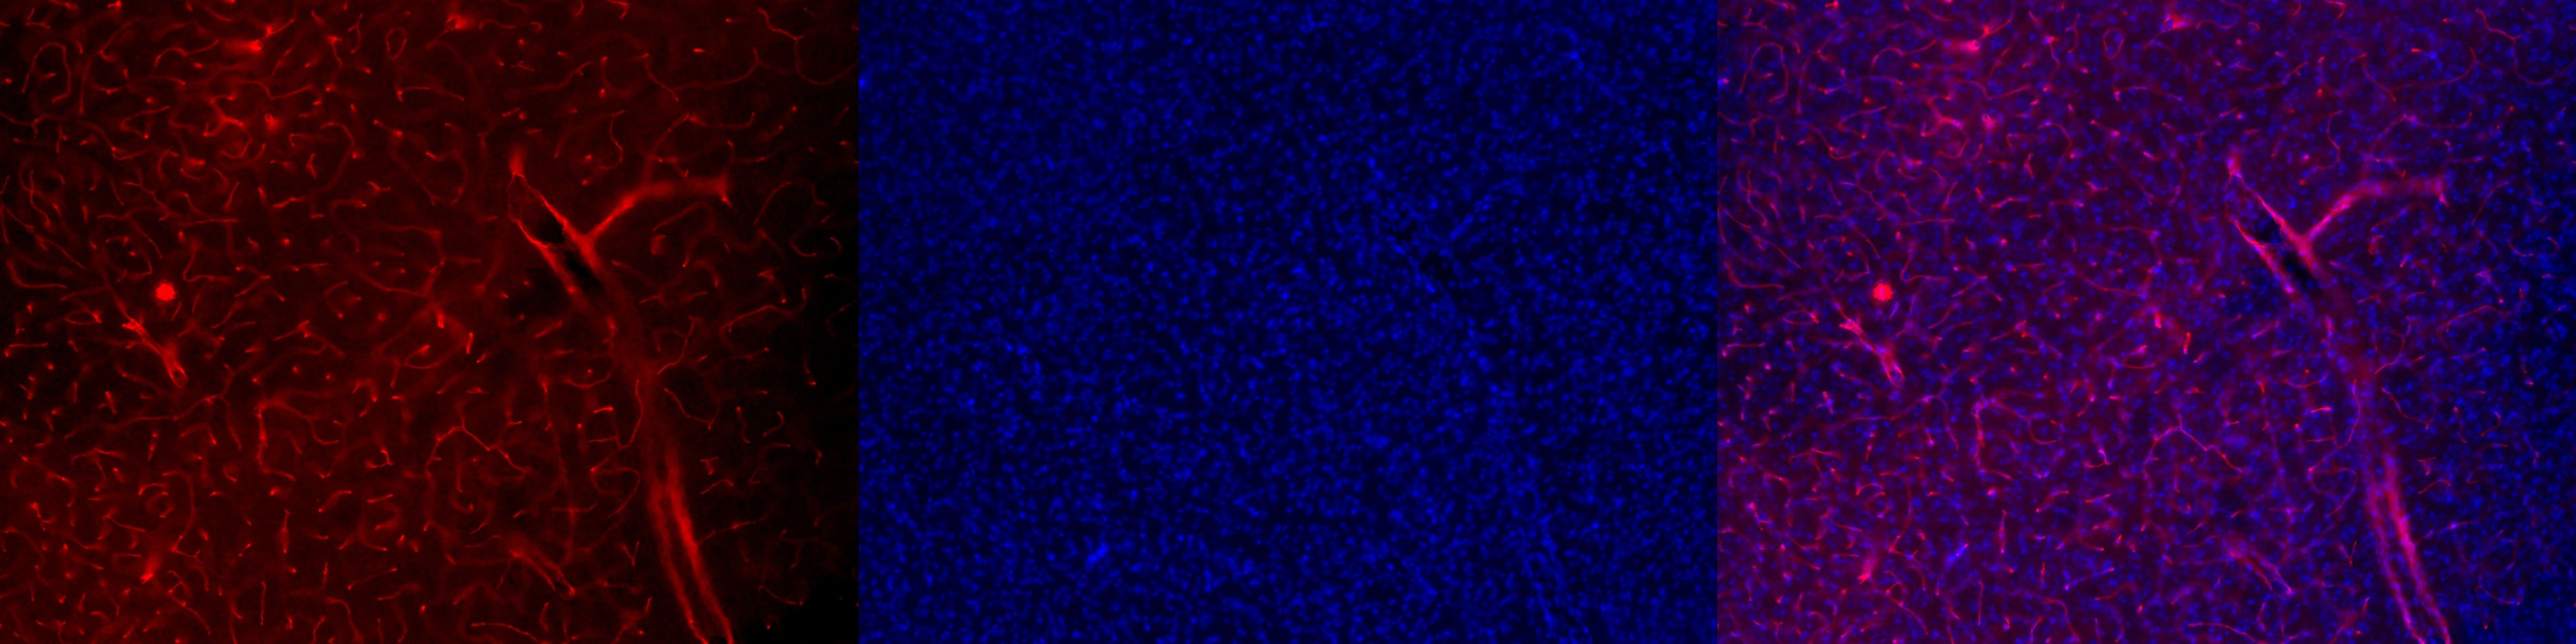
Detection of Mouse CD31/PECAM-1 by Immunocytochemistry/Immunofluorescence
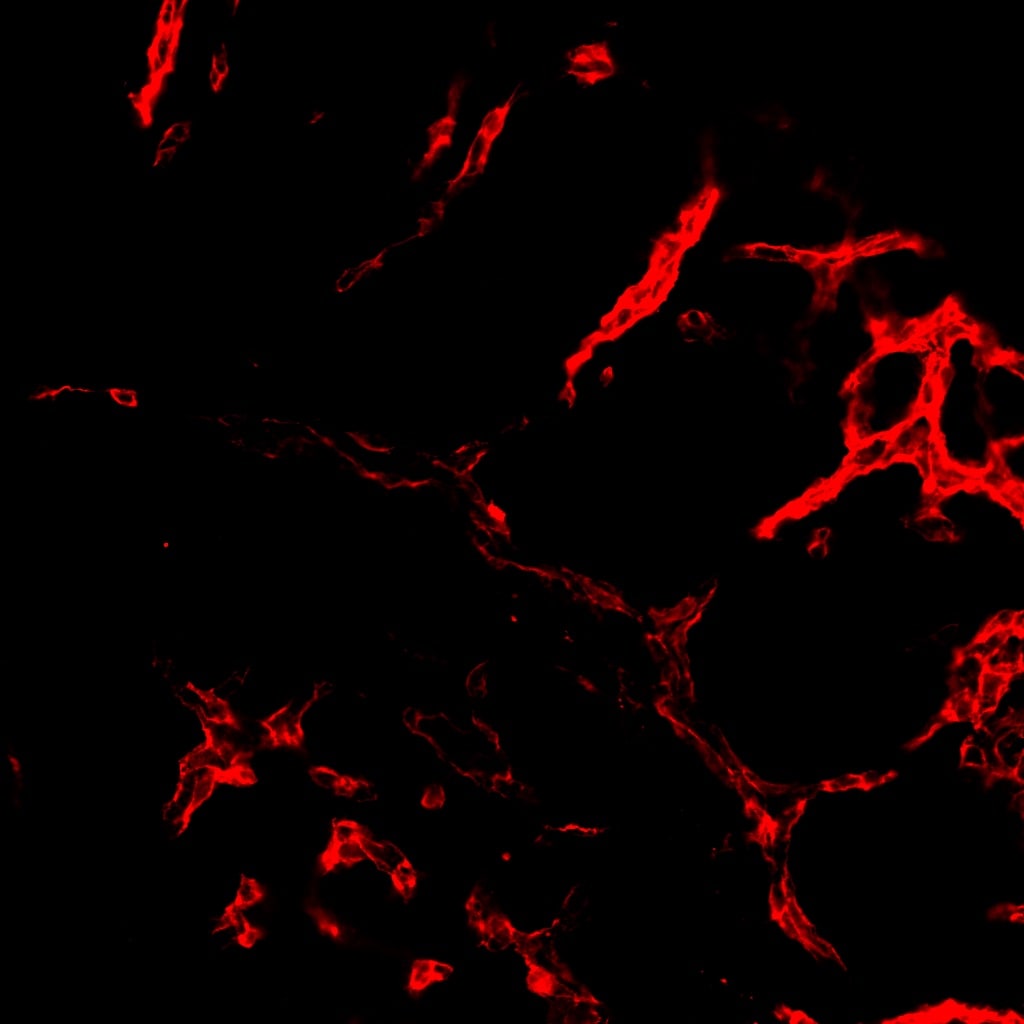
Diminished permeability of liver sinusoids in Plvap-deficient mice.Neither by immunohistochemistry with antibodies against CD31 (A) nor by light microscopy of 1 µm semi-thin sections (B, Richardson's stain) obvious differences are detected with regards to the overall orientation and the density of liver sinusoids between 3-week-old Plvap-/- mice and wild-type littermates. Sinusoids of Plvap-deficient mice show a higher number of macrophages in their lumen (white arrows) and focal areas with accumulations of mononuclear cells in Disse's space (black arrows). Lower panels in B show higher magnifications. C, After perfusion of a wild-type animal with FITC-dextran, a strong FITC-signal (green) throughout the liver is detected. Immunolabeling with CD31 (red) suggests that FITC-dextran molecules have accumulated in the space of Disse. In contrast, in the Plvap-deficient littermate, the signal for FITC-dextran is much weaker and barely detectable. Nuclear DNA is labeled with DAPI (blue). Image collected and cropped by CiteAb from the following publication (https://dx.plos.org/10.1371/journal.pone.0115005), licensed under a CC-BY license. Not internally tested by R&D Systems.
Detection of Mouse CD31/PECAM-1 by Immunohistochemistry
Blood-brain barrier permeability measurements in male Ins2AKITA and WT littermate controls. (a) Representative stereomicroscope fluorescence images of brains showing 1 kDa Alexa Fluor 555 cadaverine permeability in Ins2AKITA and WT after 2 h of dye circulation (n = 2). (b) Representative confocal images of coronal sections of 1 kDa Alexa Fluor 555 cadaverine injected mouse brains. ANPEP positive mural cells, green; PECAM1 positive vasculature, white. No Alexa Fluor 555 cadaverine leakage into brain parenchyma was observed either in Ins2AKITA or WT mice (n = 2, scale bar 30 μm). (c) Quantification of 1 kDa Alexa Fluor 555 cadaverine permeability in 26.5–32 week-old Ins2AKITA and WT mice after 2 h circulation (n = > 8, 3 independent experiments). y-axis shows the fold change in relative fluorescence units (RFU) per gram of brain tissue in relation to WT. (d) Quantification of 1 kDa Alexa Fluor 488 cadaverine permeability in 38 week-old Ins2AKITA and WT mice after 2 h circulation (n = 3). y-axis shows the fold change in relative fluorescence units (RFU) per gram of brain tissue in relation to WT. (e) Evans Blue dye permeability in 30 week-old Ins2AKITA and WT littermate control mice after overnight circulation (n = > 2). y-axis shows optical density (OD) at 620 nm per gram of tissue. PdgfbRet/Ret served as positive control for tracer leakage into the brain parenchyma. n.s., not significant, student’s t test. Data is presented as mean ± SEM. Image collected and cropped by CiteAb from the following publication (https://pubmed.ncbi.nlm.nih.gov/30498224), licensed under a CC-BY license. Not internally tested by R&D Systems.
Detection of Mouse CD31/PECAM-1 by Immunocytochemistry/Immunofluorescence
Diminished permeability of liver sinusoids in Plvap-deficient mice.Neither by immunohistochemistry with antibodies against CD31 (A) nor by light microscopy of 1 µm semi-thin sections (B, Richardson's stain) obvious differences are detected with regards to the overall orientation and the density of liver sinusoids between 3-week-old Plvap-/- mice and wild-type littermates. Sinusoids of Plvap-deficient mice show a higher number of macrophages in their lumen (white arrows) and focal areas with accumulations of mononuclear cells in Disse's space (black arrows). Lower panels in B show higher magnifications. C, After perfusion of a wild-type animal with FITC-dextran, a strong FITC-signal (green) throughout the liver is detected. Immunolabeling with CD31 (red) suggests that FITC-dextran molecules have accumulated in the space of Disse. In contrast, in the Plvap-deficient littermate, the signal for FITC-dextran is much weaker and barely detectable. Nuclear DNA is labeled with DAPI (blue). Image collected and cropped by CiteAb from the following publication (https://dx.plos.org/10.1371/journal.pone.0115005), licensed under a CC-BY license. Not internally tested by R&D Systems.
Detection of Mouse CD31/PECAM-1 by Immunocytochemistry/Immunofluorescence
AcSDKP inhibits TGF beta /smad signaling and EndMT and restores the FGFR1 and P-MAP4K4 levels in diabetic hearts. (a) Immunofluorescence microscopy analysis of CD31/FGFR1 and CD31/P-MAP4K4 in the heart tissues from each group of mice. The scale bar is 60 μm in each panel. The CD31 and FGFR1 double-labeled cells and the CD31 and P-MAP4K4 double-labeled cells in each visual field were assessed by fluorescence microscopy and quantified. For each section, images from six different fields of view at × 400 magnification were evaluated. (b and c) Immunofluorescence microscopy analysis of CD31/ alpha -SMA, VE-cadherin /SM22 alpha and CD31/p-smad3 expression levels in the heart tissues from each group of mice. The scale bar is 60 μm in each panel. The CD31 and alpha -SMA double-labeled cells, the VE-cadherin and SM22 alpha double-labeled cells and the CD31 and p-smad3 double-labeled cells in each visual field were analyzed by fluorescence microscopy and quantified. For each section, images from six different fields of view at × 400 magnification were evaluated. Four mice from each group were analyzed. (d) Western blot analysis of the FGFR1, P-MAP4K4, TGF beta 1, TGF beta 2 and TGF beta 3 levels in cardiac tissues. A representative blot from four independent experiments was shown. The densitometric analysis of western blot data was presented (n=4). The diabetic mice are abbreviated as DM in the figure Image collected and cropped by CiteAb from the following publication (https://pubmed.ncbi.nlm.nih.gov/28771231), licensed under a CC-BY license. Not internally tested by R&D Systems.
Detection of Mouse CD31/PECAM-1 by Immunocytochemistry/Immunofluorescence
CL and low temperature lead to WAT browning, angiogenesis, and an increased number of myofibroblast-like cells. a, b Histological analysis of adipocyte morphology (H&E), adipocytes (PERI), mitochondria (COX4), uncoupling protein 1 (UCP1), blood vessels (CD31), and myofibroblast-like cells ( alpha SMA) in a 5-day CL-316243-treated scWAT and visWAT compared to vehicle-treated control. b Two-week 4 °C-treated scWAT and visWAT compared to 30 °C control. Double-headed arrows mark adipocyte diameter. Arrows point to respective positive signals. c–l Quantifications of adipocyte size and positive signals per field of COX4, UCP1, CD31, and alpha SMA of CL-316243- and vehicle-, and 30 °C- and 4 °C- treated scWATs and visWATs (>30 adipocytes per field; n = 10 random fields; n = 5 mice per group). PERI, perilipin; COX4, mitochondrial complex 4; UCP1, uncoupling protein 1. Scale bars, 100 μm. NS, not significant. *P < 0.05, **P < 0.01, and ***P < 0.001 by Student’s t-test. Data presented as mean ± s.e.m. Image collected and cropped by CiteAb from the following publication (https://www.nature.com/articles/s41467-017-02158-z), licensed under a CC-BY license. Not internally tested by R&D Systems.
Detection of CD31/PECAM‑1 in Whole Blood Granulocytes by Flow Cytometry
Whole blood granulocytes were stained with Goat Anti-Human/Mouse/Rat CD31/PECAM‑1 Antigen Affinity-purified Polyclonal Antibody (Catalog # AF3628, filled histogram) or isotype control antibody (Catalog # AB-108-C, open histogram) followed by Phycoerythrin-conjugated Anti-Goat IgG Secondary Antibody (Catalog # F0107). View our protocol for Staining Membrane-associated Proteins.
Detection of Mouse Human/Mouse/Rat CD31/PECAM-1 Antibody by Immunohistochemistry
Neutrophil depletion reduces BBB breakdown and increases neovascularization after stroke. f, g Representative confocal images (f) and quantitative analysis of IgG extravascular deposits (g) in the peri-infarct cortex at 14 days in sham-operated mice and mice treated with control antibody or anti-Ly6G antibody (n = 6). One-way ANOVA test was applied with *P < 0.0001 (Sham vs. Isotype), *P = 0.0041 (Isotype vs. Anti-Ly6G). Bar = 15 μm. Image collected and cropped by CiteAb from the following publication (https://pubmed.ncbi.nlm.nih.gov/32427863), licensed under a CC-BY license. Not internally tested by R&D Systems.
Detection of Mouse Human/Mouse/Rat CD31/PECAM-1 Antibody by Immunohistochemistry
Increased vascular remodeling by delayed inhibition of NET formation.a–d Representative confocal images (a, c) and quantitative analysis of IgG extravascular deposits (b, d) in the peri-infarct cortex at 14 days. Mice were subjected to stroke and treated with either anti-Ly6G antibody, control antibody, DNase 1, or vehicle starting at 7 days (n = 6), unpaired two-tailed Student’s t-test was applied with *P = 0.0392 (b), *P = 0.0384 (d). Bar = 10 μm. e–l Representative confocal images (e, g) of CD31-positive microvessels and in-vivo multiphoton microscopy images of perfused cortical capillaries with intravenously injected FITC-dextran (i, k) in the peri-infarct cortex at 14 days in mice treated with either anti-Ly6G antibody, control antibody, DNase 1, or vehicle. Bar = 40 μm (e, g) and 100 µm (i, k). Quantification of microvascular density (f, h) and perfused capillary length (j, l) for each group (n = 6), unpaired two-tailed Student’s t-test was applied with *P = 0.00378 (f), *P = 0.0364 (h), *P = 0.0026 (j), *P = 0.0006 (l). Data are presented as mean ± SD. Source data underlying graph b, d, f, h, j, and l are provided as a Source Data file. Image collected and cropped by CiteAb from the following publication (https://pubmed.ncbi.nlm.nih.gov/32427863), licensed under a CC-BY license. Not internally tested by R&D Systems.
Detection of Mouse Human/Mouse/Rat CD31/PECAM-1 Antibody by Immunohistochemistry
Neutrophil depletion reduces BBB breakdown and increases neovascularization after stroke. h, j Representative confocal images (h) of CD31-positive microvessels and in-vivo multiphoton microscopy images of perfused cortical capillaries with intravenously injected FITC-dextran (MW = 2000,000 Da) (j) in the peri-infarct cortex at 14 days in mice treated with control antibody or anti-Ly6G antibody, compared with sham-operated mice. Bar = 50 μm (e) and 100 µm (g) Image collected and cropped by CiteAb from the following publication (https://pubmed.ncbi.nlm.nih.gov/32427863), licensed under a CC-BY license. Not internally tested by R&D Systems.
Detection of Mouse Human/Mouse/Rat CD31/PECAM-1 Antibody by Immunohistochemistry
Increased vascular remodeling by delayed inhibition of NET formation.a–d Representative confocal images (a, c) and quantitative analysis of IgG extravascular deposits (b, d) in the peri-infarct cortex at 14 days. Mice were subjected to stroke and treated with either anti-Ly6G antibody, control antibody, DNase 1, or vehicle starting at 7 days (n = 6), unpaired two-tailed Student’s t-test was applied with *P = 0.0392 (b), *P = 0.0384 (d). Bar = 10 μm. e–l Representative confocal images (e, g) of CD31-positive microvessels and in-vivo multiphoton microscopy images of perfused cortical capillaries with intravenously injected FITC-dextran (i, k) in the peri-infarct cortex at 14 days in mice treated with either anti-Ly6G antibody, control antibody, DNase 1, or vehicle. Bar = 40 μm (e, g) and 100 µm (i, k). Quantification of microvascular density (f, h) and perfused capillary length (j, l) for each group (n = 6), unpaired two-tailed Student’s t-test was applied with *P = 0.00378 (f), *P = 0.0364 (h), *P = 0.0026 (j), *P = 0.0006 (l). Data are presented as mean ± SD. Source data underlying graph b, d, f, h, j, and l are provided as a Source Data file. Image collected and cropped by CiteAb from the following publication (https://pubmed.ncbi.nlm.nih.gov/32427863), licensed under a CC-BY license. Not internally tested by R&D Systems.
Detection of Mouse Human/Mouse/Rat CD31/PECAM-1 Antibody by Immunohistochemistry
Neutrophils accumulate in the brain during all stages of ischemic stroke. f Representative confocal images of Ly6G-labeled neutrophils (green) and CD31-positive microvessels (white) in the peri-infarct cortex of mice at 3 days. Nuclei were visualized with Hoechst. Neutrophils were observed within brain vessels and migrated into the parenchyma. Bar = 40 μm. Independent experiments are repeated at least three times. Image collected and cropped by CiteAb from the following publication (https://pubmed.ncbi.nlm.nih.gov/32427863), licensed under a CC-BY license. Not internally tested by R&D Systems.
Detection of Mouse Human/Mouse/Rat CD31/PECAM-1 Antibody by Immunohistochemistry
Diminished permeability of liver sinusoids in Plvap-deficient mice.Neither by immunohistochemistry with antibodies against CD31 (A) nor by light microscopy of 1 µm semi-thin sections (B, Richardson's stain) obvious differences are detected with regards to the overall orientation and the density of liver sinusoids between 3-week-old Plvap-/- mice and wild-type littermates. Sinusoids of Plvap-deficient mice show a higher number of macrophages in their lumen (white arrows) and focal areas with accumulations of mononuclear cells in Disse's space (black arrows). Lower panels in B show higher magnifications. C, After perfusion of a wild-type animal with FITC-dextran, a strong FITC-signal (green) throughout the liver is detected. Immunolabeling with CD31 (red) suggests that FITC-dextran molecules have accumulated in the space of Disse. In contrast, in the Plvap-deficient littermate, the signal for FITC-dextran is much weaker and barely detectable. Nuclear DNA is labeled with DAPI (blue). Image collected and cropped by CiteAb from the following publication (https://pubmed.ncbi.nlm.nih.gov/25541982), licensed under a CC-BY license. Not internally tested by R&D Systems.
Detection of Mouse Human/Mouse/Rat CD31/PECAM-1 Antibody by Immunohistochemistry
Increased vascular remodeling by delayed inhibition of NET formation.a–d Representative confocal images (a, c) and quantitative analysis of IgG extravascular deposits (b, d) in the peri-infarct cortex at 14 days. Mice were subjected to stroke and treated with either anti-Ly6G antibody, control antibody, DNase 1, or vehicle starting at 7 days (n = 6), unpaired two-tailed Student’s t-test was applied with *P = 0.0392 (b), *P = 0.0384 (d). Bar = 10 μm. e–l Representative confocal images (e, g) of CD31-positive microvessels and in-vivo multiphoton microscopy images of perfused cortical capillaries with intravenously injected FITC-dextran (i, k) in the peri-infarct cortex at 14 days in mice treated with either anti-Ly6G antibody, control antibody, DNase 1, or vehicle. Bar = 40 μm (e, g) and 100 µm (i, k). Quantification of microvascular density (f, h) and perfused capillary length (j, l) for each group (n = 6), unpaired two-tailed Student’s t-test was applied with *P = 0.00378 (f), *P = 0.0364 (h), *P = 0.0026 (j), *P = 0.0006 (l). Data are presented as mean ± SD. Source data underlying graph b, d, f, h, j, and l are provided as a Source Data file. Image collected and cropped by CiteAb from the following publication (https://pubmed.ncbi.nlm.nih.gov/32427863), licensed under a CC-BY license. Not internally tested by R&D Systems.
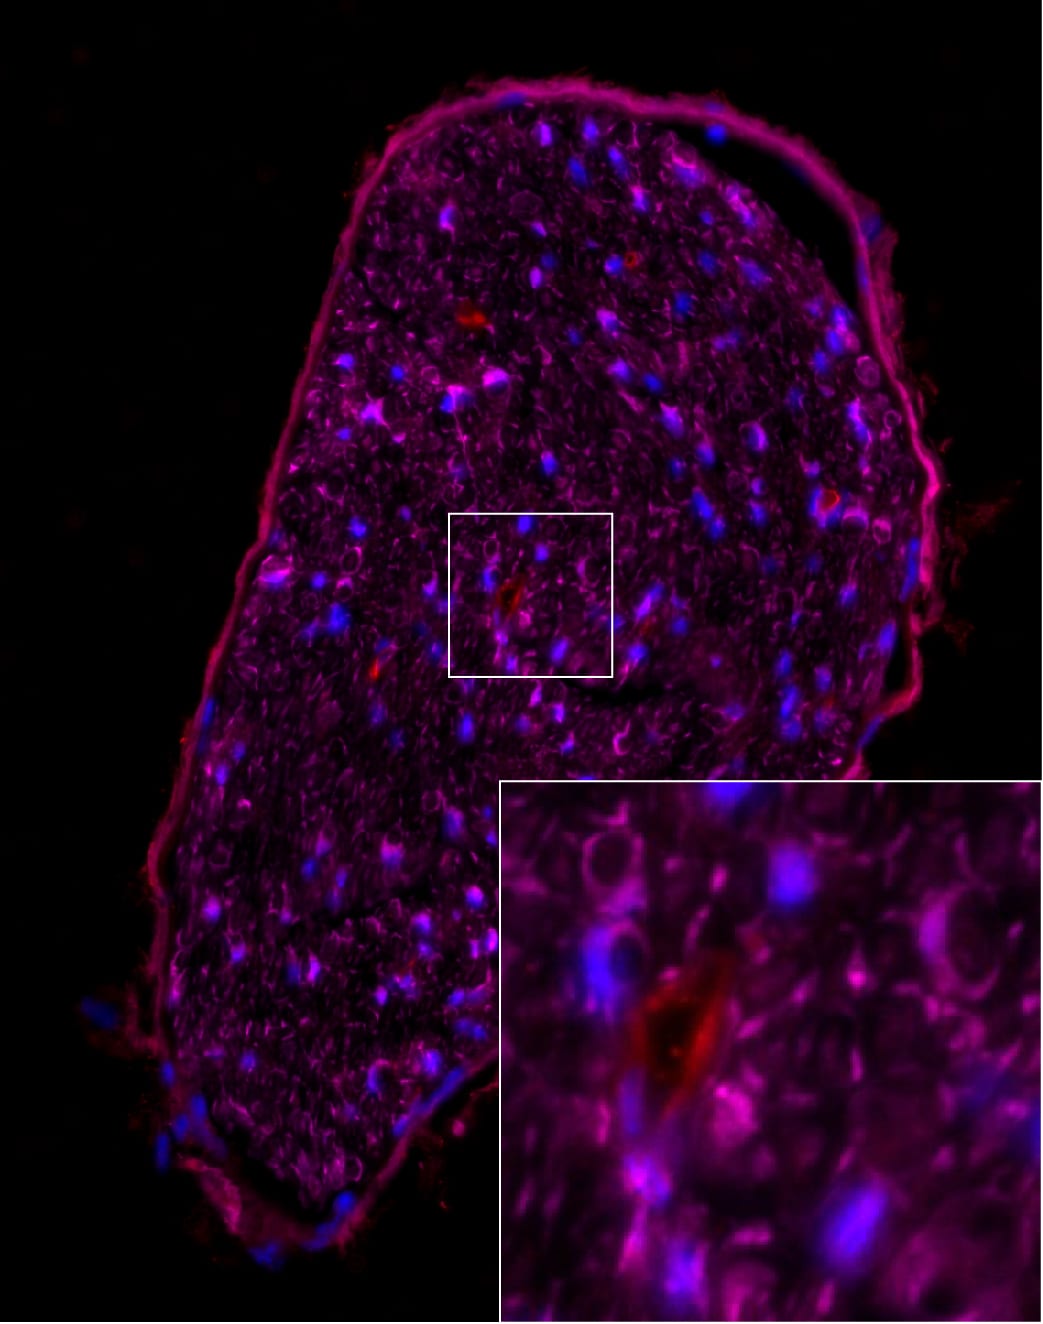
Detection of Mouse CD31/PECAM-1 by Immunohistochemistry
Microvascular and tumor cell biology at the tumor rim in MDA231Br-GFP brain metastases. Representative histologic sections of rat brains, intrastriatally injected with MDA231Br-GFP tumor cells, from the tumor core, tumor rim, and the contralateral striatum, with corresponding box and whisker plots of marker expression in each region. Data shown as median ± interquartile range. Sections were immunohistochemically stained (brown) for tumor cell marker vimentin (A), endothelial marker CD31 (B), cell adhesion molecule VCAM-1 (C), cell proliferation marker Ki67 (D), and two stemness markers: SOX2 (E) and nestin (F). Scale bar = 100 μm. *, P < 0.05; ***, P < 0.001; n = 8; post hoc Bonferroni multiple comparison test for tumor cell density and microvessel density, and post hoc Dunn test for VCAM-1 expression. Tumor core was delineated from the infiltrative border as indicated by the blue and red lines, respectively. Expression of Ki67, nestin and SOX2 has been normalized to tumor area. *, P < 0.05; ***, P < 0.001; matched Wilcoxon test. Image collected and cropped by CiteAb from the following open publication (https://pubmed.ncbi.nlm.nih.gov/35312755), licensed under a CC-BY license. Not internally tested by R&D Systems.
Detection of Human CD31/PECAM-1 by Immunohistochemistry
Microvascular and tumor cell biology at the tumor rim in U87MG glioblastoma. Representative histologic sections of rat brains, intrastriatally injected with U87MG tumor cells, from the tumor core, tumor rim, and the contralateral striatum, with corresponding box and whisker plots of marker expression in each region. Data shown as median ± interquartile range. Sections were immunohistochemically stained (brown) for tumor cell marker vimentin (A), endothelial marker CD31 (B), cell adhesion molecule VCAM-1 (C), cell proliferation marker Ki67 (D), and two stemness markers: SOX2 (E) and nestin (F). Scale bar = 100 μm. *, P < 0.05; **, P < 0.01; ***, P < 0.001; n = 5; post hoc Bonferroni multiple comparison test for tumor cell density and microvessel density, and post hoc Dunn test for VCAM-1 expression. Tumor core was delineated from the infiltrative border as indicated by the blue and red lines, respectively. Expression of Ki67, nestin, and SOX2 has been normalized to tumor area. **, P < 0.01; matched Wilcoxon test. Image collected and cropped by CiteAb from the following open publication (https://pubmed.ncbi.nlm.nih.gov/35312755), licensed under a CC-BY license. Not internally tested by R&D Systems.
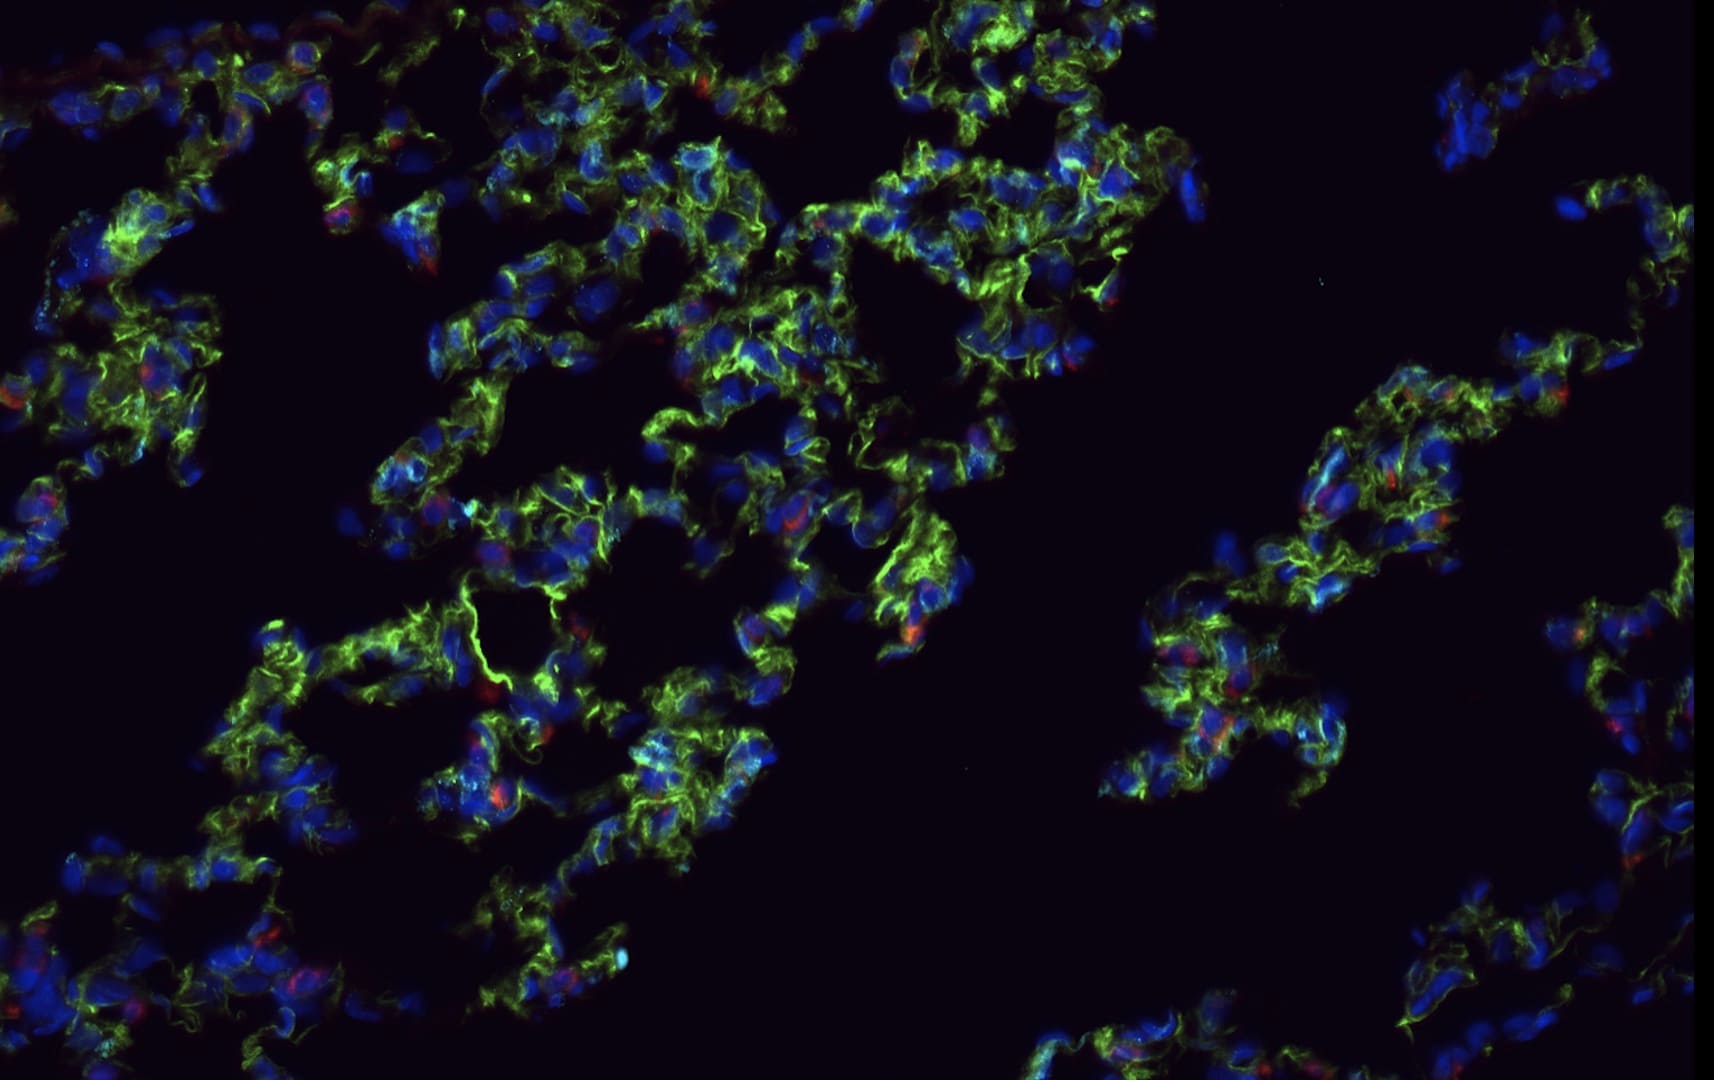
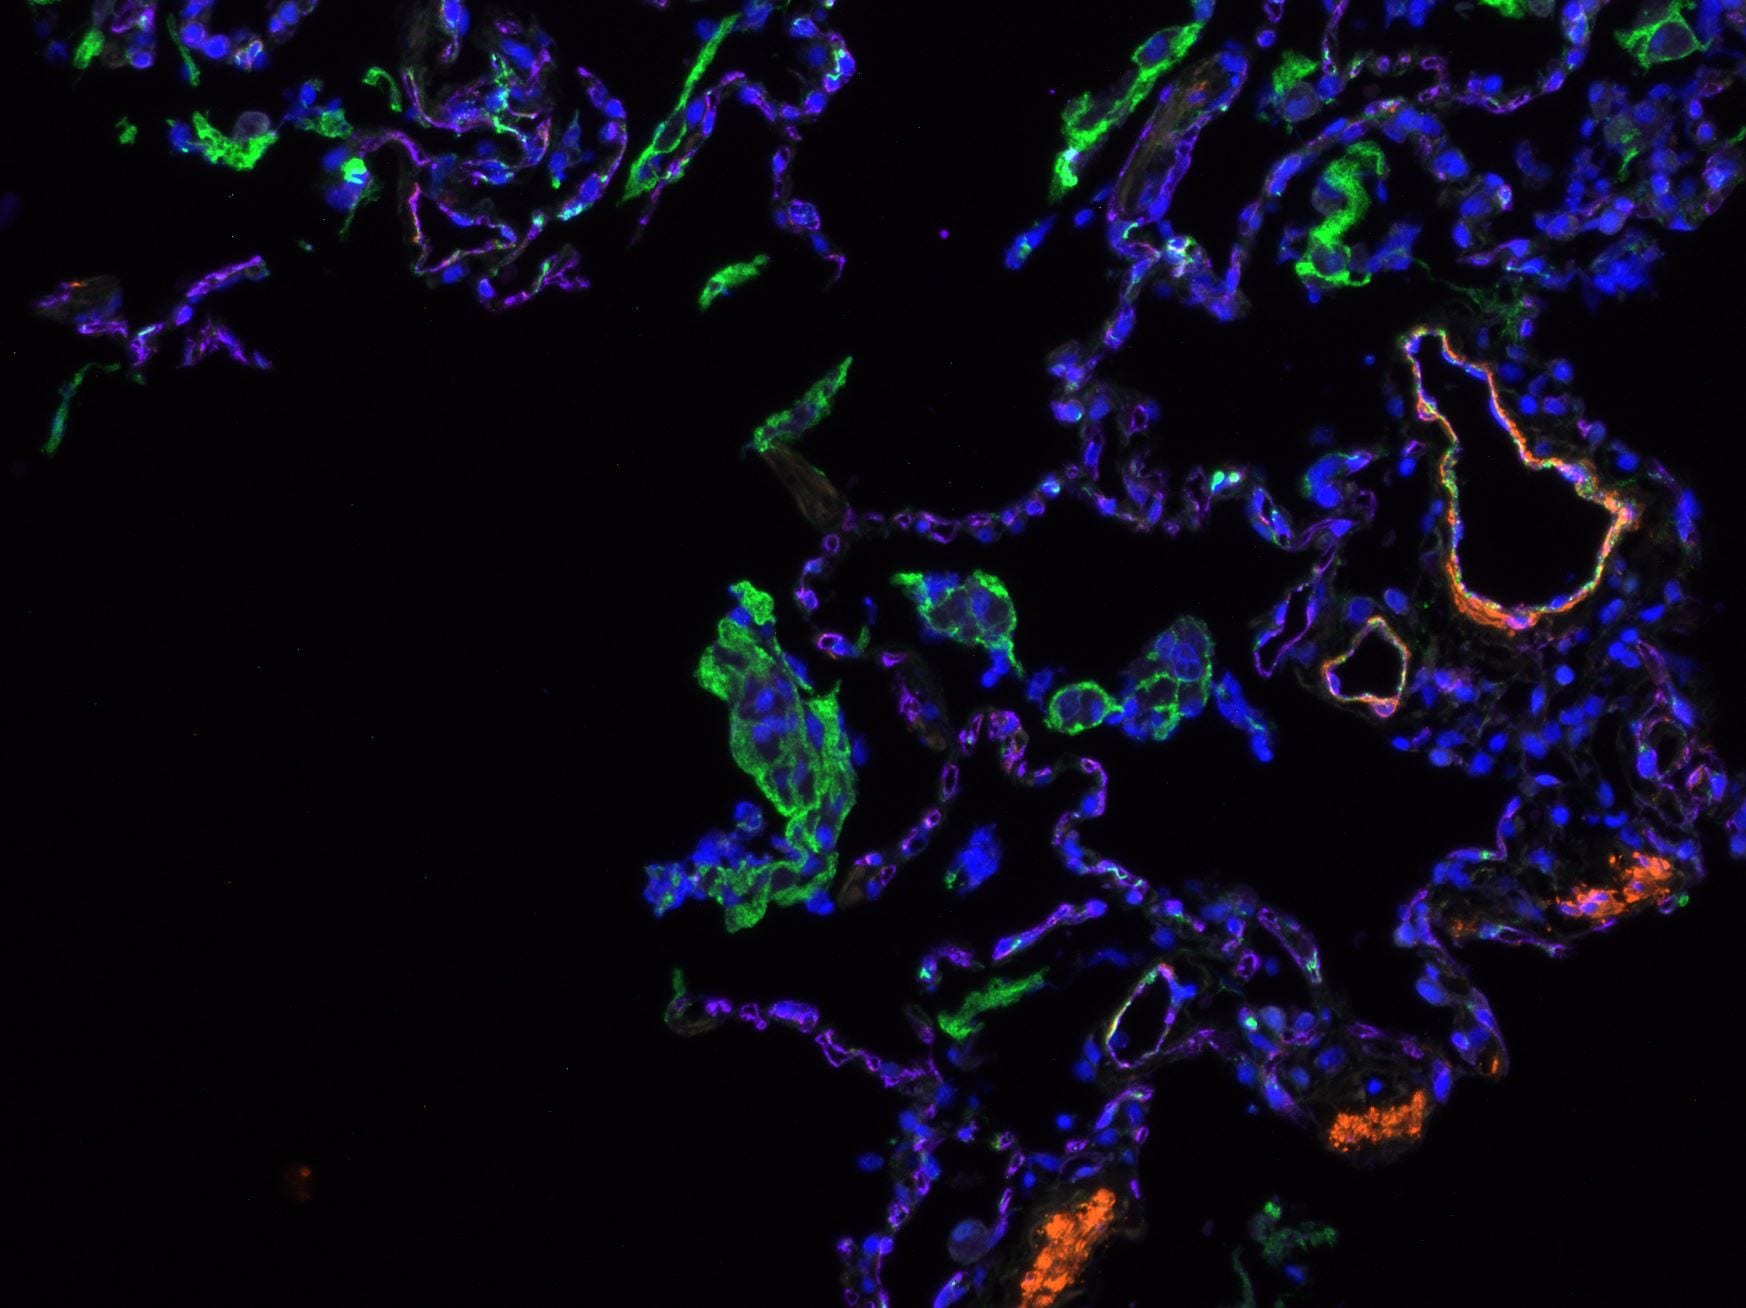
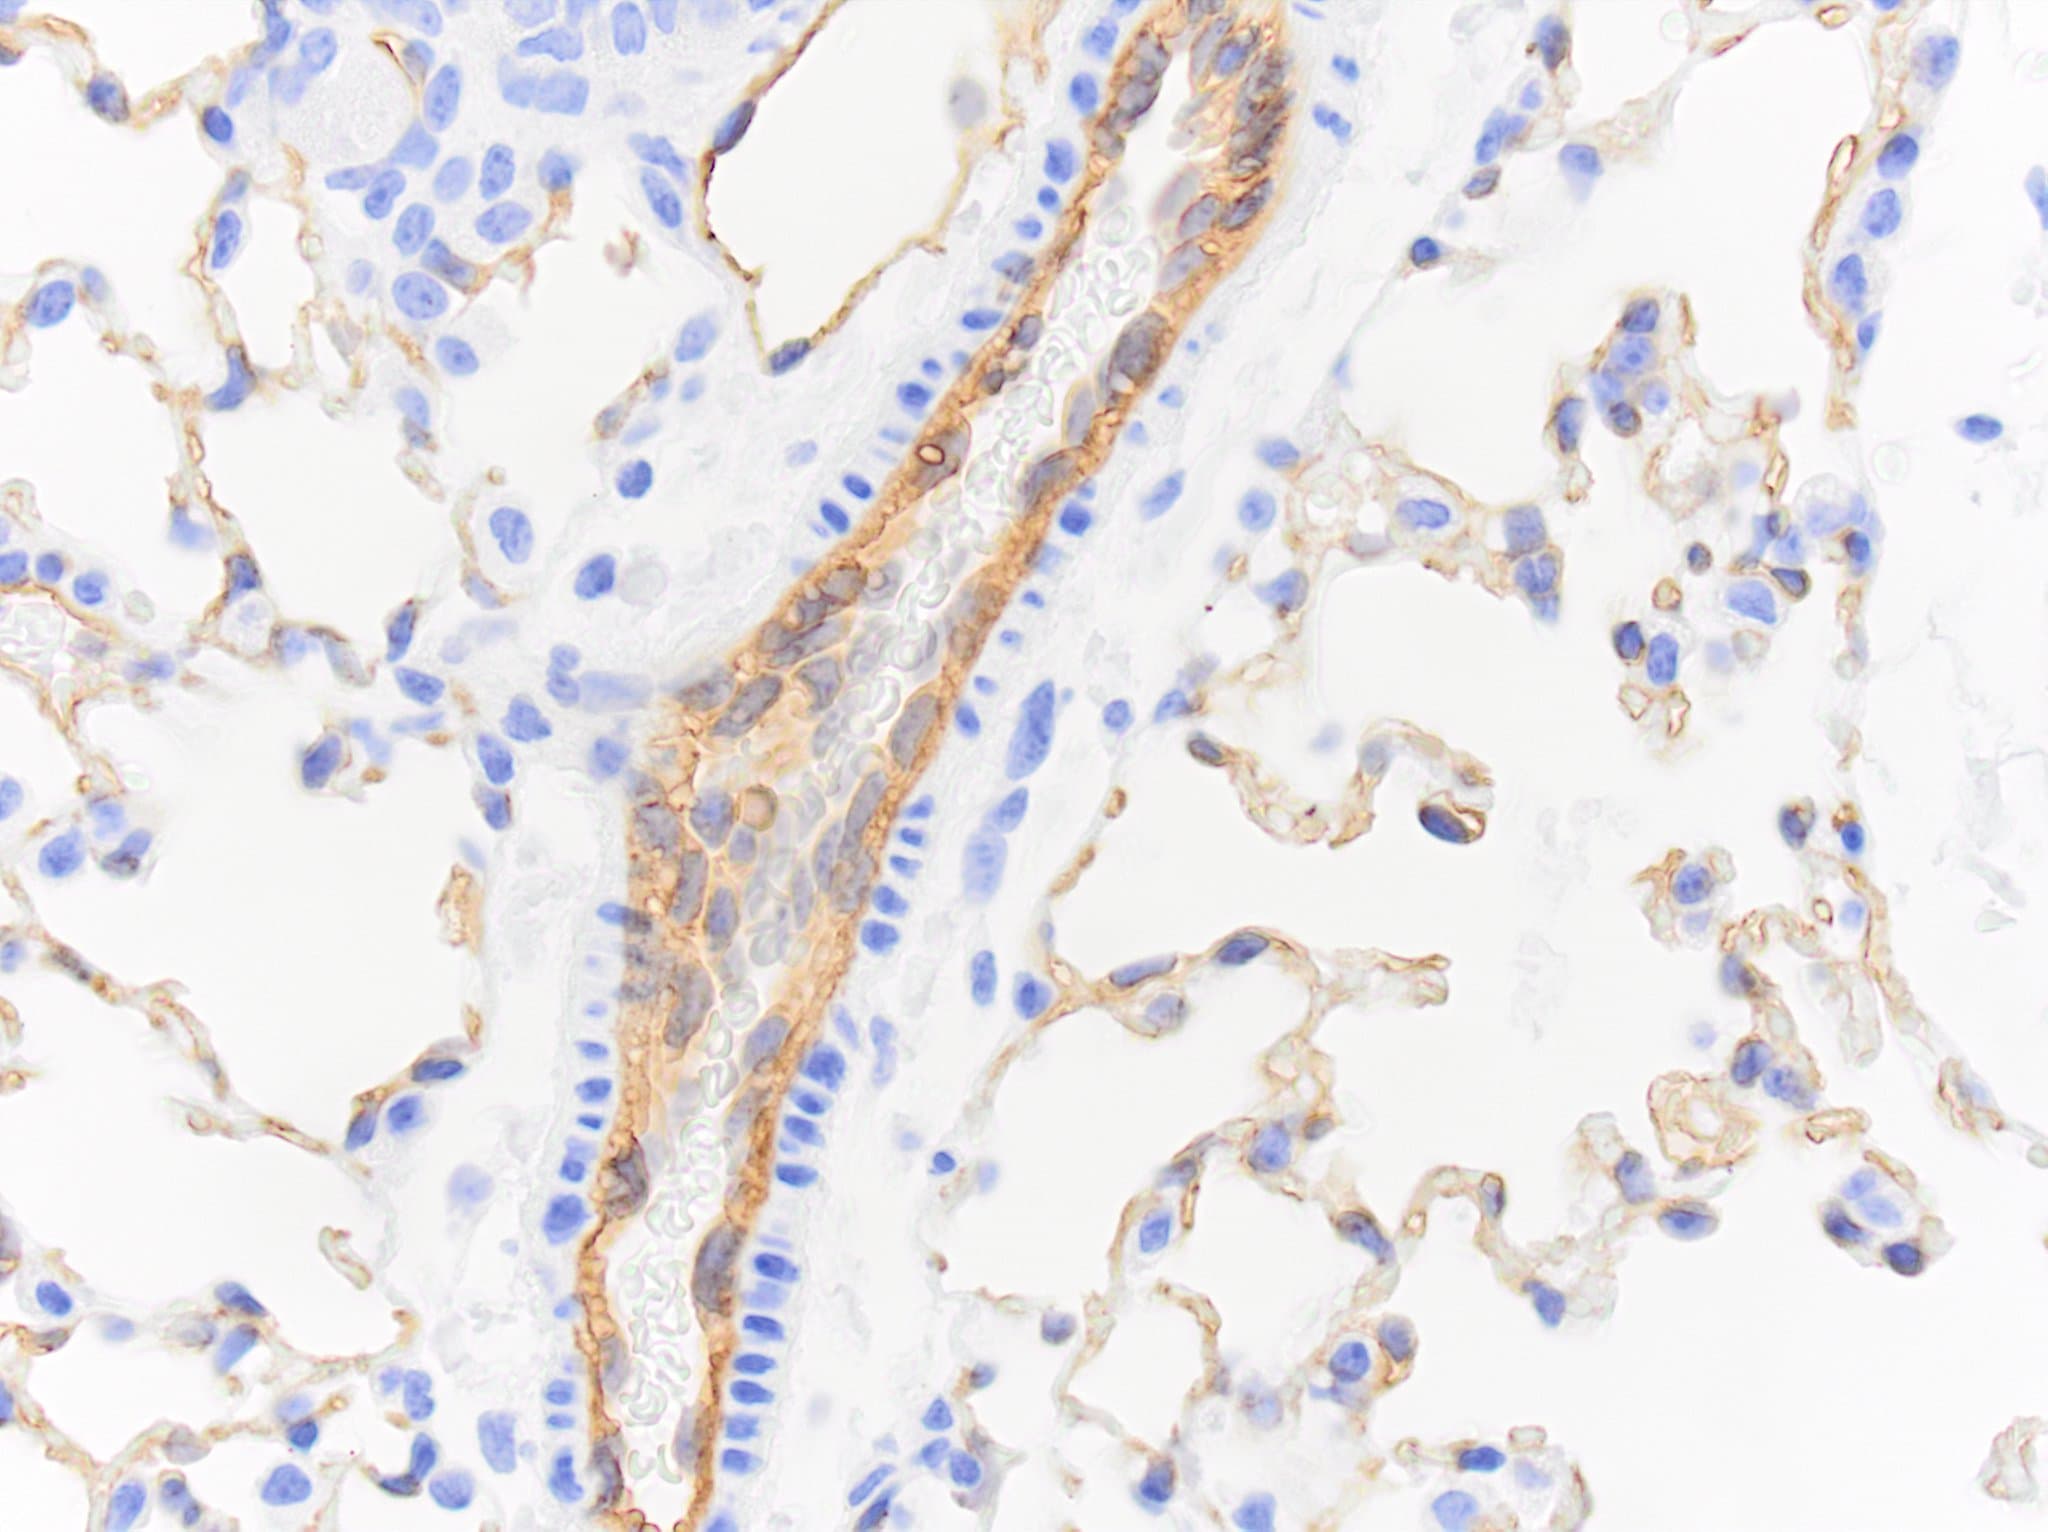
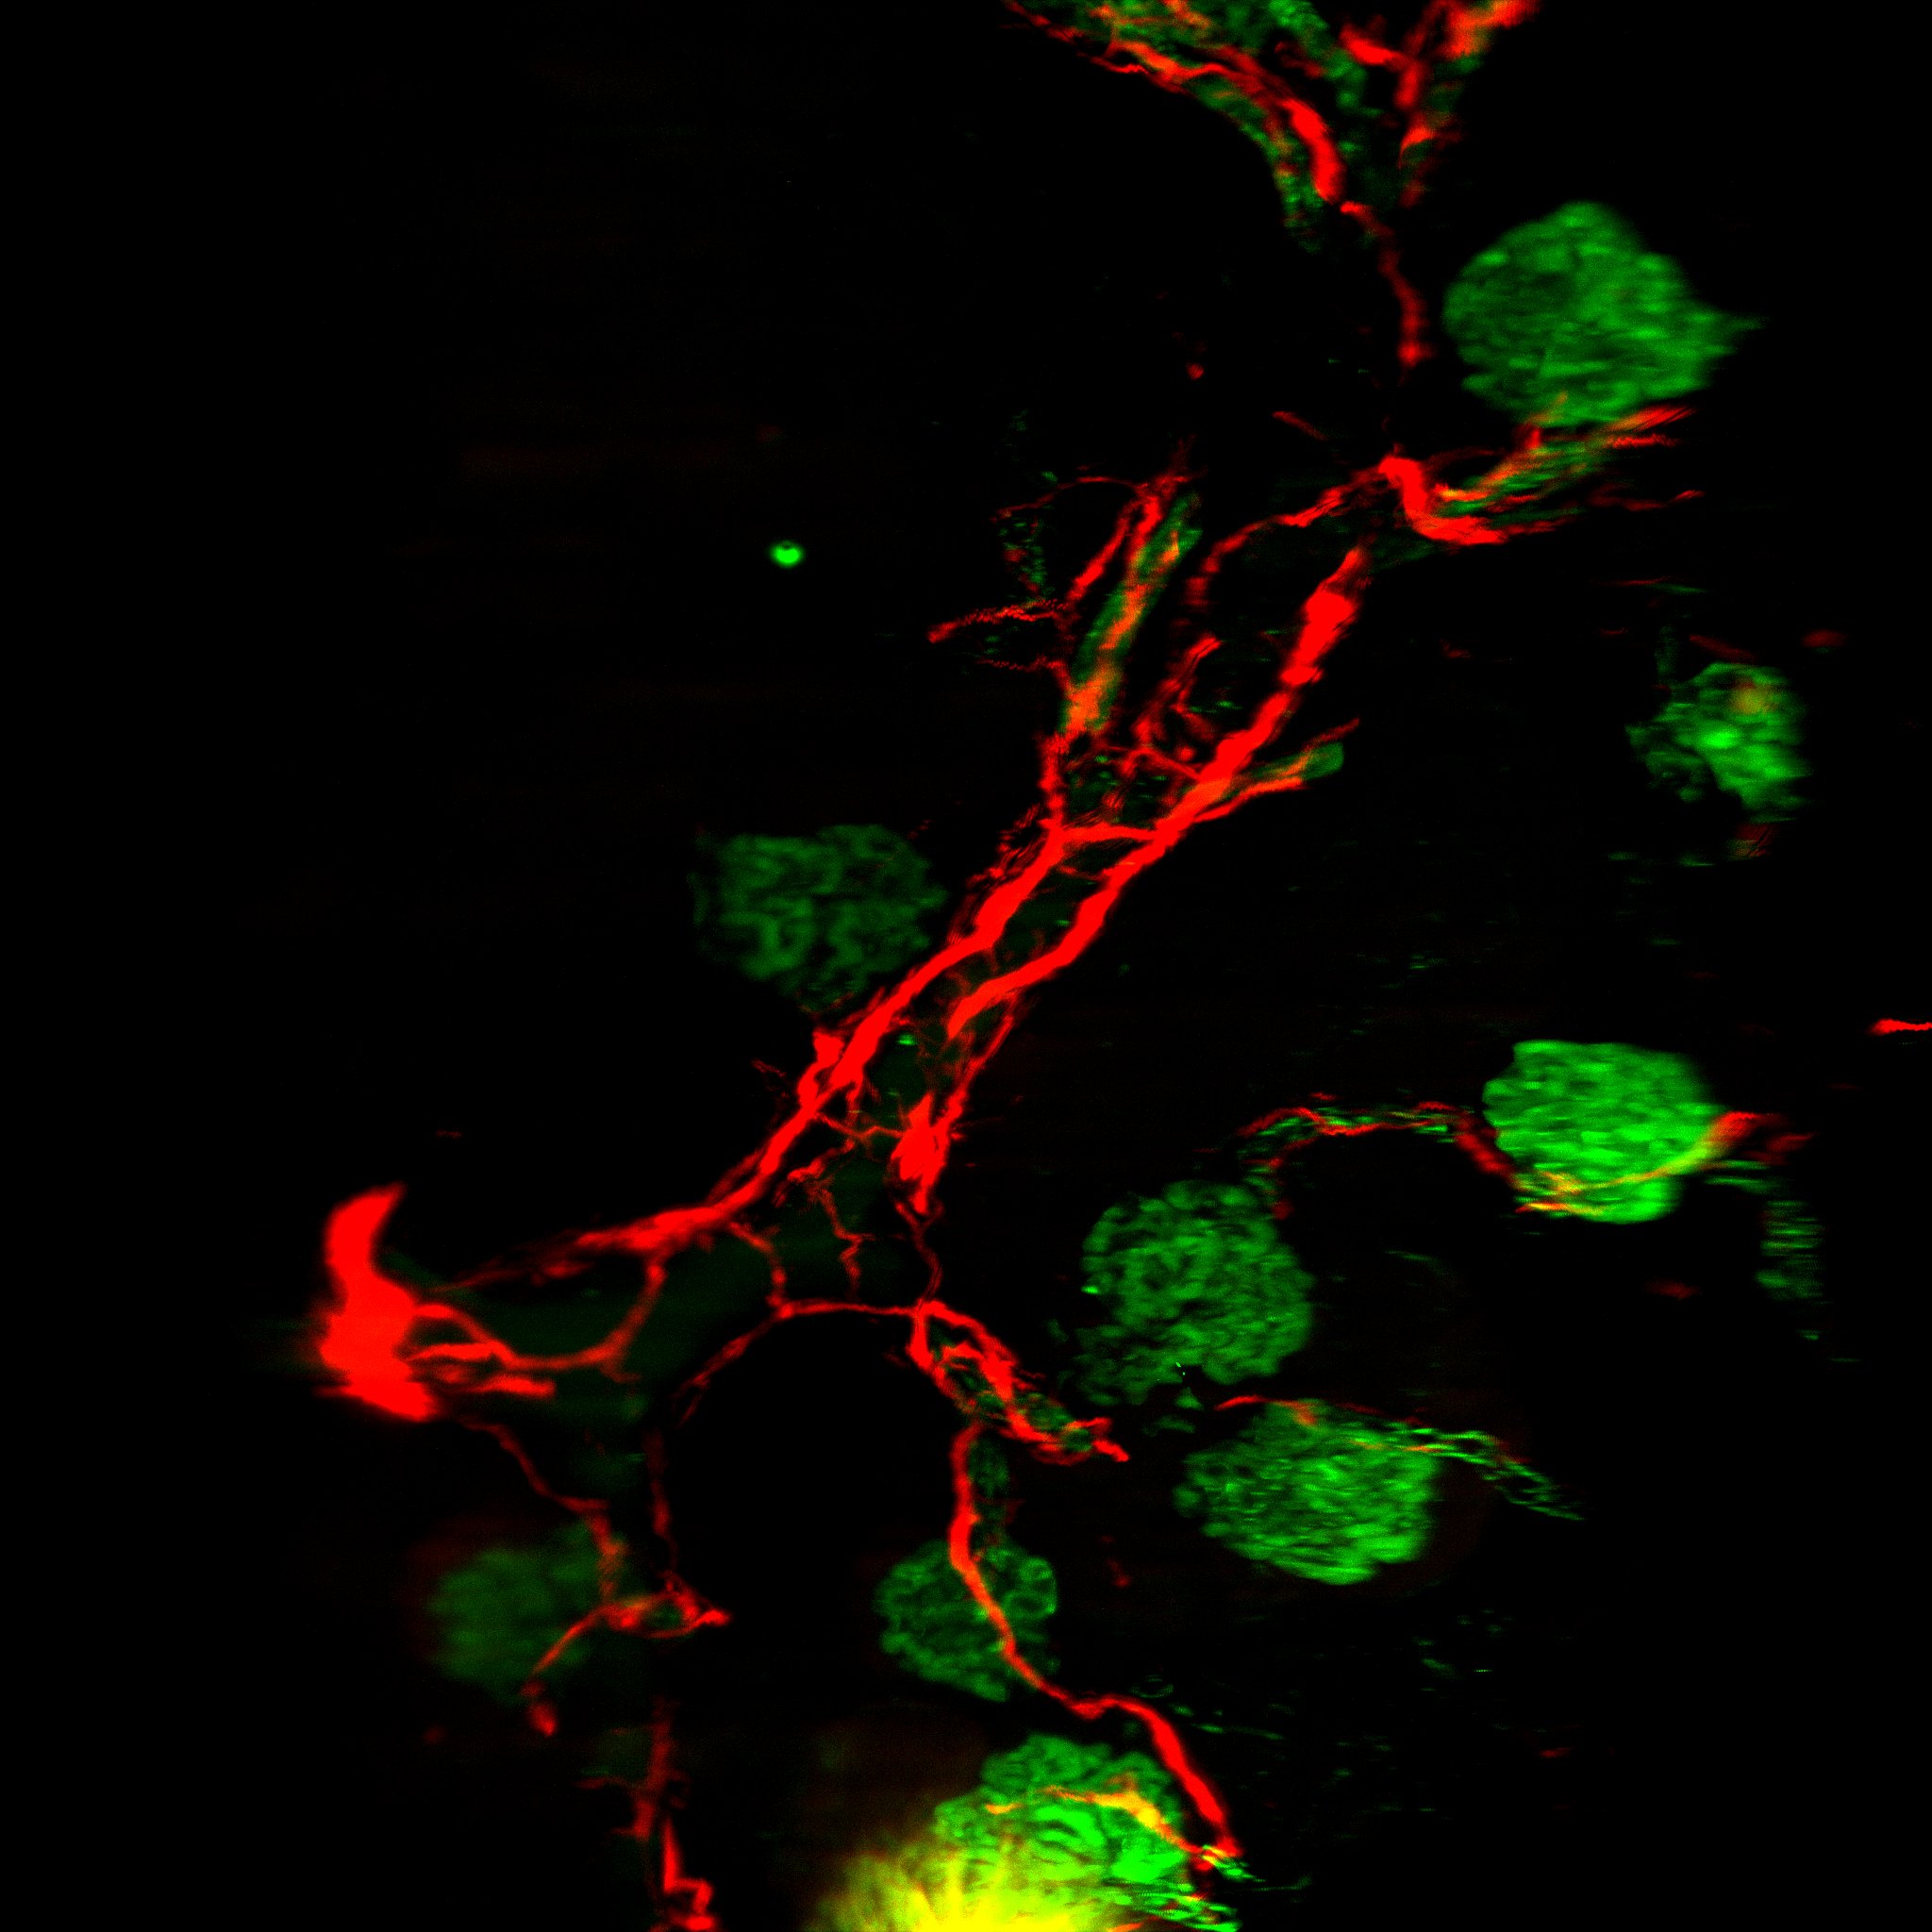
CD31/PECAM‑1 in Lung Tissue.
Immunohistochemistry (paraffin-embedded) of Native Adult Rat lung tissue stained for Abca3 (red), CD31/PECAM-1 (green), and Dclk1 (cyan). Image from a verified customer review.
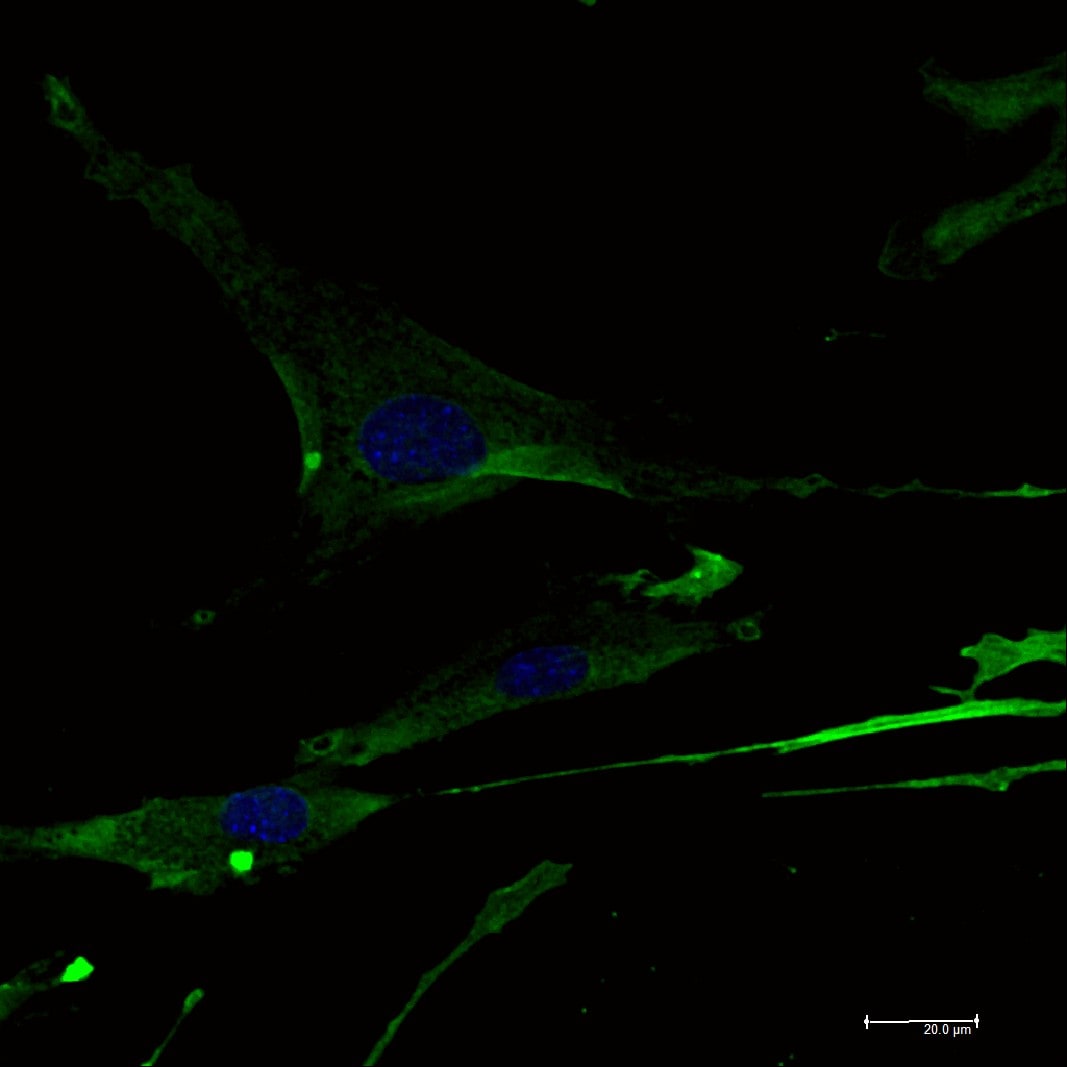
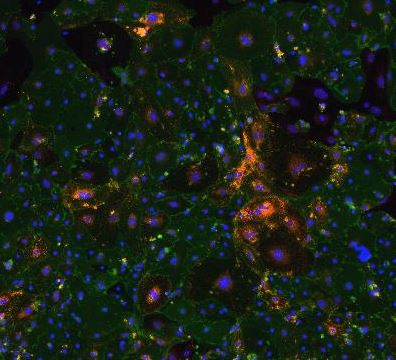
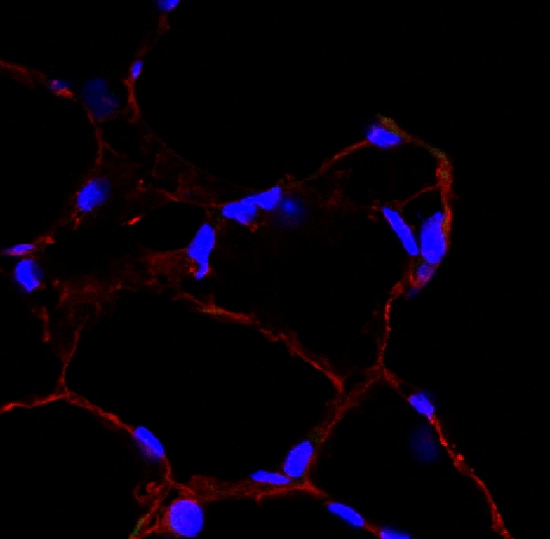
Detection of Mouse CD31/PECAM-1 by Immunocytochemistry/Immunofluorescence.
IF staining of human lung endothelial cells with cd31/pecam1. Image from a verified customer review.
Detection of CD31/PECAM-1 by Immunohistochemistry
Immunostaining analysis of angiogenic markers. (a) Immunohistochemistry (IHC) staining and semi‐quantitative analysis of CD31 in regenerated Achilles tendon of control, suture repair (SR), sodium alginate (SA), and bioactive glass (BG)/SA groups on Days 3, 7, 14, and 28 post‐surgery. Scale bar = 100 μm. T, tendon tissue; G, granulation tissue. Black arrows denote positive signals. Results of statistical analysis are presented as means ± SD; (n = 3; *p < 0.05). (b) Immunofluorescence (IF) staining of CD31 and alpha ‐SMA in regenerated Achilles tendon of SR, SA, and BG/SA groups on Days 7, 14, and 28 post‐surgery. Scale bar = 50 μm; Scale bar (zoom) = 20 μm Image collected and cropped by CiteAb from the following open publication (https://pubmed.ncbi.nlm.nih.gov/36684098), licensed under a CC-BY license. Not internally tested by R&D Systems.
Detection of CD31/PECAM-1 by Immunohistochemistry
FGF-2 expression in NPC correlates with tumor vasculature.A Transcriptomic expression levels of angiogenic factors, including VEGFA, FGF2, PDGFB, EGF, ANGPT1, EPO in human KIRC tissues, COAD tissues, NPC tissues, STAD tissues, PAAD tissues, LUAD tissues, BRCA tissues, SKCM tissues, and their adjacent healthy tissues. The red line indicates the highest expression of FGF2 in AAD-resistant NPC and the lowest expression of FGF in AAD-sensitive CRC. B Transcriptomic expression levels of FGF2 in NPC tissues, COAD tissues, and their adjacent healthy tissues (sample number: control-NPC/NPC/control-COAD/COAD = 10/31/41/290). Data were extracted from datasets GSE12452 and TCGA. C Human rhinitis tissues and NPC tissues were collected and detected for histology (H&E), FGF-2, and CD31 expression levels. Scale bar in upper panel = 500 μm, scale bar in lower three panels = 50 μm. Quantification of FGF-2+ or CD31+ signals (n = 8 random fields per group). D QPCR quantification of FGF2 and CD31 expression in freshly collected rhinitis tissues and NPC tissues (rhinitis tissue, n = 5 samples; NPC tissue, n = 6 samples). E Correlation of FGF2 and CD31 transcriptomic expression levels of human NPCs and control rhinitis tissues (Rhinitis tissue, n = 5 samples; NPC tissue, n = 6 samples). *P < 0.05; ***P < 0.001. NS not significant. Data presented as mean ± SD. KIRC kidney renal clear cell carcinoma, COAD colon adenocarcinoma, STAD stomach adenocarcinoma, PAAD pancreatic adenocarcinoma, LUAD lung adenocarcinoma, BRCA breast invasive carcinoma, SKCM skin cutaneous melanoma. Image collected and cropped by CiteAb from the following open publication (https://pubmed.ncbi.nlm.nih.gov/35985991), licensed under a CC-BY license. Not internally tested by R&D Systems.
Detection of CD31/PECAM-1 by Immunohistochemistry
Immunostaining analysis of angiogenic markers. (a) Immunohistochemistry (IHC) staining and semi‐quantitative analysis of CD31 in regenerated Achilles tendon of control, suture repair (SR), sodium alginate (SA), and bioactive glass (BG)/SA groups on Days 3, 7, 14, and 28 post‐surgery. Scale bar = 100 μm. T, tendon tissue; G, granulation tissue. Black arrows denote positive signals. Results of statistical analysis are presented as means ± SD; (n = 3; *p < 0.05). (b) Immunofluorescence (IF) staining of CD31 and alpha ‐SMA in regenerated Achilles tendon of SR, SA, and BG/SA groups on Days 7, 14, and 28 post‐surgery. Scale bar = 50 μm; Scale bar (zoom) = 20 μm Image collected and cropped by CiteAb from the following open publication (https://pubmed.ncbi.nlm.nih.gov/36684098), licensed under a CC-BY license. Not internally tested by R&D Systems.
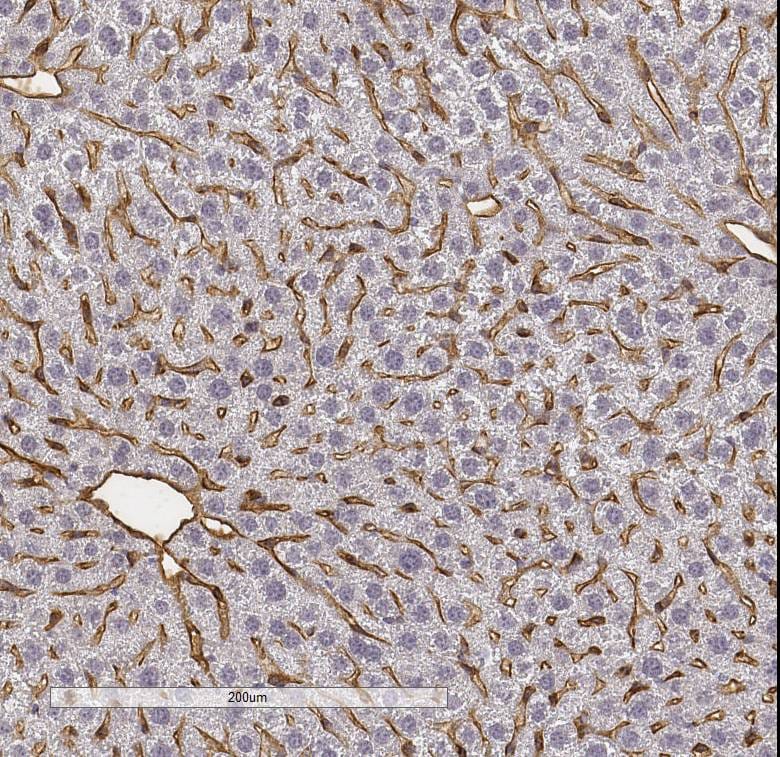
Detection of CD31/PECAM-1 by Immunohistochemistry
Increase in renal fibrosis in aging kidneys of Atg7flox/flox;Tie2-Cre+ mice. (A) Representative immunoblots and densitometry for the expression of Atg7. (B) Relative protein level of Atg7 (%). (C) Representative images of H&E staining from wild-type and Atg7flox/flox;Tie2-Cre+ mice. Scale bars, 100 μm. (D) Quantification of glomeruli diameters (µm). (E) Representative 3,3′-diaminobenzidine (DAB) staining for CD31. Scale bars, 50 μm. (F) Quantification of capillary lumen diameters (µm). (G) Representative immunoblots and densitometry for the expression of CD31. (H) Relative protein levels of CD31 (%). (I) Masson’s trichrome staining from wild-type and Atg7flox/flox;Tie2-Cre mice, showing the cortex and medulla with increased extracellular matrix deposition in the aging Atg7flox/flox;Tie2-Cre+ mouse. (J) Quantification of tubulointerstitial fibrosis (%). (K) Representative DAB staining for TGF-beta. (L) Quantification of TGF-beta positive areas (%). (M) Representative immunoblots and densitometry for expression of TGF-beta. (N) Relative protein level of TGF-beta (%). (O) Representative DAB staining for alpha -SMA. (P) Quantification of alpha -SMA-positive areas (%). (Q) Representative immunoblots and densitometry for expression of alpha -SMA. (R) Relative protein levels of alpha -SMA (%). Scale bars, 50 μm for cortex and 100 μm for medulla. Values are means ± SEM. *, p < 0.05; **, p < 0.01; ***, p < 0.001; ****, p < 0.0001, ns: not significant. Image collected and cropped by CiteAb from the following open publication (https://www.mdpi.com/2076-3921/13/8/886), licensed under a CC-BY license. Not internally tested by R&D Systems.Applications for CD31/PECAM-1 Antibody
CyTOF-ready
Flow Cytometry
Sample: Mouse and rat splenocytes, HUVEC cells, human whole blood granulocytes
Immunocytochemistry
Sample: Immersion fixed bEnd.3 mouse endothelioma cell line
Immunohistochemistry
Sample: Immersion fixed frozen sections of mouse embryo (13.5 d.p.c. and 14 d.p.c.), rat heart and immersion fixed paraffin-embedded sections of Human Placenta
Simple Western
Sample: bEnd.3 mouse endothelioma cell line
Western Blot
Sample: U937 human histiocytic lymphoma cell line and bEnd.3 mouse endothelioma cell line
Reviewed Applications
Read 31 reviews rated 4.9 using AF3628 in the following applications:
- CLARITY deep tissue imaging (1 Review)
- Immunocytochemistry (2 Reviews)
- Immunocytochemistry/Immunofluorescence (11 Reviews)
- Immunofluorescence (1 Review)
- Immunohistochemistry (8 Reviews)
- Immunohistochemistry (paraffin-embedded) of Native Adult Rat lung tissue stained for Abca3 (red), CD31/PECAM-1 (green), and Dclk1 (cyan). (1 Review)
- Immunohistochemistry-Frozen (4 Reviews)
- Immunohistochemistry-Paraffin (1 Review)
- Simple Western (1 Review)
- Staining (1 Review)
Flow Cytometry Panel Builder
Bio-Techne Knows Flow Cytometry
Save time and reduce costly mistakes by quickly finding compatible reagents using the Panel Builder Tool.
Advanced Features
- Spectra Viewer - Custom analysis of spectra from multiple fluorochromes
- Spillover Popups - Visualize the spectra of individual fluorochromes
- Antigen Density Selector - Match fluorochrome brightness with antigen density

Formulation, Preparation, and Storage
Purification
Reconstitution
Reconstitute at 0.2 mg/mL in sterile PBS. For liquid material, refer to CoA for concentration.
Formulation
*Small pack size (-SP) is supplied either lyophilized or as a 0.2 µm filtered solution in PBS.
Shipping
Stability & Storage
- 12 months from date of receipt, -20 to -70 °C as supplied.
- 1 month, 2 to 8 °C under sterile conditions after reconstitution.
- 6 months, -20 to -70 °C under sterile conditions after reconstitution.
Calculators
Background: CD31/PECAM-1
References
- Ilan, N. and J.A. Madri (2003) Curr. Opin. Cell Biol. 15:515.
- Xie, Y. and W.A. Muller (1993) Proc. Natl. Acad. Sci. USA 90:5569.
- Liao, F. et al. (1997) J. Exp. Med. 185:1349.
- Nakada, M.T. et al. (2000) J. Immunol. 164:452.
- Chemnitz, J.M. et al. (2004) J. Immunol. 173:945.
- Ilan, N. et al. (2001) FASEB J. 15:362.
- Eugenin, E.A. et al. (2006) J. Leukoc. Biol. 79:444.
- Losy, J. et al. (1999) J. Neuroimmunol. 99:169.
- Wang, Y. et al. (2003) Am. J. Physiol. Heart Circ. Physiol. 284:H1008.
- Mamdouh, Z. et al. (2003) Nature 421:748.
- Gao, C. et al. (2003) Blood 102:169.
- Falati, S. et al. (2006) Blood 107:535.
- Wee, J.L. and D.E. Jackson (2005) Blood 106:3816.
- Wu, Y. et al. (2005) J. Immunol. 175:3484.
Long Name
Alternate Names
Gene Symbol
UniProt
Additional CD31/PECAM-1 Products
Product Documents for CD31/PECAM-1 Antibody
Certificate of Analysis
To download a Certificate of Analysis, please enter a lot or batch number in the search box below.
Note: Certificate of Analysis not available for kit components.
Product Specific Notices for CD31/PECAM-1 Antibody
For research use only
Related Research Areas
Citations for CD31/PECAM-1 Antibody
 Powered by Bioz
Customer Reviews for CD31/PECAM-1 Antibody (31)
Have you used CD31/PECAM-1 Antibody?
Submit a review and receive an Amazon gift card!
$25/€18/£15/$25CAN/¥2500 Yen for a review with an image
$10/€7/£6/$10CAN/¥1110 Yen for a review without an image
Submit a review
Customer Images
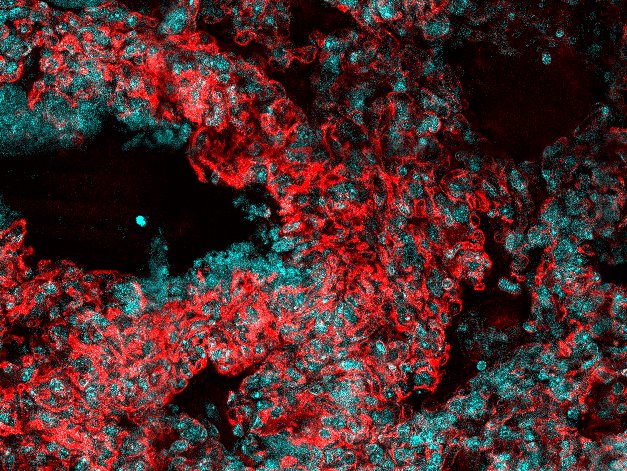
-
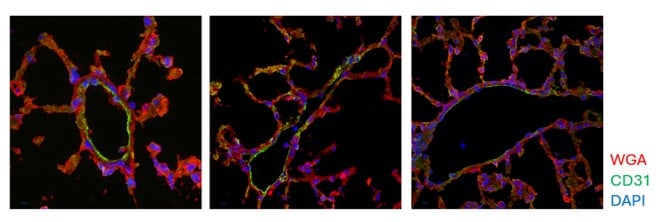
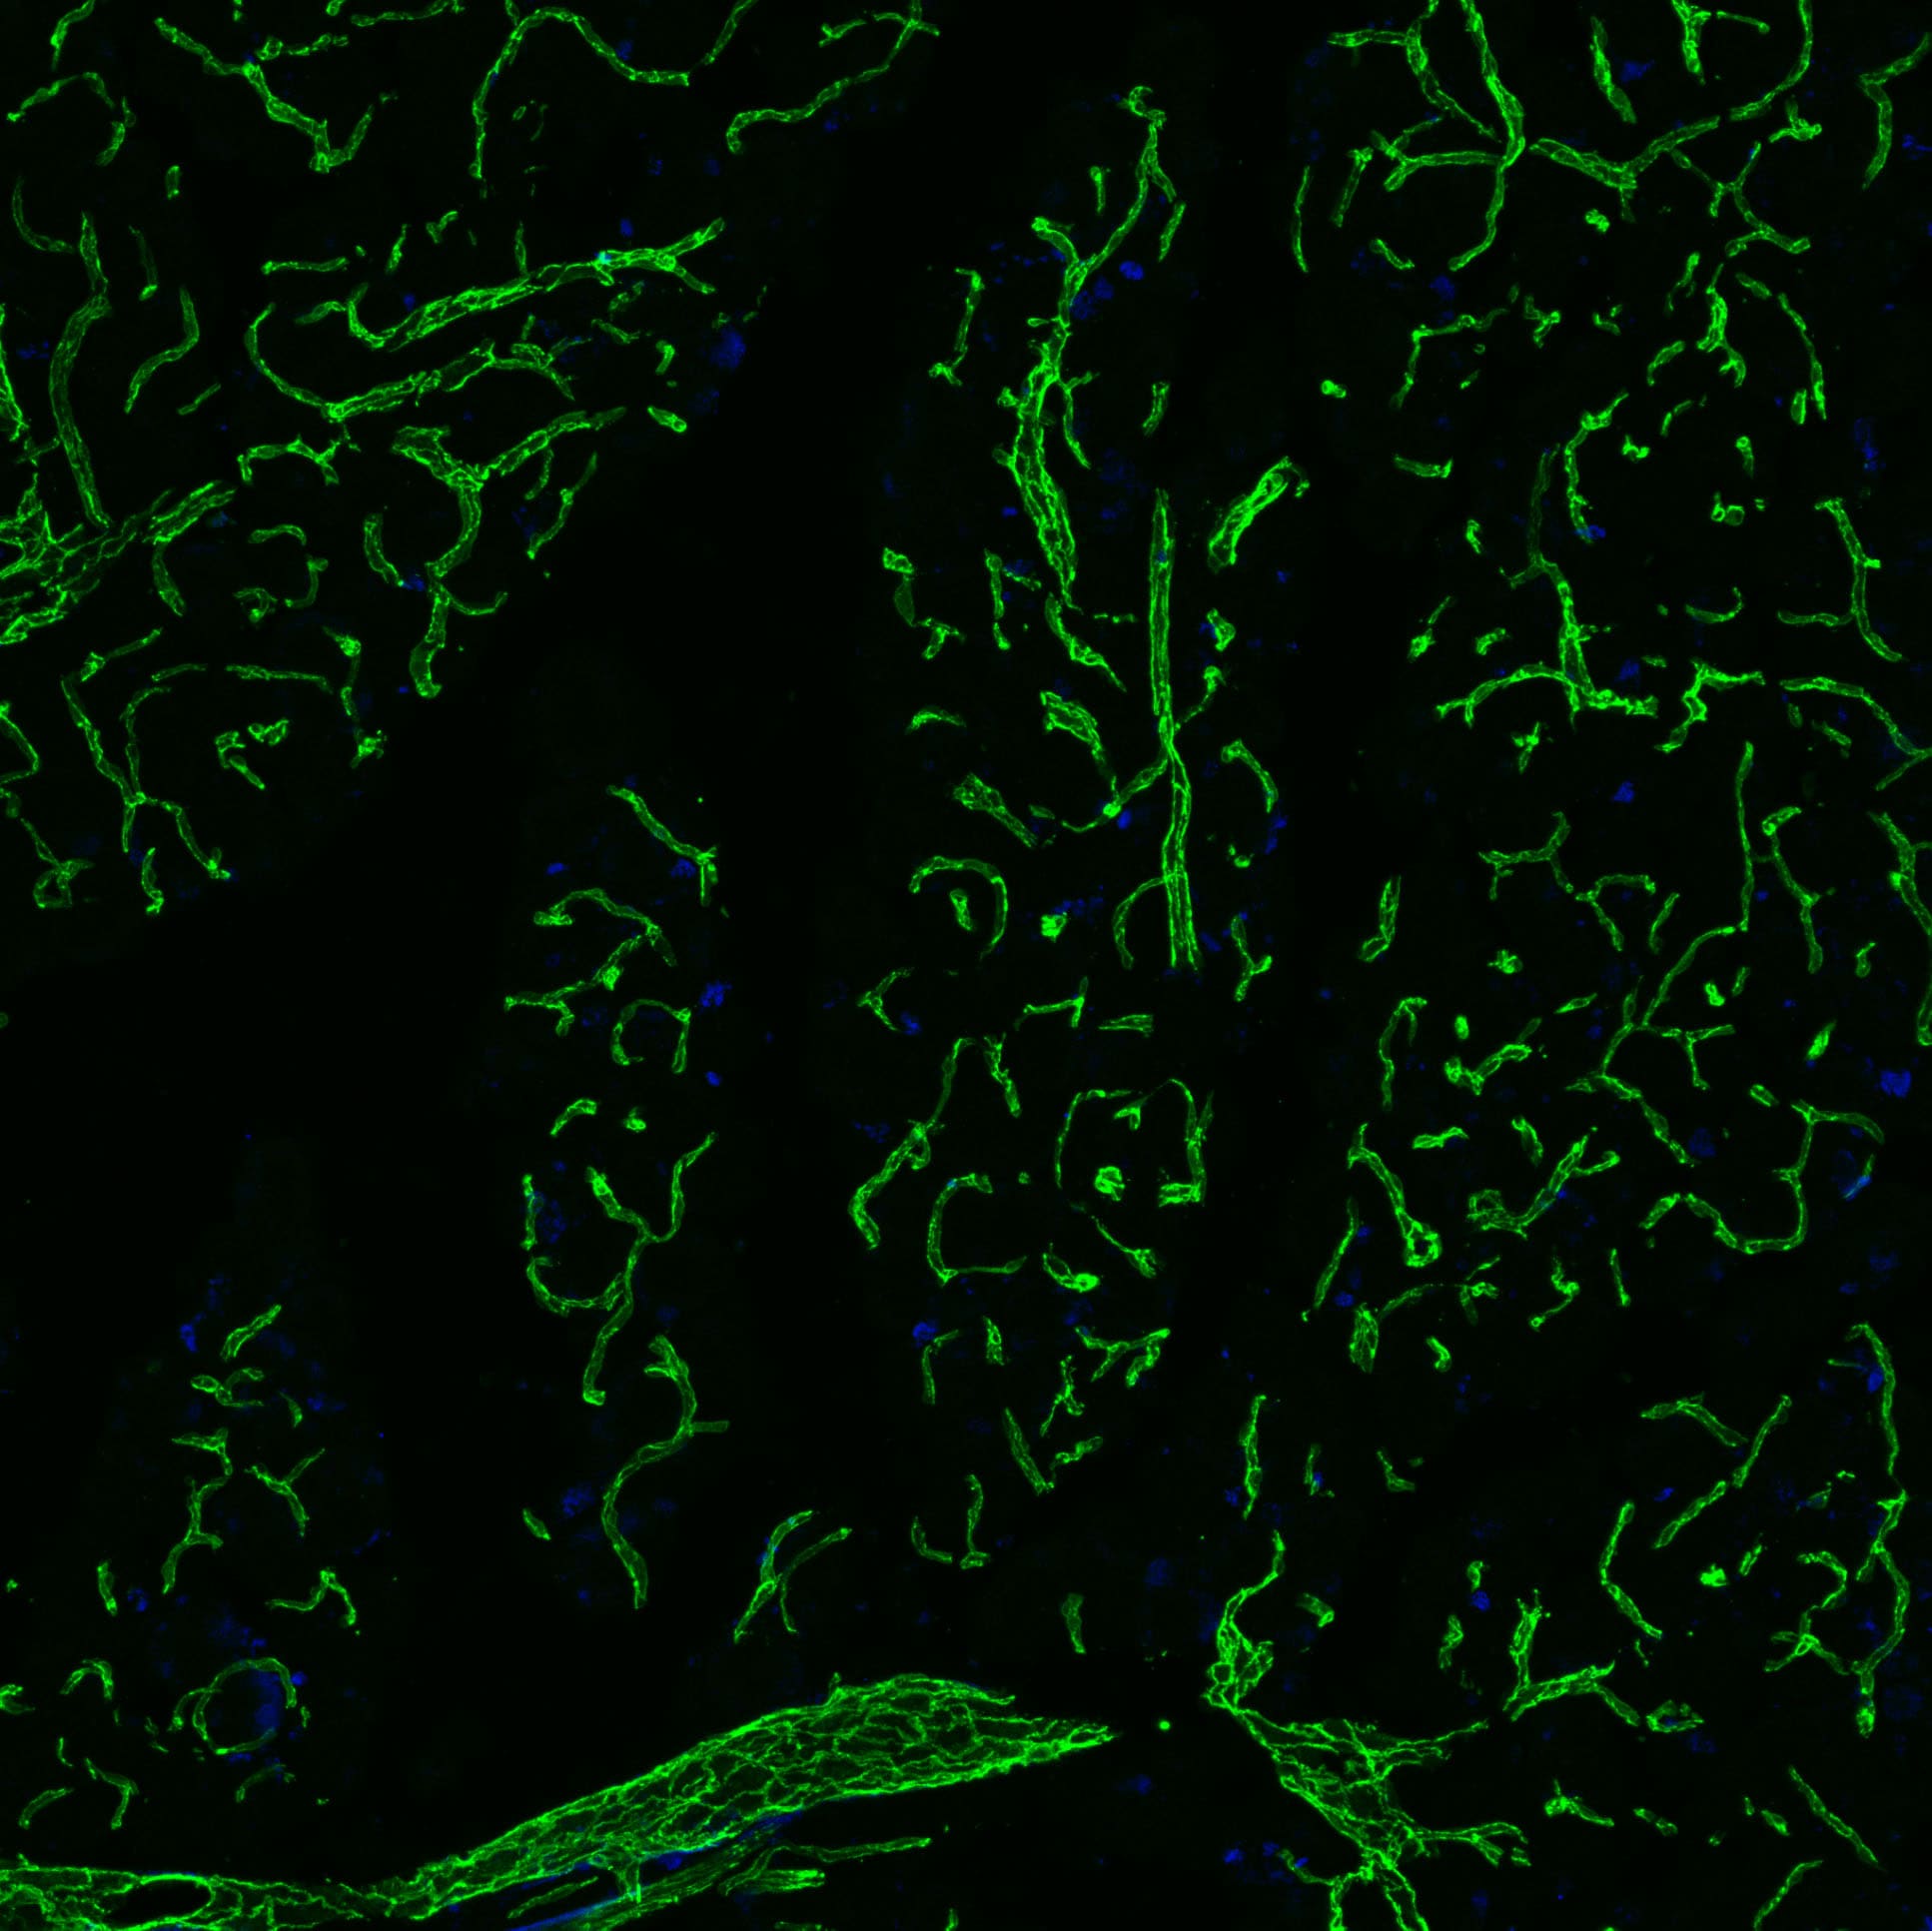
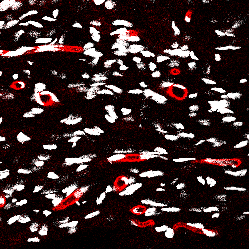
Application: Immunohistochemistry-FrozenSample Tested: Lung tissueSpecies: MouseVerified Customer | Posted 05/11/2026Representative IHC-frozen IF images of vascular regions in frozen mouse lung sections. Frozen lung tissue sections from adult C57BL/6 mice were fixed with 4% PFA for 10 min and stained for endothelial cells using CD31 (green), with WGA labeling (red).CD31 IHC-frozen immunofluorescence staining was performed well in frozen mouse lung tissue sections fixed with 4% PFA for 10 min in a humidity chamber and air-dried for 20 min at room temperature. In this format, the CD31 antibody was used at 1:200 in 1x PBS to label vascular endothelial cells, producing clear vascular staining in frozen lung sections. This condition was effective for identifying pulmonary endothelial structures and provided a useful complementary approach to FFPE staining.

-
Application: ImmunofluorescenceSample Tested: lung cells and endothelial cellsSpecies: HumanVerified Customer | Posted 09/10/2025IF staining of human lung endothelial cells with cd31/pecam1human cells IF staining with cd31/pecam1
-
Application: Immunohistochemistry (paraffin-embedded) of Native Adult Rat lung tissue stained for Abca3 (red), CD31/PECAM-1 (green), and Dclk1 (cyan).Sample Tested: Lung tissueSpecies: RatVerified Customer | Posted 07/19/2025
-
Application: ImmunohistochemistrySample Tested: Lung tissueSpecies: MouseVerified Customer | Posted 12/28/2024Serial sections of murine lung tissue.
-
Application: Immunocytochemistry/ImmunofluorescenceSample Tested: Human lung tissueSpecies: HumanVerified Customer | Posted 08/08/2024DAPI GFP-vwf RFP-alpha sma CY5-cd31
-
Application: Immunocytochemistry/ImmunofluorescenceSample Tested: Primary Mouse endothelial cellsSpecies: MouseVerified Customer | Posted 08/08/2024DAPI-blue GFP-cd31 RFP-alpha sma
-
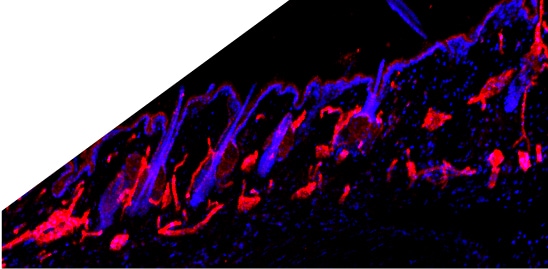
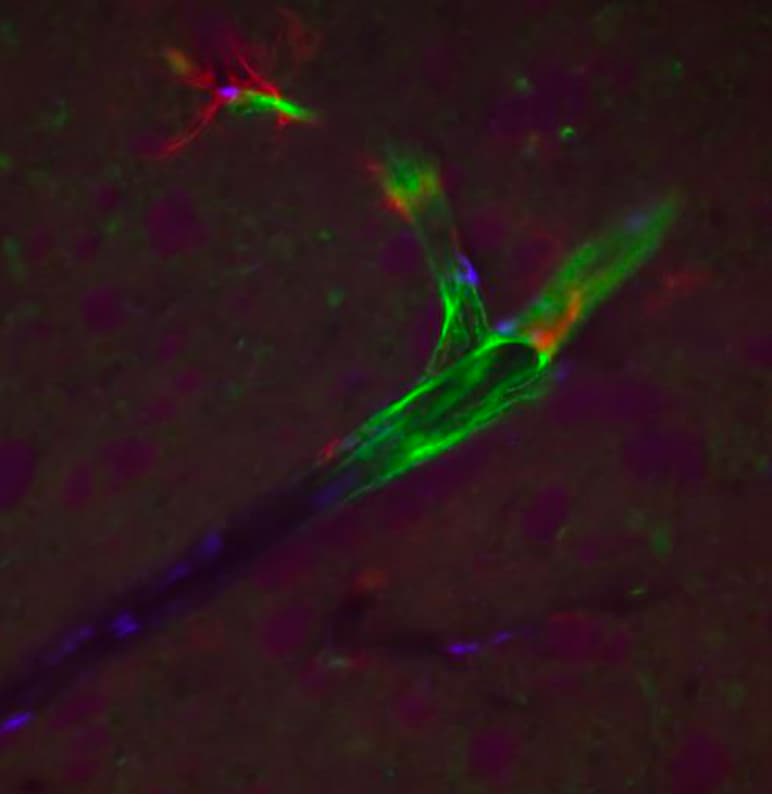
Application: Immunohistochemistry-FrozenSample Tested: Mouse sciatic nerve and Sciatic NerveSpecies: MouseVerified Customer | Posted 04/05/2024Image depicting CD31 AF3628 in red and GFP NB100-1614 in magenta. Tissue is a fixed frozen section of sciatic nerve obtained from a S100A4 GFP mouse.AF3628 was diluted 1 in 500 and was left on tissue sections overnight at 4 degrees Celsius. Secondary antibody was donkey anti goat conjugated to Alexa 594.
-
Application: Immunocytochemistry/ImmunofluorescenceSample Tested: Lung tissueSpecies: MouseVerified Customer | Posted 09/15/2023Mouse lungs stained with DAPI (Cyan) and CD31 AF3628 (Red) at 1:200 dilution of primary and secondary antibodies.
-
Application: Immunohistochemistry-ParaffinSample Tested: FFPESpecies: MouseVerified Customer | Posted 04/06/2023CD31 immunoreactivity in mouse lung. AF3628 was diluted to a final concentration of 1ug per mL and was left on tissue sections for 30m at room temperature.
-
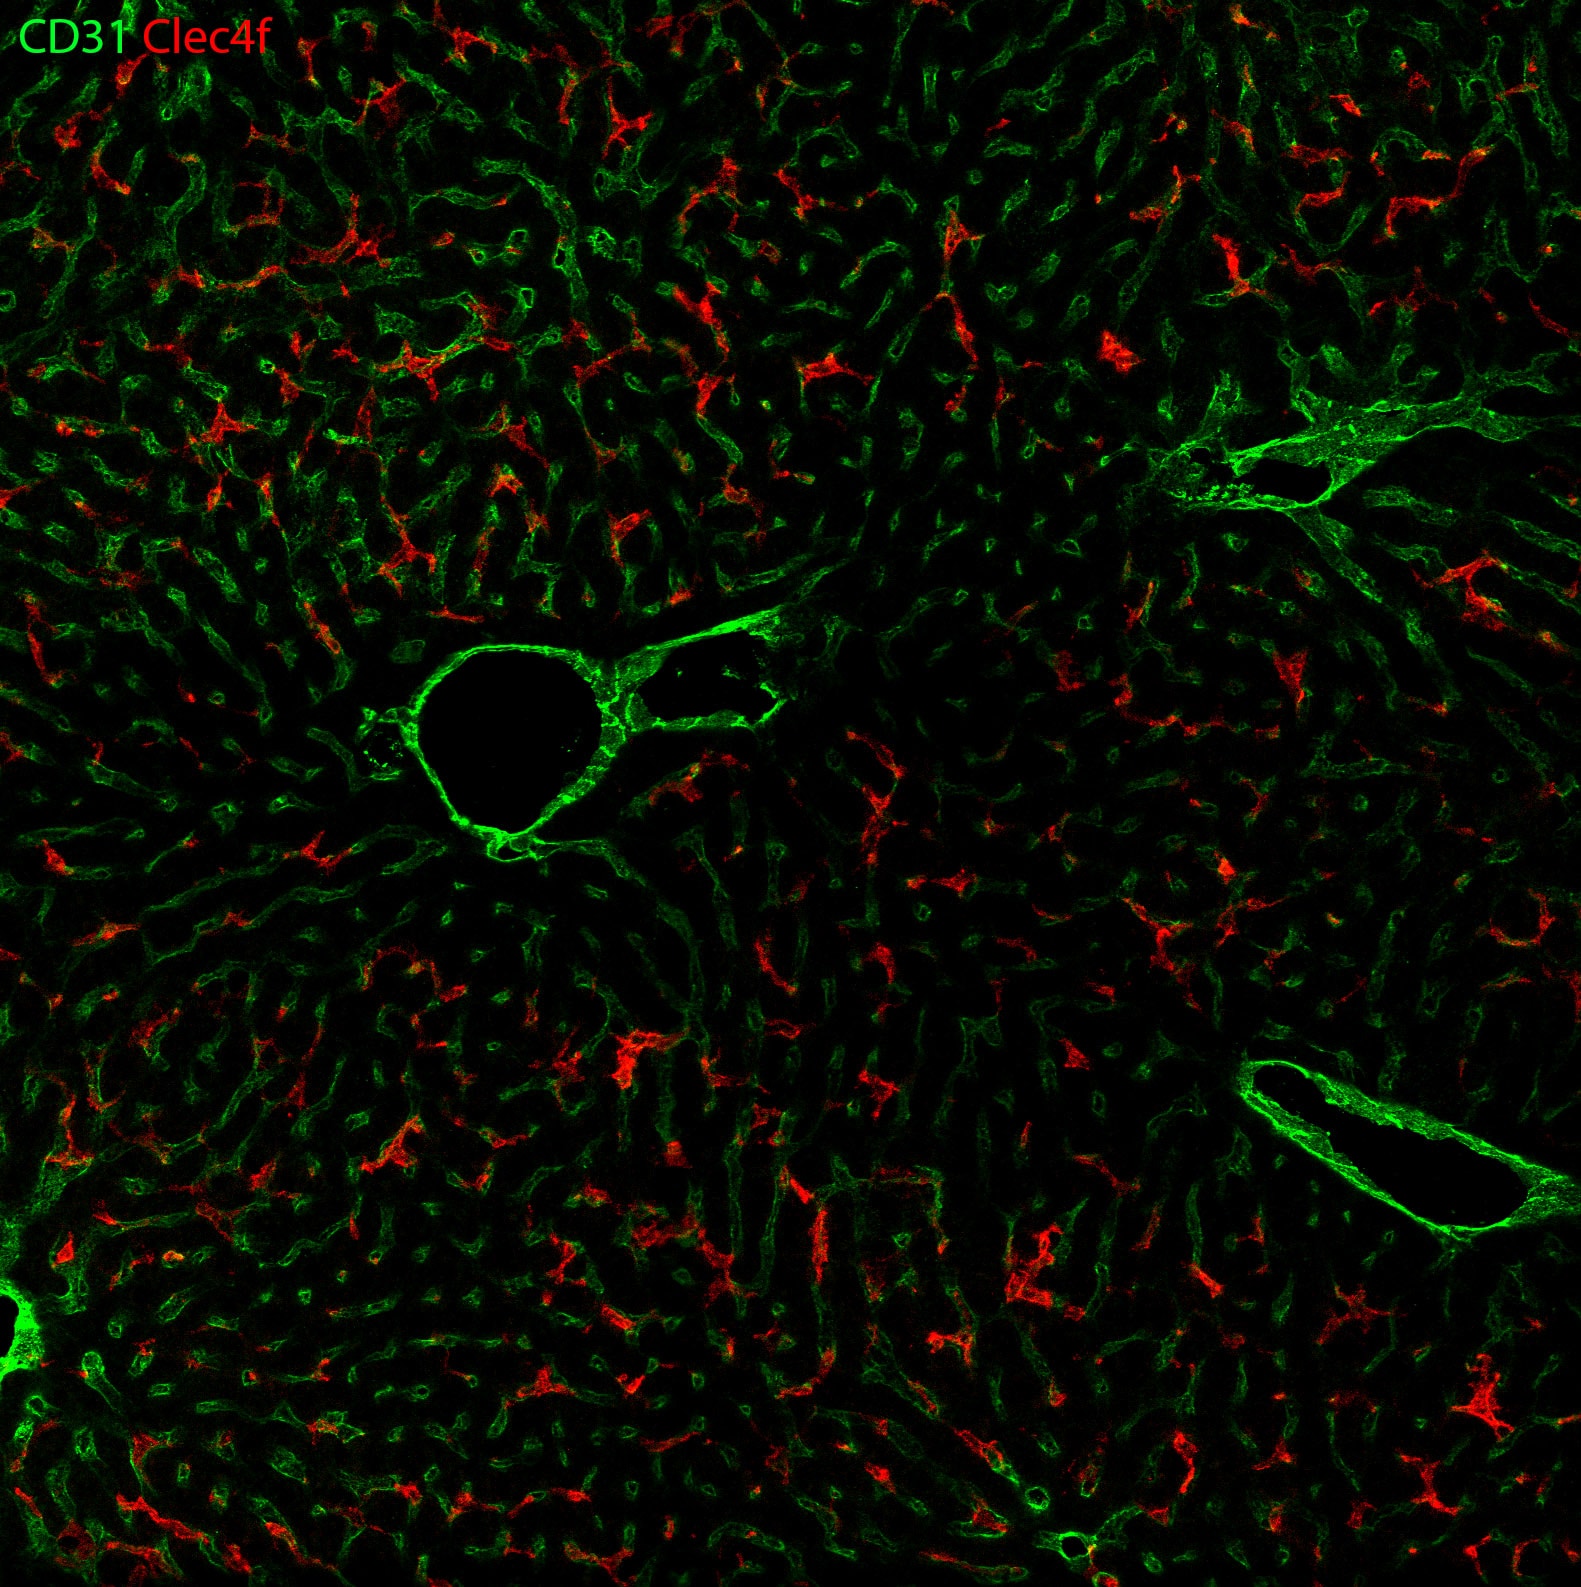
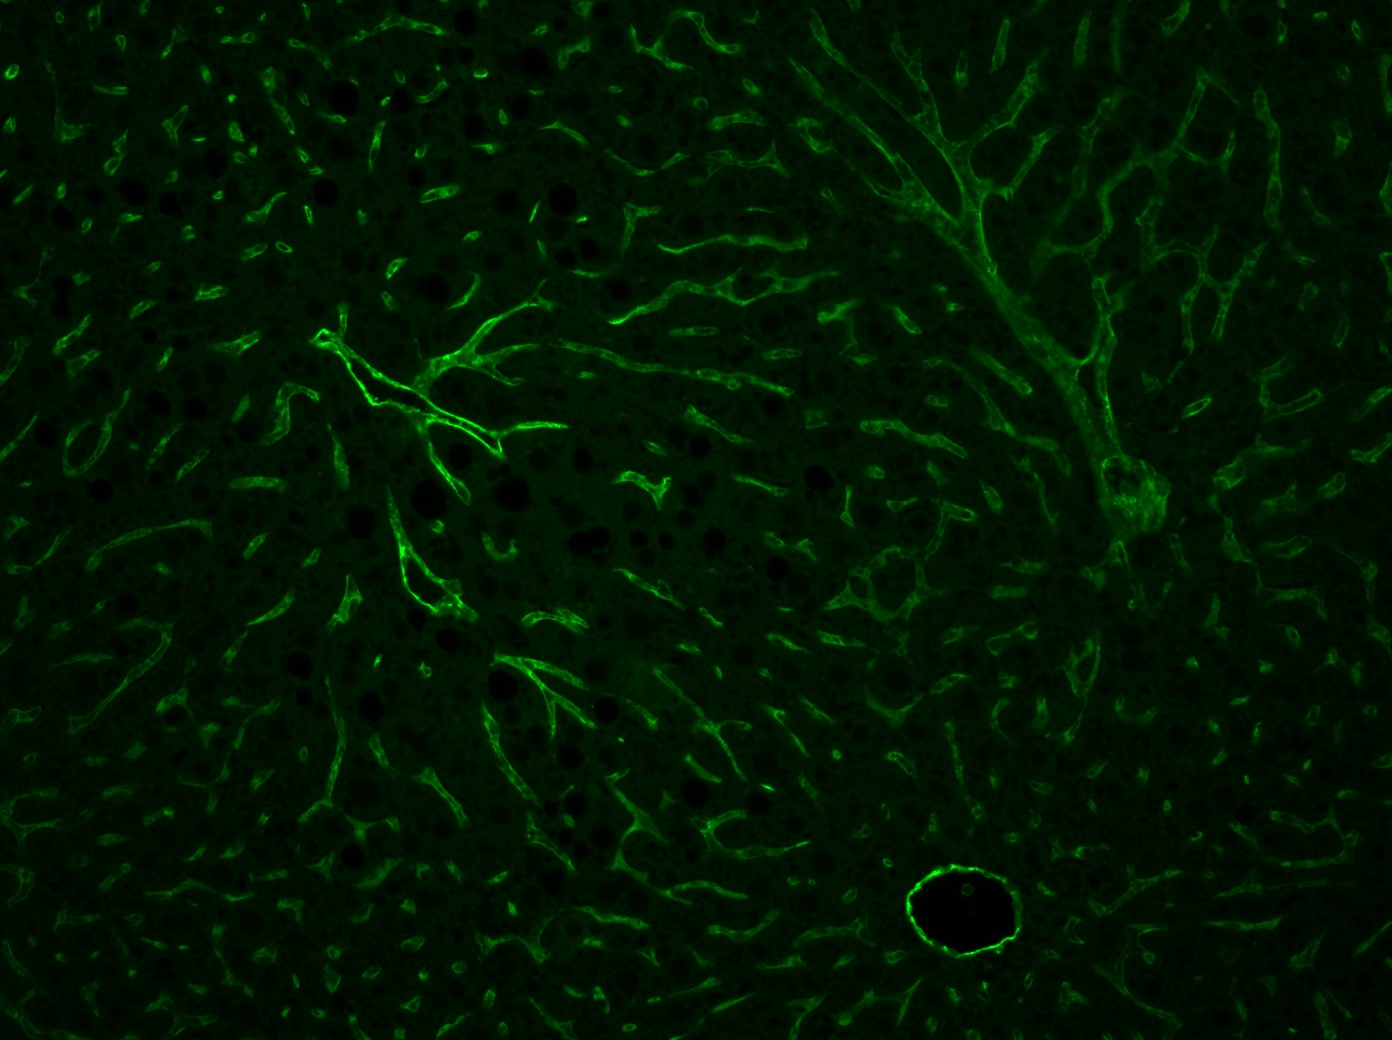
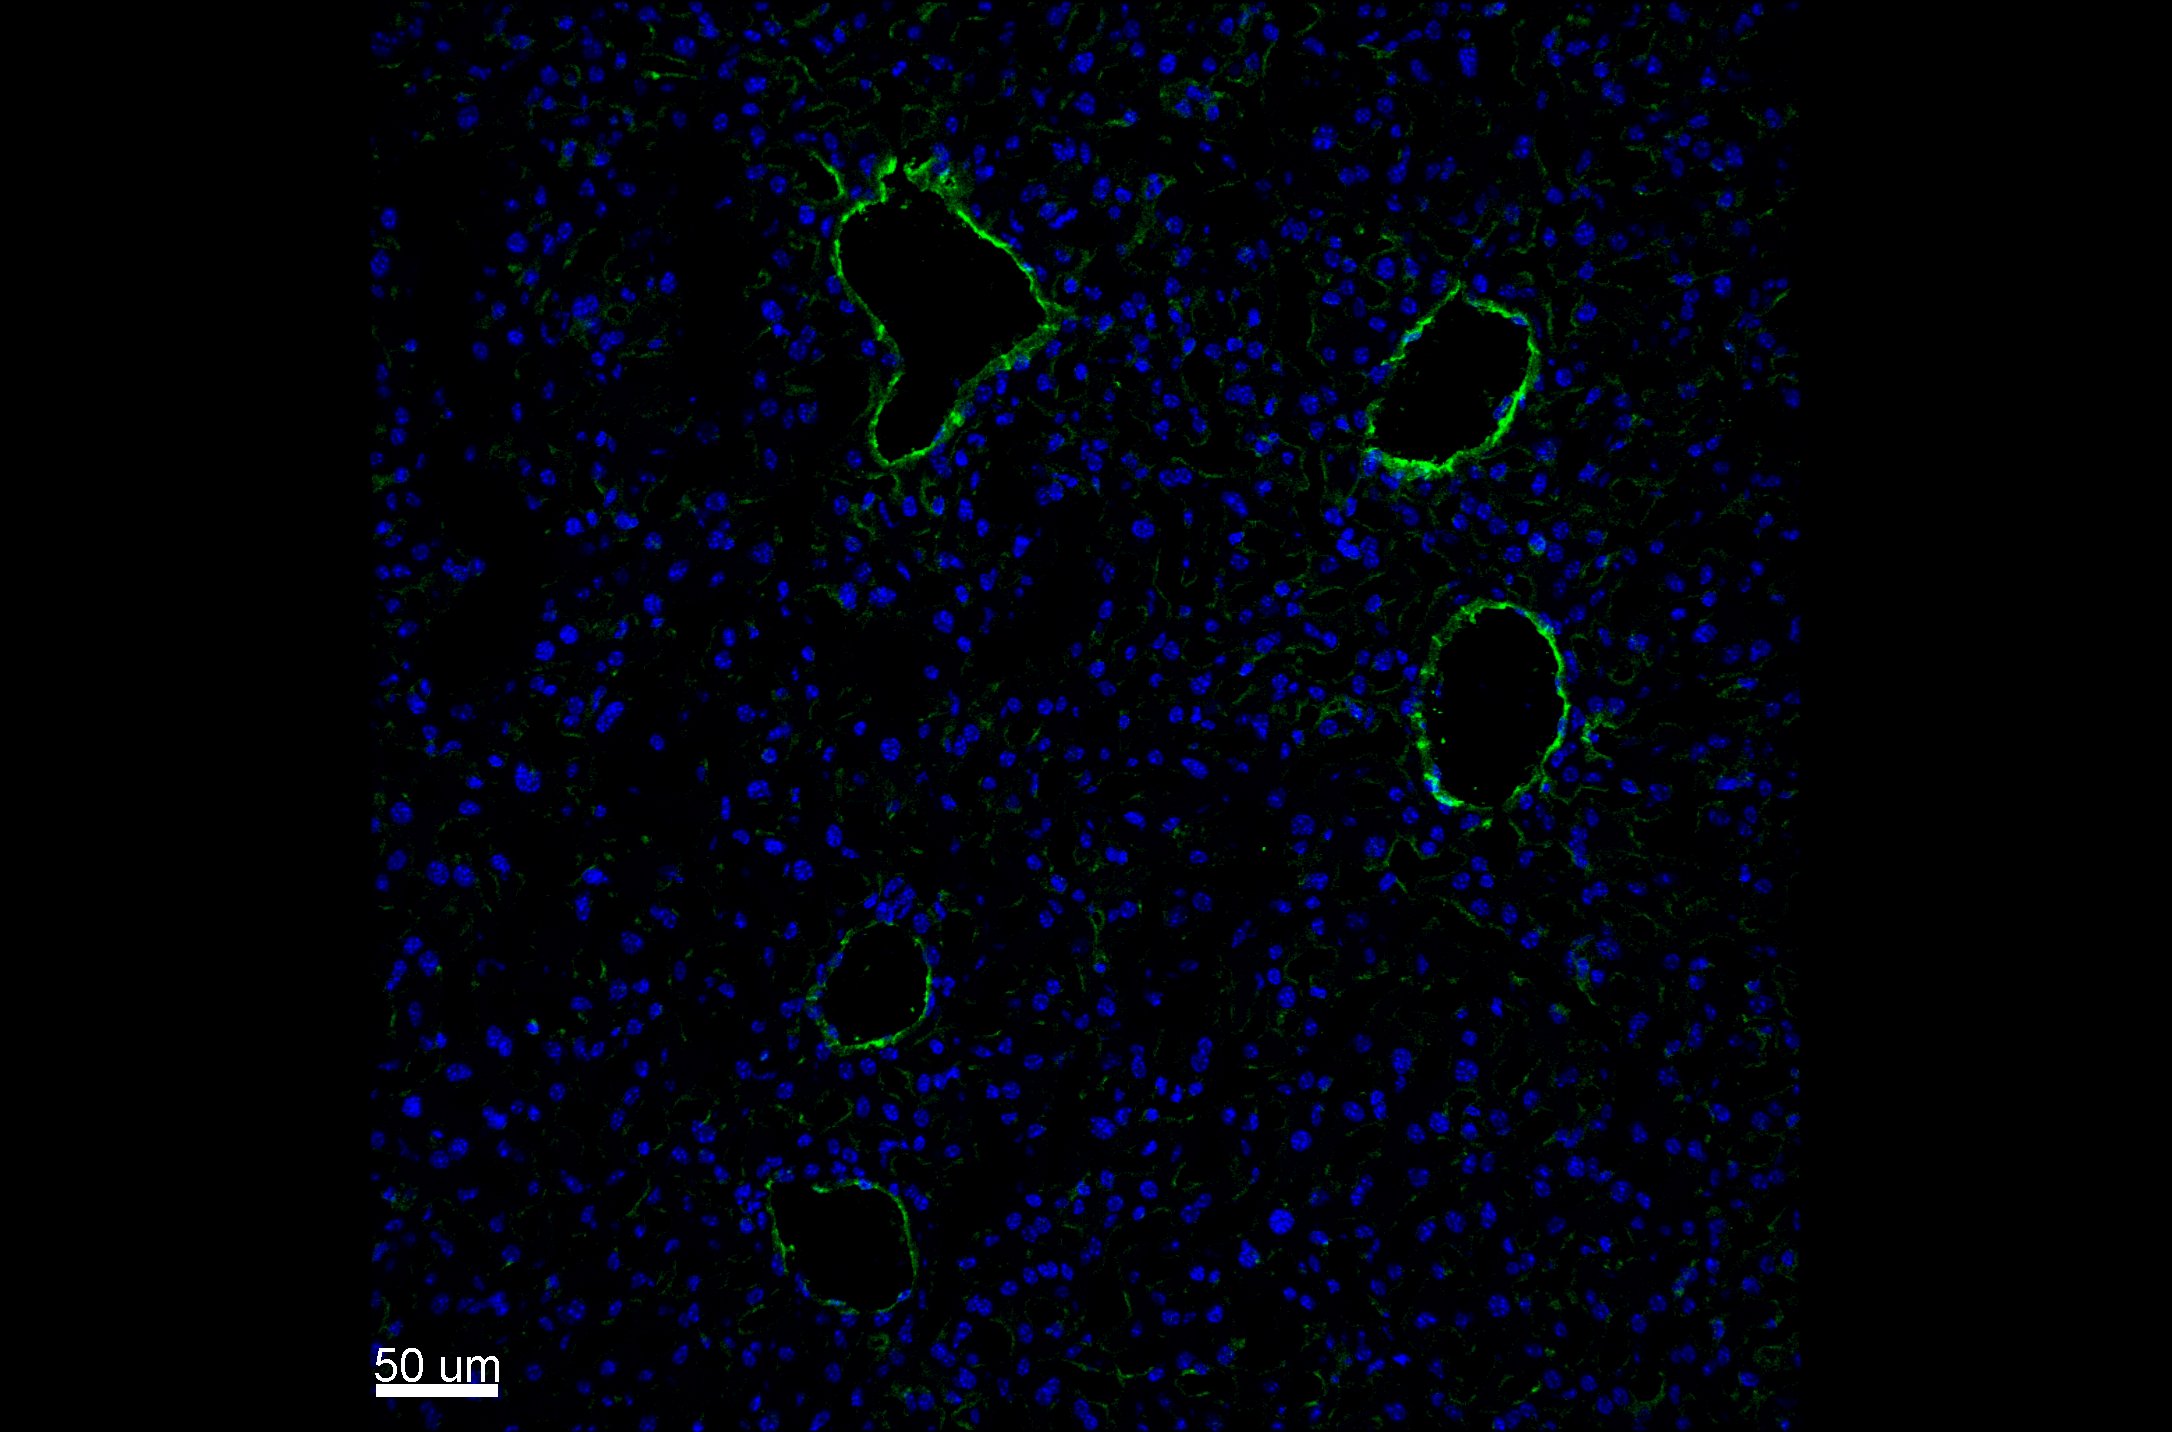
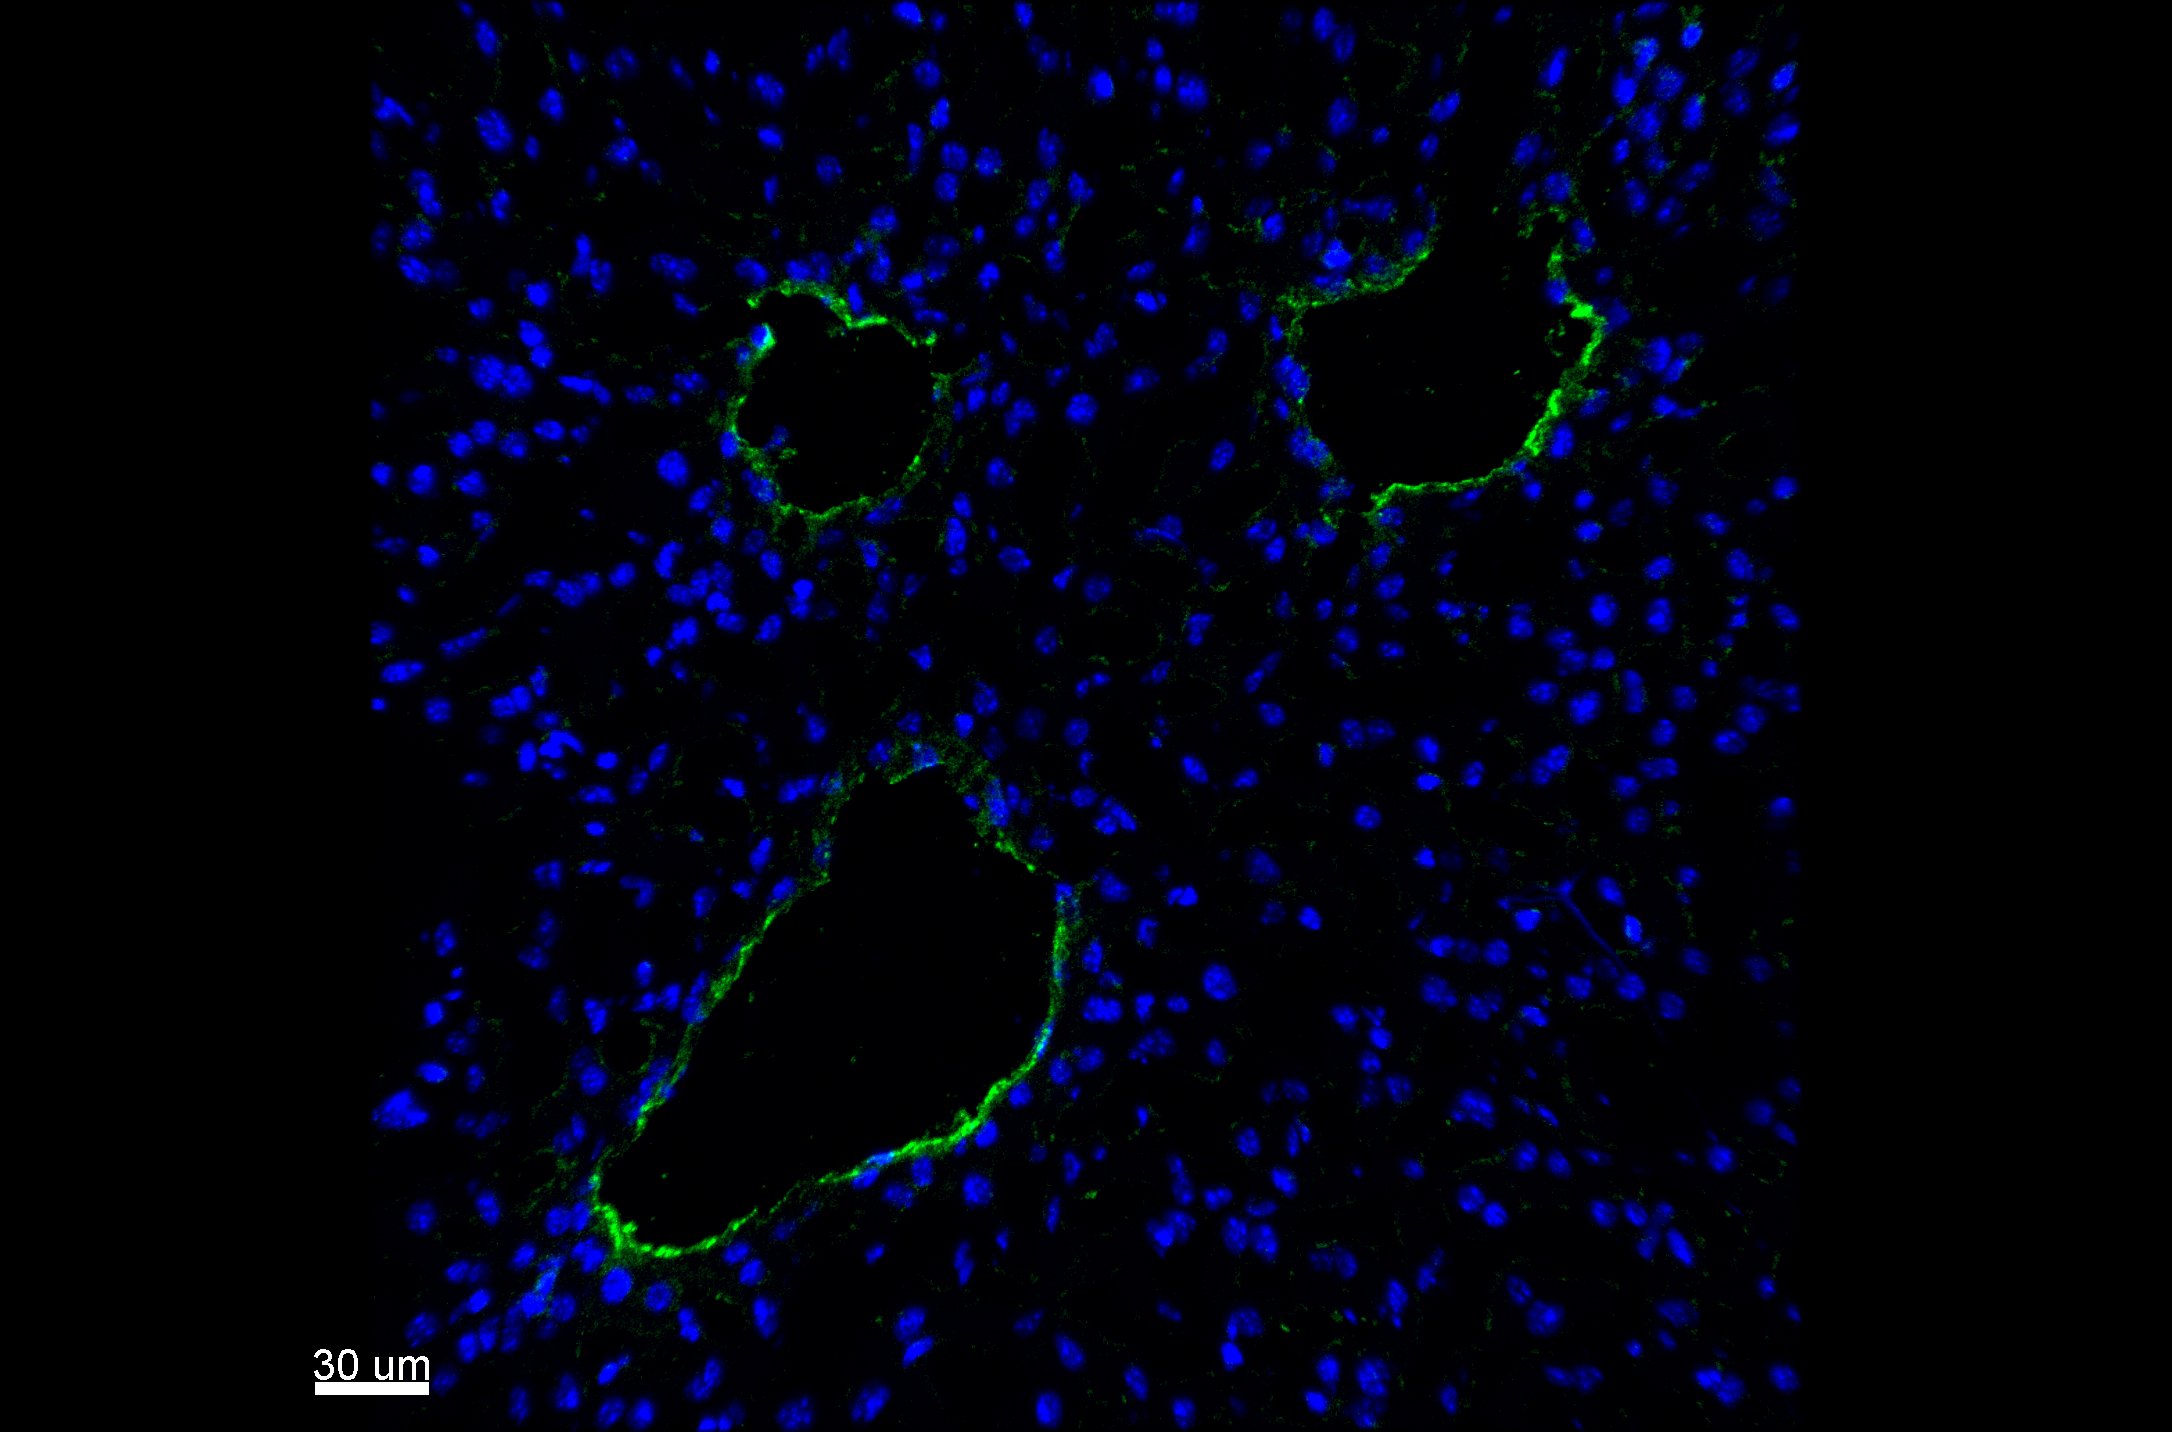
Application: Immunocytochemistry/ImmunofluorescenceSample Tested: Liver tissueSpecies: MouseVerified Customer | Posted 09/14/2022PLP fixed 12 μm cryosection of mouse liver was stained 1:200 (from a stock of 0.2 mg/ml) overnight at room temperature (and with an antibody against Clec4f), followed by Donkey anti-goat CF488A @ 1:500 for 1h @ room temperature. Great staining of liver endothelium.
-
Application: Immunocytochemistry/ImmunofluorescenceSample Tested: Adult pancreasSpecies: MouseVerified Customer | Posted 08/18/2022Adult pancreas cryostat sections stained with goat anti-CD31 and a donkey anti-goat AF488 (in green) as well as a directly conjugated rat anti-CD45-BV421 antibody (in blue). The CD31 staining works very well, clearly labelling pancreatic endothelium.
-
Application: Immunocytochemistry/ImmunofluorescenceSample Tested: Lung tissue and Lung cancer tissueSpecies: MouseVerified Customer | Posted 02/05/2022This antibody is good and easy to use!
-
Application: StainingSample Tested: ulnaSpecies: MouseVerified Customer | Posted 12/20/2021strong staining at 1/100 secondary AF647
-
Application: Immunocytochemistry/ImmunofluorescenceSample Tested: Adipose tissueSpecies: MouseVerified Customer | Posted 11/30/2021
-
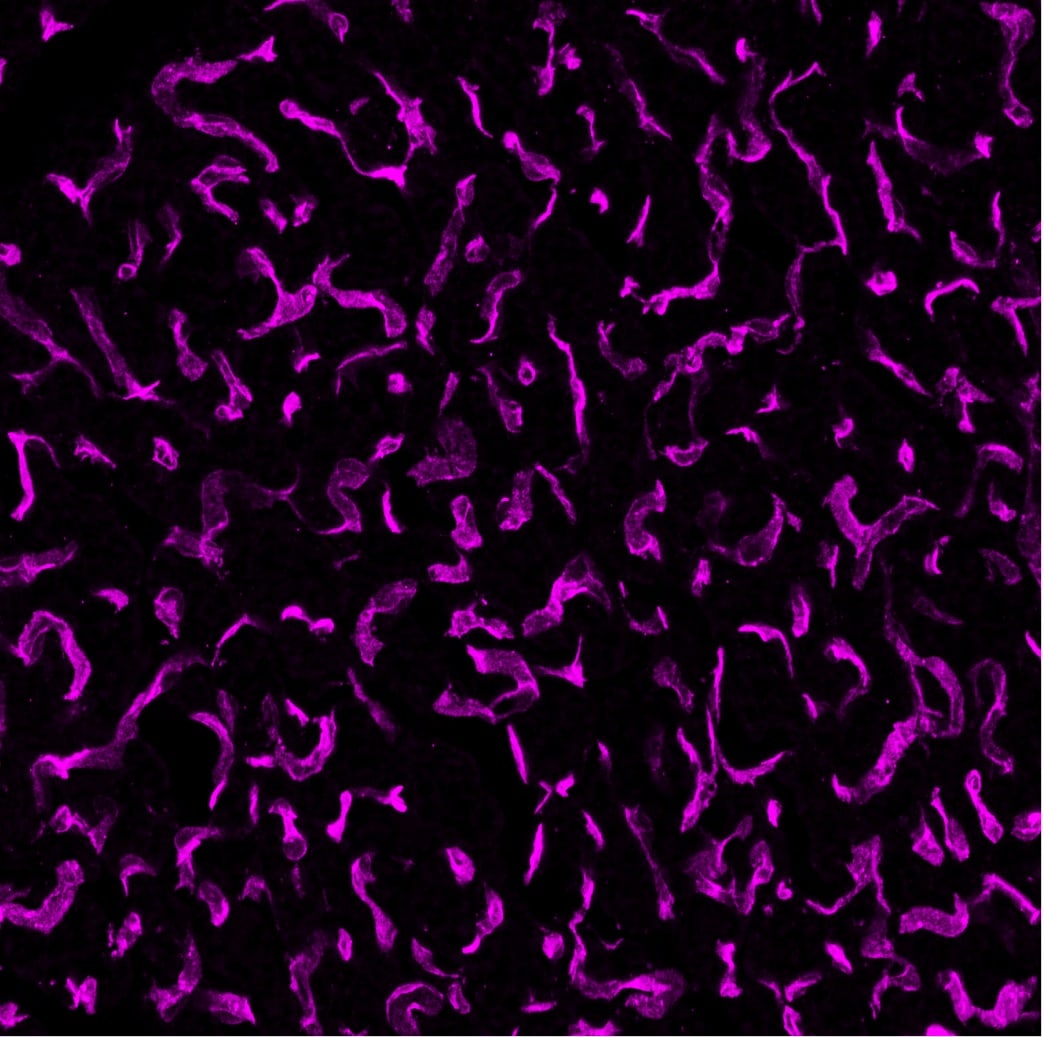
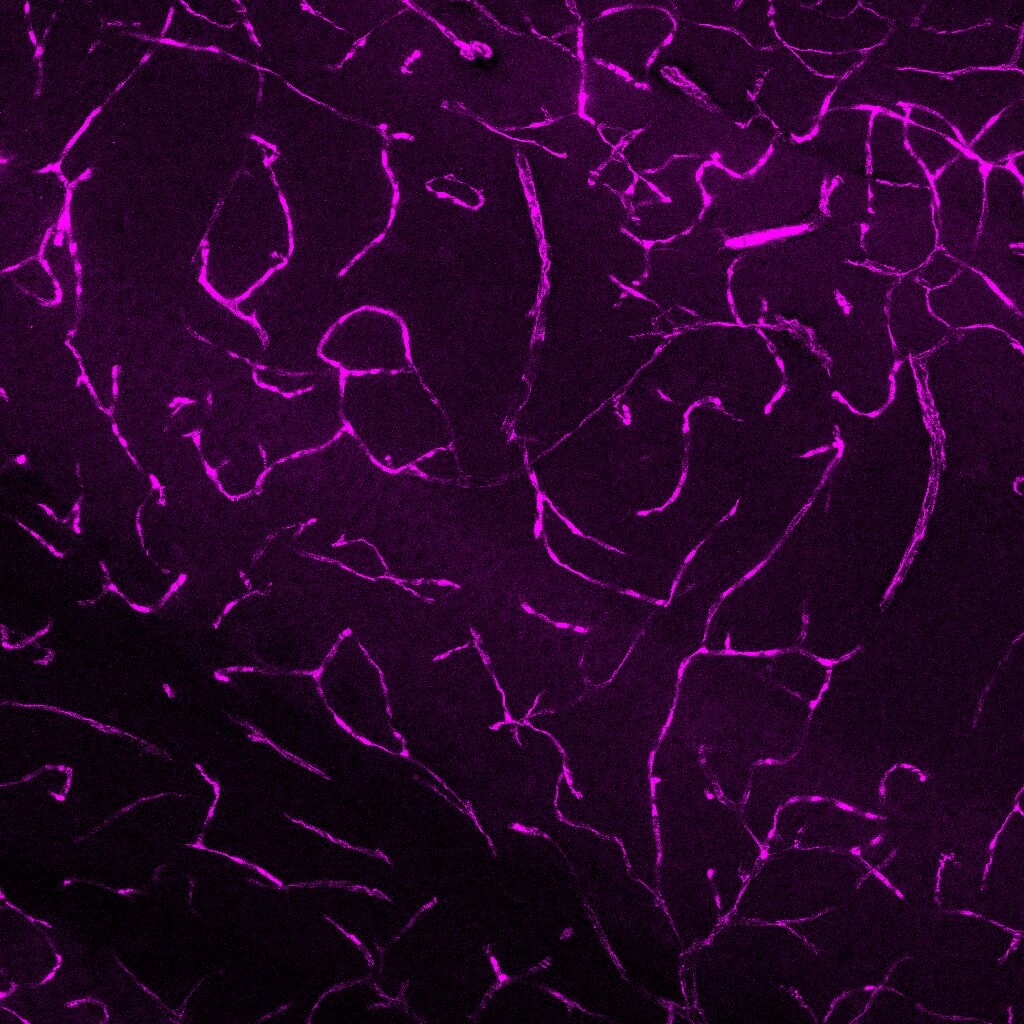
Application: Immunocytochemistry/ImmunofluorescenceSample Tested: Brown adipose tissueSpecies: MouseVerified Customer | Posted 12/09/2020Detection of CD31/PECAM‑1 in Mouse brown adipose tissue. 4% PFA fixed Brown adipose tissue was embedded in OCT and cryosectioned at 10µm. After permeabilization and blocking, tissue was incubated overnight at 4˚C with 2µg/ml of gt@CD31 (AF3628) and detected with Alexa fluor dk@gt 488 (1:1000) the next day. CD31 is presented in pseudo color violet here. This product is great, always very clear and bright. I often use it with 488 channel in tissues with strong autofluorescence such as hearts and quadriceps.
-
Application: Immunocytochemistry/ImmunofluorescenceSample Tested: E12.5 mouse embryo fixed in 4% PFASpecies: MouseVerified Customer | Posted 12/08/2020One of the best antibodies. Used on E9.5-E12.5 cryo embedded mouse embryo sections (4% PFA fixed). Attached picture is E12.5 embryo section. Dilution used - 1:200
-
Application: Immunocytochemistry/ImmunofluorescenceSample Tested: Adult brainSpecies: MouseVerified Customer | Posted 11/20/2020
-
Application: ImmunohistochemistrySample Tested: Brain (cortex) tissue and Brain (hippocampus)Species: RatVerified Customer | Posted 01/21/2020
-
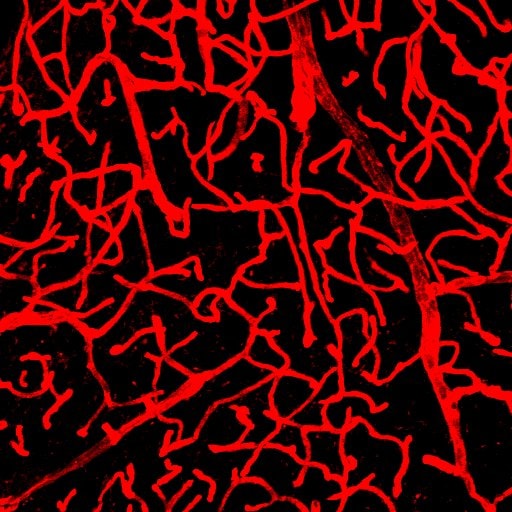
Application: ImmunohistochemistrySample Tested: P12 brain cortex and P21 brain cortexSpecies: Mouse brain tissue and MouseVerified Customer | Posted 05/10/2019P21 brain cortex stained with Cd31 primary antibody and labelled with AF594 secondary antibody. Pseudocolored as magenta.Blocking with 10% donkey serum and PBST (.3%TritonX100). Free floating vibratome sections of 80microns and staining for brain clearing purposes where methanol treatment was used, the antibody still worked really good.
-
Application: Immunohistochemistry-FrozenSample Tested: Adult spinal cord and Embryonic spinal cordSpecies: MouseVerified Customer | Posted 05/09/2019
-
Application: ImmunohistochemistrySample Tested: Liver tissueSpecies: RatVerified Customer | Posted 08/20/2018FFPE rat liver stained using AF3628 at 15 µg/mL overnight at 4C. Epitope retrieval was performed at 95 C for 15 minutes in citrate buffer pH 6.0. Secondary was donkey anti-goat Alexa Fluor 555 (psuedocolored red).
-
Application: CLARITY deep tissue imagingSample Tested: Adult kidneySpecies: MouseVerified Customer | Posted 06/02/2018Optically cleared 1 mm mouse kidney section Imaged by diSPIM in 60% TDE with 17X lens Secondary antibody is donkey anti goat alexa 488 Red is Tubulin Beta 3 stained by alexa 568
-
Application: Simple WesternSample Tested: Vein LysateSpecies: MouseVerified Customer | Posted 05/25/2018This run was performed under reducing conditions using the 12-230 kDa separation system in combination with a secondary anti-goat-HRP antibody (biotechne, HAF109, 1:50). Lysis buffer: RIPA, prot. conc.: 0.2 µg/µl. Simple Western lane view shows one specific signal (~135 kDa) in lysates prepared from a mouse vein.
-
Application: Immunocytochemistry/ImmunofluorescenceSample Tested: Adult brainSpecies: MouseVerified Customer | Posted 04/05/2018Excellent!
-
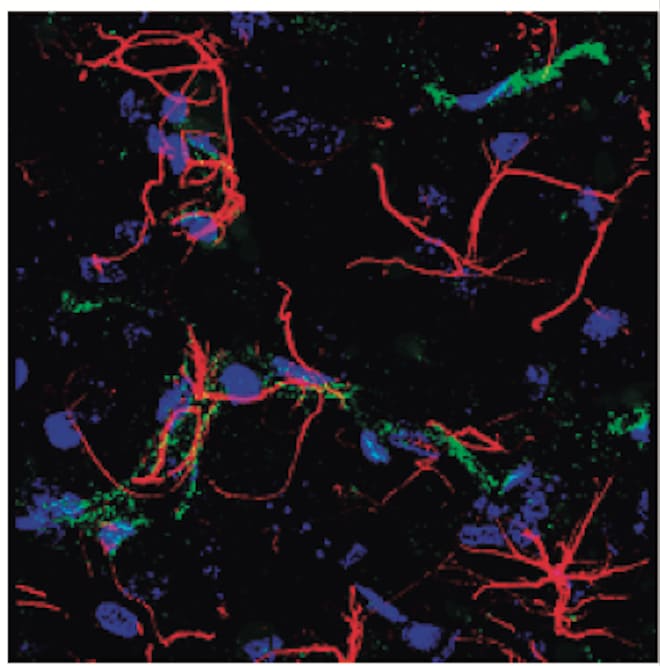
Application: Immunohistochemistry-FrozenSample Tested: BrainSpecies: MouseVerified Customer | Posted 04/02/2018PECAM‑1 in red, DAPI in blueCD31/PECAM‑1 was detected in PFA fixed brain sections of adult mouse using Goat Anti-Mouse/PECAM‑1 (#AF3628) at 5 µg/mL overnight at 4 °C. Tissue was stained using the Alexa568-conjugated Donkey anti-Goat IgG Secondary Antibody and counterstained with DAPI (blue).
-
Application: ImmunohistochemistrySample Tested: Liver tissueSpecies: MouseVerified Customer | Posted 03/26/2018FFPE mouse liver stained O/N at 4C with AF3826 at 10 ug/mL in 0.3% PBS-Tx. Secondary Donkey anti-goat Alexa Fluor 488 was applied for 1 hr RT at 2 ug/mL in PBS-Tx. Citrate buffer pH 6.0 used for epitope retrieval.
-
Application: ImmunohistochemistrySample Tested: Embryonic kidneySpecies: MouseVerified Customer | Posted 09/12/2017
-
Application: ImmunohistochemistrySample Tested: Formalin Fixed Paraffin Embedded Mouse LiverSpecies: MouseVerified Customer | Posted 06/29/2017WD [1:500], HIER with DIVA; secondary ab RTU Polymer-HRP
-
Application: ImmunocytochemistrySample Tested: Mouse Liver TissueSpecies: MouseVerified Customer | Posted 05/26/20174% PFA fixed mouse liver was stained for CD31+ blood vessels ( green) and counter stained with DAPI (blue)Frozen Tissue 4% PFA fixation
-
Application: ImmunocytochemistrySample Tested: Mouse Liver TissueSpecies: MouseVerified Customer | Posted 05/26/2017Acetone fixed mouse liver was stained for CD31+ blood vessels (in green) and counter stained with DAPI (blue).Frozen tissue Cold Acetone fixation
-
Application: ImmunohistochemistrySample Tested: Embryo tissueSpecies: MouseVerified Customer | Posted 08/08/2016E9.5 mouse embryonic tissue, whole mount staining with 1:100 dilution, Alex Fluor 594 donkey anti-goat with 1:400 dilution.
There are no reviews that match your criteria.
Protocols
Find general support by application which include: protocols, troubleshooting, illustrated assays, videos and webinars.
- 7-Amino Actinomycin D (7-AAD) Cell Viability Flow Cytometry Protocol
- Antigen Retrieval Protocol (PIER)
- Antigen Retrieval for Frozen Sections Protocol
- Appropriate Fixation of IHC/ICC Samples
- Cellular Response to Hypoxia Protocols
- Chromogenic IHC Staining of Formalin-Fixed Paraffin-Embedded (FFPE) Tissue Protocol
- Chromogenic Immunohistochemistry Staining of Frozen Tissue
- ClariTSA™ Fluorophore Kits
- Detection & Visualization of Antibody Binding
- Extracellular Membrane Flow Cytometry Protocol
- Flow Cytometry Protocol for Cell Surface Markers
- Flow Cytometry Protocol for Staining Membrane Associated Proteins
- Flow Cytometry Staining Protocols
- Flow Cytometry Troubleshooting Guide
- Fluorescent IHC Staining of Frozen Tissue Protocol
- Graphic Protocol for Heat-induced Epitope Retrieval
- Graphic Protocol for the Preparation and Fluorescent IHC Staining of Frozen Tissue Sections
- Graphic Protocol for the Preparation and Fluorescent IHC Staining of Paraffin-embedded Tissue Sections
- Graphic Protocol for the Preparation of Gelatin-coated Slides for Histological Tissue Sections
- ICC Cell Smear Protocol for Suspension Cells
- ICC Immunocytochemistry Protocol Videos
- ICC for Adherent Cells
- IHC Sample Preparation (Frozen sections vs Paraffin)
- Immunocytochemistry (ICC) Protocol
- Immunocytochemistry Troubleshooting
- Immunofluorescence of Organoids Embedded in Cultrex Basement Membrane Extract
- Immunofluorescent IHC Staining of Formalin-Fixed Paraffin-Embedded (FFPE) Tissue Protocol
- Immunohistochemistry (IHC) and Immunocytochemistry (ICC) Protocols
- Immunohistochemistry Frozen Troubleshooting
- Immunohistochemistry Paraffin Troubleshooting
- Intracellular Flow Cytometry Protocol Using Alcohol (Methanol)
- Intracellular Flow Cytometry Protocol Using Detergents
- Intracellular Nuclear Staining Flow Cytometry Protocol Using Detergents
- Intracellular Staining Flow Cytometry Protocol Using Alcohol Permeabilization
- Intracellular Staining Flow Cytometry Protocol Using Detergents to Permeabilize Cells
- Preparing Samples for IHC/ICC Experiments
- Preventing Non-Specific Staining (Non-Specific Binding)
- Primary Antibody Selection & Optimization
- Propidium Iodide Cell Viability Flow Cytometry Protocol
- Protocol for Heat-Induced Epitope Retrieval (HIER)
- Protocol for Liperfluo
- Protocol for Making a 4% Formaldehyde Solution in PBS
- Protocol for VisUCyte™ HRP Polymer Detection Reagent
- Protocol for the Characterization of Human Th22 Cells
- Protocol for the Characterization of Human Th9 Cells
- Protocol for the Fluorescent ICC Staining of Cell Smears - Graphic
- Protocol for the Fluorescent ICC Staining of Cultured Cells on Coverslips - Graphic
- Protocol for the Preparation & Fixation of Cells on Coverslips
- Protocol for the Preparation and Chromogenic IHC Staining of Frozen Tissue Sections
- Protocol for the Preparation and Chromogenic IHC Staining of Frozen Tissue Sections - Graphic
- Protocol for the Preparation and Chromogenic IHC Staining of Paraffin-embedded Tissue Sections
- Protocol for the Preparation and Chromogenic IHC Staining of Paraffin-embedded Tissue Sections - Graphic
- Protocol for the Preparation and Fluorescent ICC Staining of Cells on Coverslips
- Protocol for the Preparation and Fluorescent ICC Staining of Non-adherent Cells
- Protocol for the Preparation and Fluorescent ICC Staining of Stem Cells on Coverslips
- Protocol for the Preparation and Fluorescent IHC Staining of Frozen Tissue Sections
- Protocol for the Preparation and Fluorescent IHC Staining of Paraffin-embedded Tissue Sections
- Protocol for the Preparation of Gelatin-coated Slides for Histological Tissue Sections
- Protocol for the Preparation of a Cell Smear for Non-adherent Cell ICC - Graphic
- Protocol: Annexin V and PI Staining by Flow Cytometry
- Protocol: Annexin V and PI Staining for Apoptosis by Flow Cytometry
- R&D Systems Quality Control Western Blot Protocol
- TUNEL and Active Caspase-3 Detection by IHC/ICC Protocol
- The Importance of IHC/ICC Controls
- Troubleshooting Guide: Fluorokine Flow Cytometry Kits
- Troubleshooting Guide: Immunohistochemistry
- Troubleshooting Guide: Western Blot Figures
- Western Blot Conditions
- Western Blot Protocol
- Western Blot Protocol for Cell Lysates
- Western Blot Troubleshooting
- Western Blot Troubleshooting Guide
- View all Protocols, Troubleshooting, Illustrated assays and Webinars
FAQs for CD31/PECAM-1 Antibody
-
Q: Does CD31/PECAM-1 antibody (AF3628) work on Rat Paraffin embedded tissues(FFPE)?
A: For this antibody AF3628, it has been validated for mouse and rat and listed are multiple publications stating it was used for IHC-Paraffin.