Human VCAM-1/CD106 Antibody (BBIG-V1)
R&D Systems | Catalog # BBA5

Scientific images may be resized, cropped, or adjusted for brightness or contrast for presentation purposes. These updates are limited to presentation and do not affect the underlying scientific interpretation of the data. Where available, additional source data may be provided upon request.
Key Product Details
Validated by
Species Reactivity
Validated:
Cited:
Applications
Validated:
Cited:
Label
Antibody Source
Product Specifications
Immunogen
Specificity
Clonality
Host
Isotype
Endotoxin Level
Scientific Data Images for Human VCAM-1/CD106 Antibody (BBIG-V1)
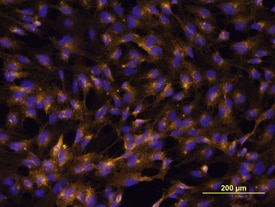
VCAM‑1/CD106 in HUVEC Cells.
VCAM-1/CD106 was detected in immersion fixed HUVEC human umbilical vein endothelial cells using Human VCAM-1/CD106 Monoclonal Antibody (Catalog # BBA5) at 10 µg/mL for 3 hours at room temperature. Cells were stained using the Northern-Lights™ 557-conjugated Anti-Mouse IgG Secondary Antibody (yellow; Catalog # NL007) and counter-stained with DAPI (blue). View our protocol for Fluorescent ICC Staining of Cells on Coverslips.This antibody is not suitable for labeling formalin-fixed, paraffin-embedded tissue.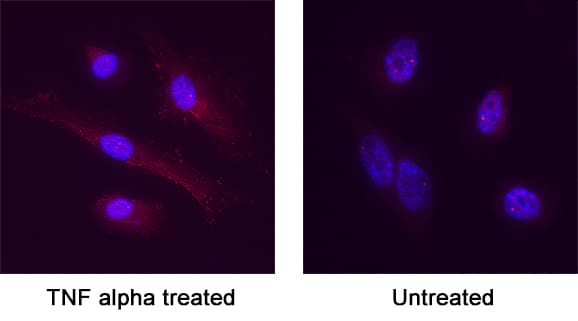
VCAM‑1/CD106 in HUVEC cells treated with TNF alpha (positive) and untreated HUVEC cells (negative).
VCAM‑1/CD106 was detected in immersion fixed HUVEC cells treated with TNF alpha (positive) and untreated HUVEC cells (negative) using Mouse Anti-Human VCAM‑1/CD106 Monoclonal Antibody (Catalog # BBA5) at 8 µg/mL for 3 hours at room temperature. Cells were stained using the NorthernLights™ 557-conjugated Anti-Mouse IgG Secondary Antibody (red; Catalog # NL007) and counterstained with DAPI (blue). Specific staining was localized to plasma membrane. View our protocol for Fluorescent ICC Staining of Non-adherent Cells.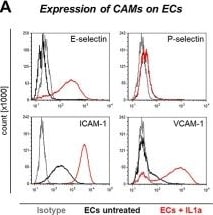
Detection of VCAM-1/CD106 by Flow Cytometry
Cell surface expression of CAMs on HUVECs, experimental setup of flow adhesion assay, and effects of antibody blockade on dynamic tumor-endothelium interaction. (A) Flow cytometric determination of CAM expression levels on HUVECs under untreated (black line) and IL1a-stimulated (red line) conditions. Grey lines indicate isotype control measurements. (B) The dynamic adhesion of human TCs to human ECs was analyzed in a laminar flow adhesion assay (shear stress = 0.25 dyn/cm2). Adhesive events were captured by video microscopy and distinguished into firm, rolling and tethering adhesions during analysis. These different adhesive interactions were indicated by different bar patterns in all figures as illustrated. EC = endothelial cell, TC = tumor cell, ROI = region of interest. (C) Number of adhesive events/ min of TCs grouped according to their sLeA/X status (group I–III) on ECs. ECs were left untreated or treated with IL1a with or without E-selectin blockade. #P < 0.05, ##P < 0.01, ###P < 0.001 (IL1a vs. control); *P < 0.05, **P < 0.01, *** P < 0.001 (anti-E-Sel + IL1a vs. IL1a). (D) Number of adhesive events/min of TCs on ECs treated with cytokine, E-selectin-, and/or VCAM-1-blocking antibody or isotype control, as indicated. *P < 0.05, **P < 0.01, *** P < 0.001 (anti-E-selectin/anti-VCAM-1 + IL1a vs. IgG1 + IL1a). (E + F) number of adhesive events/min of TCs from group I and II on ECs after antibody blockade of sLeA and/or sLeX on TCs. *P < 0.05, **P < 0.01 (anti-sLeA/X-treated vs. IgM). TCs without addition of antibody or IgM served as control. Bars in (C–F) represent mean ± SD of triplicate recordings each from two independent experiments (n = 6). Image collected and cropped by CiteAb from the following open publication (https://pubmed.ncbi.nlm.nih.gov/37486674), licensed under a CC-BY license. Not internally tested by R&D Systems.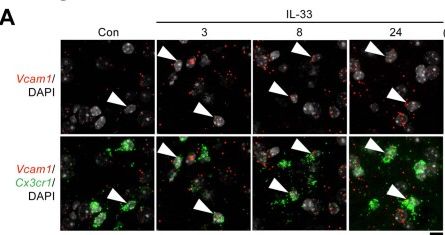
Detection of VCAM-1/CD106 by Immunohistochemistry
Chemotactic microglia migrate toward amyloid-beta plaques after interleukin-33 treatment.a-c, The induction of chemotactic microglia lasts throughout the chemotactic phase. a,b, Representative images (a) and quantification (b) showing the proportion of chemotactic microglia (that is, Vcam1+Cx3cr1+ cells) after interleukin-33 (IL-33) treatment (3 h Con: n = 4; 3 h IL-33: n = 5; 8 h Con: n = 3; 8 h IL-33: n = 4; 24 h Con: n = 5; 24 h IL-33: n = 4; two-way ANOVA with Šidák’s multiple comparisons test). Arrowheads indicate Vcam1-expressing microglia. Scale bar = 10 μm. c, UMAP plots showing Vcam1 expression across conditions. d, Bar plot quantifying the proportions of chemotactic microglia (that is, Vcam1+Cx3cr1+ cells) in uninjected and PBS-injected (Con) APP/PS1 mice (n = 4 mice per condition; two-tailed unpaired Student’s t-test). e, UMAP plots showing H2-Ab1 expression across conditions. f,g, Induction of MHC-II+ phagocytic microglia after IL-33 treatment. Representative contour plots (f) and quantification (g) showing the proportions of MHC-II+ phagocytic microglia (that is, MHC-II+ CD11b+ cells) after IL-33 treatment (Con: n = 3 mice; 3 h: n = 3 mice; 8 h: n = 3 mice; 24 h: n = 4 mice; one-way ANOVA with Dunnett’s multiple comparisons test). h,i, Chemotactic microglia gradually express MHC-II after IL-33 treatment. Representative contour plots (h) and quantification (i) showing the proportions of MHC-II–expressing chemotactic microglia (that is, MHC-II + VCAM1 + CD11b+ cells) after IL-33 treatment (3 h: n = 4 mice; 8 h: n = 4 mice; 24 h: n = 4 mice; one-way ANOVA with Dunnett’s multiple comparisons test). All data are mean ± s.e.m.Source data. Image collected and cropped by CiteAb from the following open publication (https://pubmed.ncbi.nlm.nih.gov/37735240), licensed under a CC-BY license. Not internally tested by R&D Systems.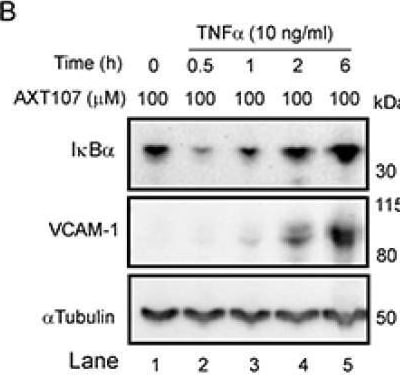
Detection of VCAM-1/CD106 by Western Blot
AXT107 regulates tumor necrosis factor alpha (TNF alpha ) signaling in endothelial cells. (A–D) Confluent human umbilical vein endothelial cells (HUVECs) (A–C) or microvascular endothelial cells (MECs) (D) pre-treated with 100 µM AXT107 or equivalent DMSO vehicle as indicated for 90 min, followed by varying durations of 10 ng/mL TNF alpha, and analyzed by Western blot. Targets included inhibitor of nuclear factor-kappa B (I kappa B alpha ), VCAM-1, ICAM-1, TNF receptor 1 (TNFR1), and TNFR2. alpha Tubulin or glyceraldehyde 3-phosphate dehydrogenase (GAPDH) is provided as the loading control. (E) Confluent HUVECs untreated (lane 1), pretreated with TNF alpha for 1 h followed by DMSO (lanes 2 and 3) or 100 µM AXT107 (lanes 5 and 6) for 30 min or 2 h, or pretreated with 100 µM AXT107 for 90 min followed by TNF alpha for 2 h (lane 4). Changes in I kappa B alpha were then measured by Western blot with GAPDH provided as a loading control. (F) Confluent HUVECs (Left) or MECs (Right) treated with TNF alpha and AXT107 as in (A–D) above and stained for TNFR1 or TNFR2. GAPDH is provided as a loading control. Image collected and cropped by CiteAb from the following open publication (https://pubmed.ncbi.nlm.nih.gov/32708100), licensed under a CC-BY license. Not internally tested by R&D Systems.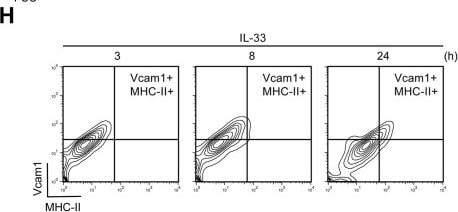
Detection of VCAM-1/CD106 by Flow Cytometry
Chemotactic microglia migrate toward amyloid-beta plaques after interleukin-33 treatment.a-c, The induction of chemotactic microglia lasts throughout the chemotactic phase. a,b, Representative images (a) and quantification (b) showing the proportion of chemotactic microglia (that is, Vcam1+Cx3cr1+ cells) after interleukin-33 (IL-33) treatment (3 h Con: n = 4; 3 h IL-33: n = 5; 8 h Con: n = 3; 8 h IL-33: n = 4; 24 h Con: n = 5; 24 h IL-33: n = 4; two-way ANOVA with Šidák’s multiple comparisons test). Arrowheads indicate Vcam1-expressing microglia. Scale bar = 10 μm. c, UMAP plots showing Vcam1 expression across conditions. d, Bar plot quantifying the proportions of chemotactic microglia (that is, Vcam1+Cx3cr1+ cells) in uninjected and PBS-injected (Con) APP/PS1 mice (n = 4 mice per condition; two-tailed unpaired Student’s t-test). e, UMAP plots showing H2-Ab1 expression across conditions. f,g, Induction of MHC-II+ phagocytic microglia after IL-33 treatment. Representative contour plots (f) and quantification (g) showing the proportions of MHC-II+ phagocytic microglia (that is, MHC-II+ CD11b+ cells) after IL-33 treatment (Con: n = 3 mice; 3 h: n = 3 mice; 8 h: n = 3 mice; 24 h: n = 4 mice; one-way ANOVA with Dunnett’s multiple comparisons test). h,i, Chemotactic microglia gradually express MHC-II after IL-33 treatment. Representative contour plots (h) and quantification (i) showing the proportions of MHC-II–expressing chemotactic microglia (that is, MHC-II + VCAM1 + CD11b+ cells) after IL-33 treatment (3 h: n = 4 mice; 8 h: n = 4 mice; 24 h: n = 4 mice; one-way ANOVA with Dunnett’s multiple comparisons test). All data are mean ± s.e.m.Source data. Image collected and cropped by CiteAb from the following open publication (https://pubmed.ncbi.nlm.nih.gov/37735240), licensed under a CC-BY license. Not internally tested by R&D Systems.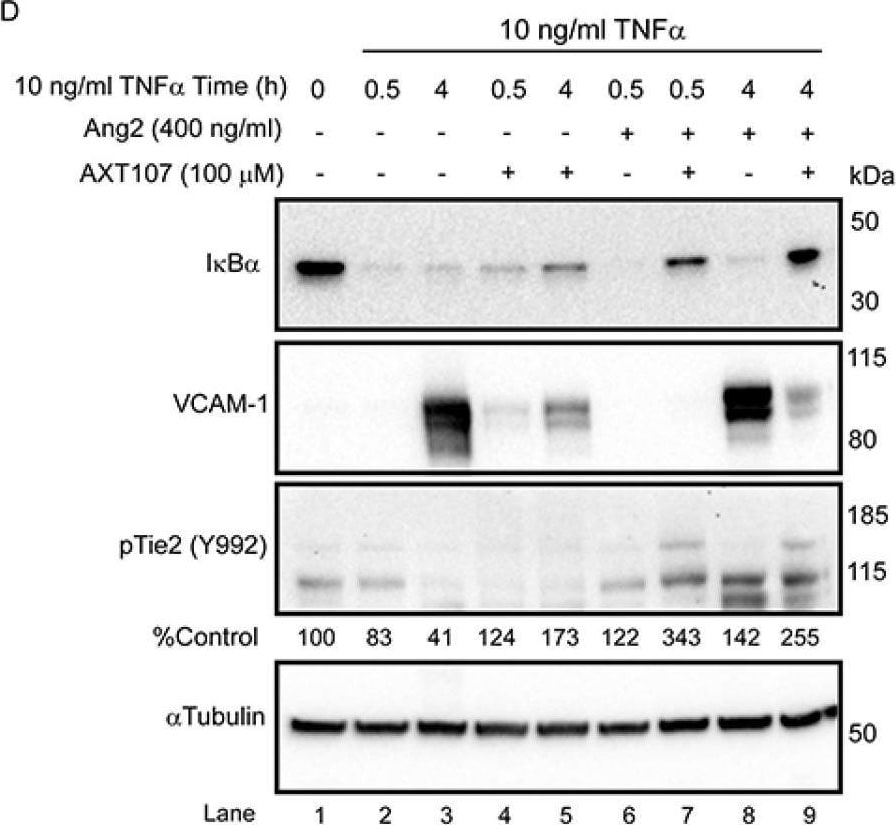
Detection of VCAM-1/CD106 by Western Blot
Tyrosine kinase with immunoglobulin and EGF-like domains (Tie2) phosphorylation contributes to the anti-inflammatory activity of AXT107. (A,B) Confluent HUVECs pre-treated with 100 µM AXT107 (B) or equivalent DMSO vehicle (A) as indicated for 90 min, followed by varying durations of 10 ng/mL TNF alpha, and analyzed by Western blot. I kappa B alpha and alpha Tubulin data are the same as presented in Figure 1A,B as a reference for inflammatory status but now include the addition of phospho-Akt (pAkt) (S473) and phospho-Tie2 (pTie2) (Y992). Given the weak staining of some pTie2 bands, densitometry analysis was performed for pTie2 and pAkt images with AXT107-treated samples, and the loading control-normalized results are presented below the corresponding image as percentages of the value from the untreated control (lane 1). (C) Data from Figure 1E now including staining pTie2 (Y992). I kappa B alpha data are retained as a reference for inflammatory status. (D) Western blots of confluent HUVECs pre-treated with 100 µM AXT107 or equivalent DMSO vehicle followed by 400 ng/mL angiopoietin 2 (Ang2) 15 min and/or 10 ng/mL TNF alpha for various times as indicated and stained for I kappa B alpha, VCAM-1, and pTie2 with alpha Tubulin as a loading control. Densitometry analysis of loading control-normalized pTie2 band intensity is indicated below the image as a percentage of the untreated control (lane 1). (E) Confluent HUVECs were treated with a control or Tie2 translation-blocking morpholino for 48 h followed by pre-treatment of AXT107 for 90 min and varying durations of treatment with 10 ng/mL TNF alpha. Samples were then stained by Western blot for I kappa B alpha and Tie2 with GAPDH as a loading control. Image collected and cropped by CiteAb from the following open publication (https://pubmed.ncbi.nlm.nih.gov/32708100), licensed under a CC-BY license. Not internally tested by R&D Systems.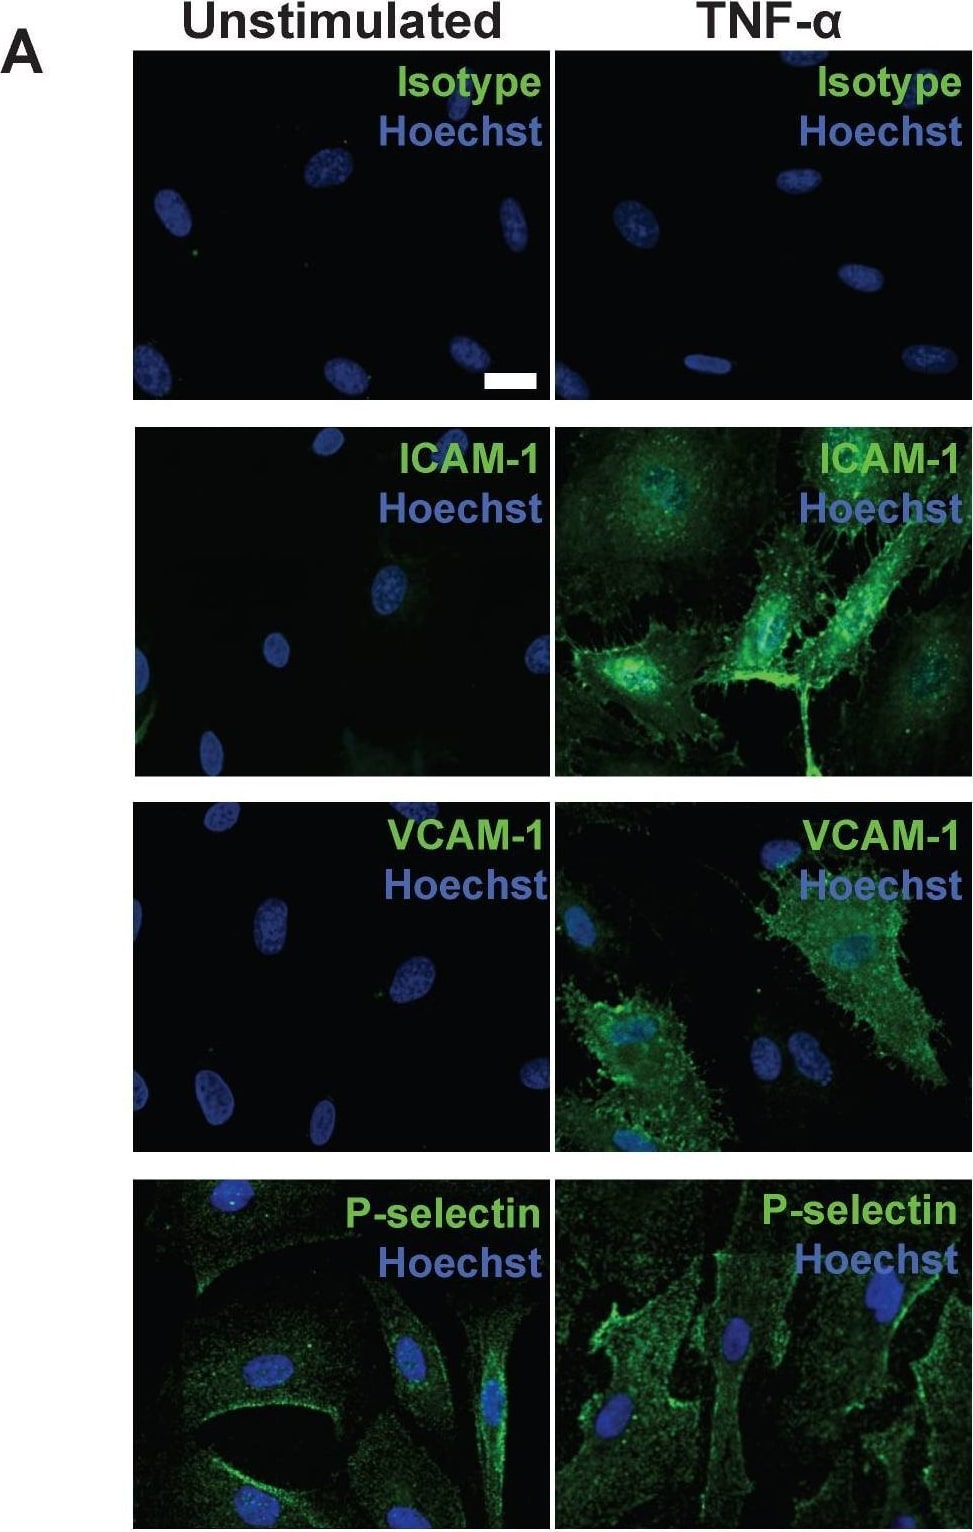
Detection of VCAM-1/CD106 by Immunocytochemistry/ Immunofluorescence
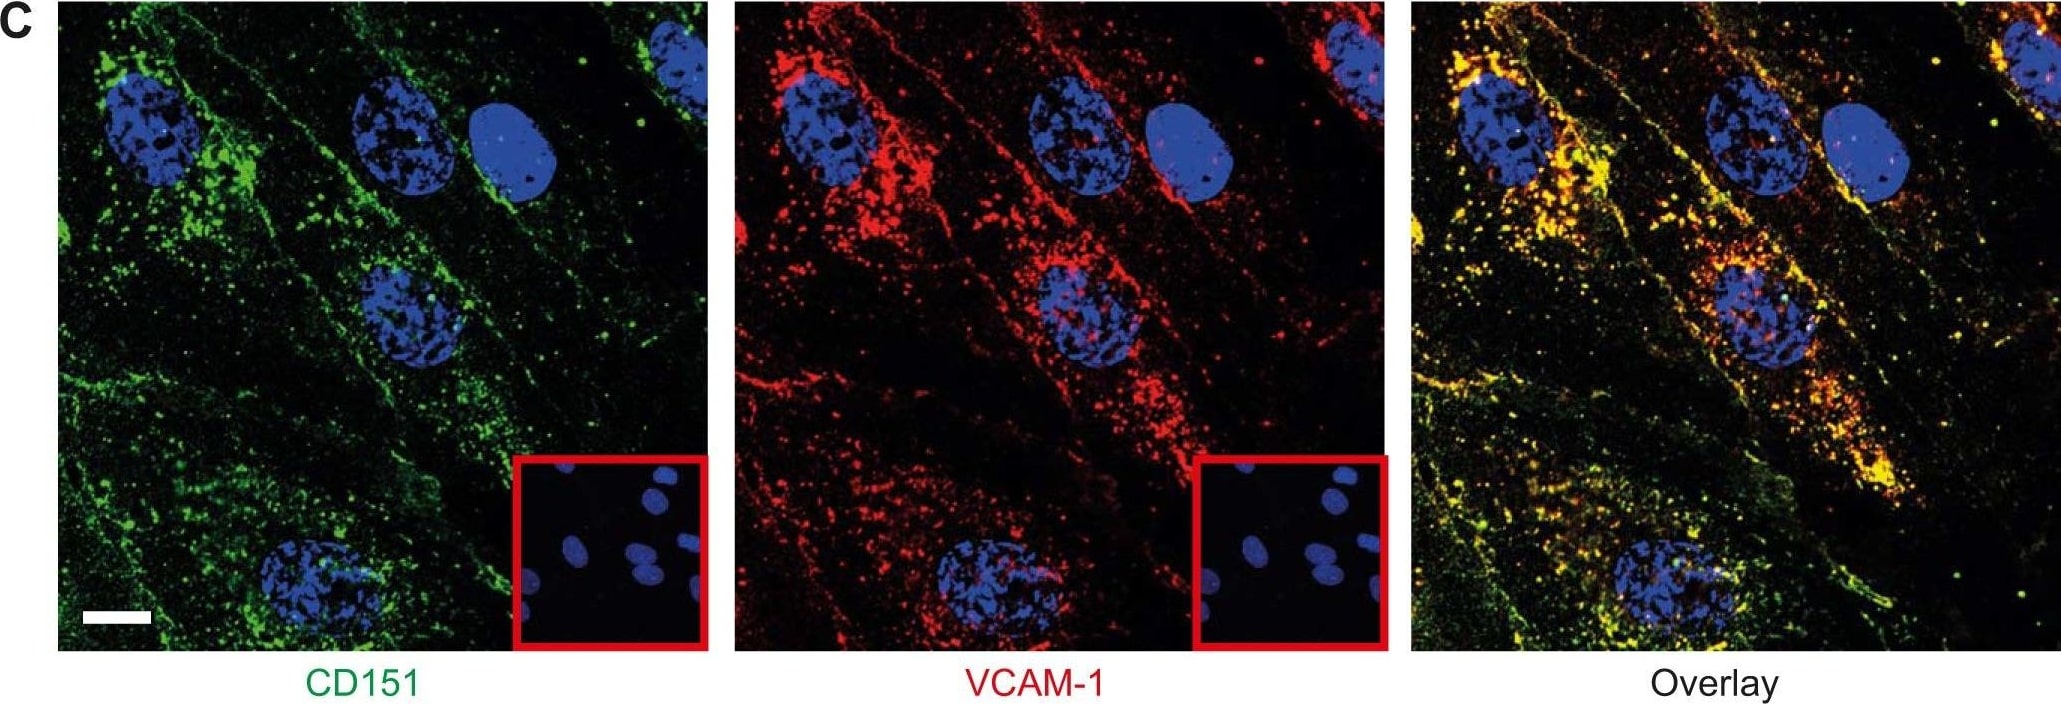
Following stimulation, coronary artery endothelial cells (CAEC) express adhesion molecules detectable via immuno-SERS imaging in single and multiplex formats. (A) Fluorescence images of immunohistochemical staining of ICAM-1, VCAM-1 and P-selectin on CAEC in unstimulated and 10 ng/mL TNF-alpha -stimulated conditions. Isotype control, ICAM-1, VCAM-1 and P-selectin staining shown in green; nuclei were counterstained using Hoechst 33342 (blue). (B) CAEC were stimulated with 10 ng/mL TNF-alpha for 24 h, fixed in acetone, and incubated with isotype control, anti-ICAM-1, anti-VCAM-1 or anti-P-selectin BFNP or (C) with all BFNP simultaneously before being subjected to SERS mapping. (D) Representative spectra from anti-ICAM-1 (purple), anti-VCAM-1 (red) and anti-P-selectin (blue) BFNP acquired from the color-matched circles in (C) are shown above their respective reference spectra. Optical images in (B-C) are darkfield images. Scale bars = 20 μm. Results are representative of 3 independent experiments. Image collected and cropped by CiteAb from the following open publication (https://pubmed.ncbi.nlm.nih.gov/30613292), licensed under a CC-BY license. Not internally tested by R&D Systems.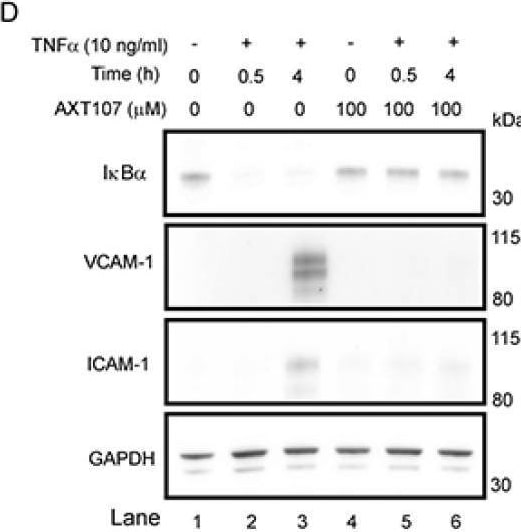
Detection of VCAM-1/CD106 by Western Blot
AXT107 regulates tumor necrosis factor alpha (TNF alpha ) signaling in endothelial cells. (A–D) Confluent human umbilical vein endothelial cells (HUVECs) (A–C) or microvascular endothelial cells (MECs) (D) pre-treated with 100 µM AXT107 or equivalent DMSO vehicle as indicated for 90 min, followed by varying durations of 10 ng/mL TNF alpha, and analyzed by Western blot. Targets included inhibitor of nuclear factor-kappa B (I kappa B alpha ), VCAM-1, ICAM-1, TNF receptor 1 (TNFR1), and TNFR2. alpha Tubulin or glyceraldehyde 3-phosphate dehydrogenase (GAPDH) is provided as the loading control. (E) Confluent HUVECs untreated (lane 1), pretreated with TNF alpha for 1 h followed by DMSO (lanes 2 and 3) or 100 µM AXT107 (lanes 5 and 6) for 30 min or 2 h, or pretreated with 100 µM AXT107 for 90 min followed by TNF alpha for 2 h (lane 4). Changes in I kappa B alpha were then measured by Western blot with GAPDH provided as a loading control. (F) Confluent HUVECs (Left) or MECs (Right) treated with TNF alpha and AXT107 as in (A–D) above and stained for TNFR1 or TNFR2. GAPDH is provided as a loading control. Image collected and cropped by CiteAb from the following open publication (https://pubmed.ncbi.nlm.nih.gov/32708100), licensed under a CC-BY license. Not internally tested by R&D Systems.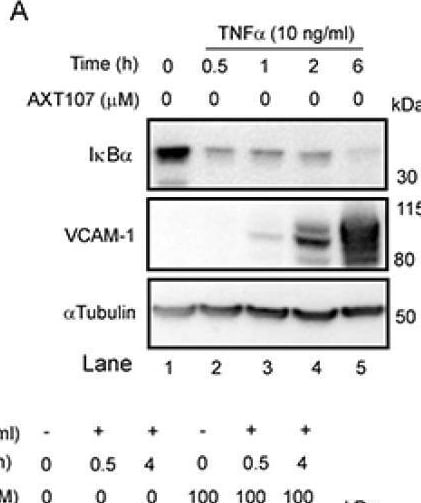
Detection of VCAM-1/CD106 by Western Blot
AXT107 regulates tumor necrosis factor alpha (TNF alpha ) signaling in endothelial cells. (A–D) Confluent human umbilical vein endothelial cells (HUVECs) (A–C) or microvascular endothelial cells (MECs) (D) pre-treated with 100 µM AXT107 or equivalent DMSO vehicle as indicated for 90 min, followed by varying durations of 10 ng/mL TNF alpha, and analyzed by Western blot. Targets included inhibitor of nuclear factor-kappa B (I kappa B alpha ), VCAM-1, ICAM-1, TNF receptor 1 (TNFR1), and TNFR2. alpha Tubulin or glyceraldehyde 3-phosphate dehydrogenase (GAPDH) is provided as the loading control. (E) Confluent HUVECs untreated (lane 1), pretreated with TNF alpha for 1 h followed by DMSO (lanes 2 and 3) or 100 µM AXT107 (lanes 5 and 6) for 30 min or 2 h, or pretreated with 100 µM AXT107 for 90 min followed by TNF alpha for 2 h (lane 4). Changes in I kappa B alpha were then measured by Western blot with GAPDH provided as a loading control. (F) Confluent HUVECs (Left) or MECs (Right) treated with TNF alpha and AXT107 as in (A–D) above and stained for TNFR1 or TNFR2. GAPDH is provided as a loading control. Image collected and cropped by CiteAb from the following open publication (https://pubmed.ncbi.nlm.nih.gov/32708100), licensed under a CC-BY license. Not internally tested by R&D Systems.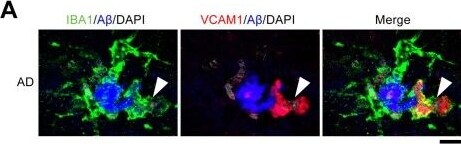
Detection of VCAM-1/CD106 by Immunohistochemistry
VCAM1+ microglia interact with amyloid-beta plaques in the brains of patients with Alzheimer’s disease.a,b, Representative images (a) and bar plot (b) showing the proportions of amyloid-beta (A beta ) plaque-associated VCAM1+ microglia in postmortem Alzheimer’s disease brain sections (n = 5 patients with Alzheimer’s disease; two-way ANOVA with Šidák’s multiple comparisons test). Arrowheads indicate the VCAM1+ microglia associated with plaque. Scale bar = 10 μm. All data are mean ± s.e.m.Source data. Image collected and cropped by CiteAb from the following open publication (https://pubmed.ncbi.nlm.nih.gov/37735240), licensed under a CC-BY license. Not internally tested by R&D Systems.Applications for Human VCAM-1/CD106 Antibody (BBIG-V1)
Adhesion Blockade
Immunocytochemistry
Sample: Immersion fixed HUVEC human umbilical vein endothelial cells, and immersion fixed HUVEC human umbilical vein endothelial cells activated with recombinant human TNF-alpha (Catalog # 210-TA). This antibody is not suitable for labeling formalin-fixed, paraffin-embedded tissue.
Immunoprecipitation
Sample: Radiolabelled activated HUVEC human umbilical vein endothelial cells, see our available Western blot detection antibodies
Western Blot
Sample: Recombinant Human VCAM‑1/CD106 (Catalog # 809-VR) under non-reducing conditions only
Reviewed Applications
Read 1 review rated 4 using BBA5 in the following applications:
Formulation, Preparation, and Storage
Purification
Reconstitution
Sterile PBS to a final concentration of 0.5 mg/mL.
Formulation
Shipping
Stability & Storage
- 12 months from date of receipt, -20 to -70 °C as supplied.
- 1 month, 2 to 8 °C under sterile conditions after reconstitution.
- 6 months, -20 to -70 °C under sterile conditions after reconstitution.
Calculators
Background: VCAM-1/CD106
Long Name
Alternate Names
Gene Symbol
Additional VCAM-1/CD106 Products
Product Documents for Human VCAM-1/CD106 Antibody (BBIG-V1)
Certificate of Analysis
To download a Certificate of Analysis, please enter a lot or batch number in the search box below.
Note: Certificate of Analysis not available for kit components.
Product Specific Notices for Human VCAM-1/CD106 Antibody (BBIG-V1)
For research use only
Related Research Areas
Citations for Human VCAM-1/CD106 Antibody (BBIG-V1)
 Powered by Bioz
Customer Reviews for Human VCAM-1/CD106 Antibody (BBIG-V1) (1)
Have you used Human VCAM-1/CD106 Antibody (BBIG-V1)?
Submit a review and receive an Amazon gift card!
$25/€18/£15/$25CAN/¥2500 for a review with an image
$10/€7/£6/$10CAN/¥1110 for a review without an image
Submit a review
-
Application: ImmunofluorescenceSample Tested: See PMID: 22740338Species: HumanVerified Customer | Posted 01/20/2015
There are no reviews that match your criteria.
Protocols
Find general support by application which include: protocols, troubleshooting, illustrated assays, videos and webinars.
- Appropriate Fixation of IHC/ICC Samples
- Cellular Response to Hypoxia Protocols
- ClariTSA™ Fluorophore Kits
- Detection & Visualization of Antibody Binding
- ICC Cell Smear Protocol for Suspension Cells
- ICC Immunocytochemistry Protocol Videos
- ICC for Adherent Cells
- Immunocytochemistry (ICC) Protocol
- Immunocytochemistry Troubleshooting
- Immunofluorescence of Organoids Embedded in Cultrex Basement Membrane Extract
- Immunohistochemistry (IHC) and Immunocytochemistry (ICC) Protocols
- Immunoprecipitation Protocol
- Preparing Samples for IHC/ICC Experiments
- Preventing Non-Specific Staining (Non-Specific Binding)
- Primary Antibody Selection & Optimization
- Protocol for VisUCyte™ HRP Polymer Detection Reagent
- Protocol for the Fluorescent ICC Staining of Cell Smears - Graphic
- Protocol for the Fluorescent ICC Staining of Cultured Cells on Coverslips - Graphic
- Protocol for the Preparation and Fluorescent ICC Staining of Cells on Coverslips
- Protocol for the Preparation and Fluorescent ICC Staining of Non-adherent Cells
- Protocol for the Preparation and Fluorescent ICC Staining of Stem Cells on Coverslips
- Protocol for the Preparation of a Cell Smear for Non-adherent Cell ICC - Graphic
- R&D Systems Quality Control Western Blot Protocol
- TUNEL and Active Caspase-3 Detection by IHC/ICC Protocol
- The Importance of IHC/ICC Controls
- Troubleshooting Guide: Western Blot Figures
- Western Blot Conditions
- Western Blot Protocol
- Western Blot Protocol for Cell Lysates
- Western Blot Troubleshooting
- Western Blot Troubleshooting Guide
- View all Protocols, Troubleshooting, Illustrated assays and Webinars
Associated Pathways