
Cathepsin D is a lysosomal aspartic protease of the pepsin family (4). Mouse Cathepsin D is synthesized as a precursor protein, consisting of a signal peptide (residues 1-20), a propeptide (residues 21-64), and a mature chain (residues 65-410) (1-3). It is expressed in most cells and over-expressed in breast cancer cells (5). It is a major enzyme in protein degradation in lysosomes, and also involved in the presentation of antigenic peptides. Mice deficient in this enzyme showed a progressive atrophy of the intestinal mucosa, a massive destruction of lymphoid organs, and a profound neuronal ceroid lipofucinosis, indicating that Cathepsin D is essential for proteolysis of proteins regulating cell growth and tissue homeostasis (6). Cathepsin D secreted from human prostate carcinoma cells is responsible for the generation of angiostatin, a potent endogeneous inhibitor of angiogenesis (6).

Scientific images may be resized, cropped, or adjusted for brightness or contrast for presentation purposes. These updates are limited to presentation and do not affect the underlying scientific interpretation of the data. Where available, additional source data may be provided upon request.
Key Product Details
Validated by
Species Reactivity
Validated:
Cited:
Applications
Validated:
Cited:
Label
Antibody Source
Product Specifications
Immunogen
Ile21-Leu410
Accession # Q3UCD9
Specificity
Clonality
Host
Isotype
Scientific Data Images for Mouse Cathepsin D Antibody
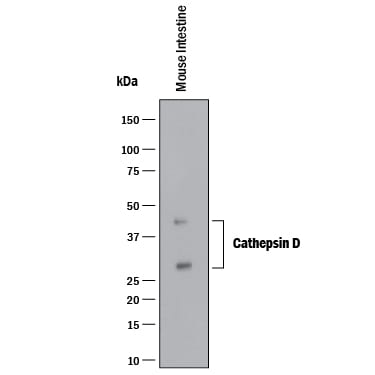
Detection of Mouse Cathepsin D by Western Blot.
Western blot shows lysate of mouse intestine tissue. PVDF membrane was probed with 1 µg/mL of Goat Anti-Mouse Cathepsin D Antigen Affinity-purified Polyclonal Antibody (Catalog # AF1029) followed by HRP-conjugated Anti-Goat IgG Secondary Antibody (HAF017). Specific bands were detected for Cathepsin D at approximately 28 and 45 kDa (as indicated). This experiment was conducted under reducing conditions and using Immunoblot Buffer Group 1.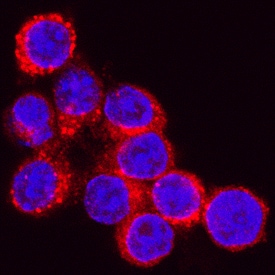
Cathepsin D in RAW 264.7 Mouse Cell Line.
Cathepsin D was detected in immersion fixed RAW 264.7 mouse monocyte/macrophage cell line using Goat Anti-Mouse Cathepsin D Antigen Affinity-purified Polyclonal Antibody (Catalog # AF1029) at 5 µg/mL for 3 hours at room temperature. Cells were stained using the NorthernLights™ 557-conjugated Anti-Goat IgG Secondary Antibody (red; NL001) and counterstained with DAPI (blue). Specific staining was localized to lysosomes. View our protocol for Fluorescent ICC Staining of Cells on Coverslips.
Cathepsin D in Mouse Intestine.
Cathepsin D was detected in perfusion fixed frozen sections of mouse intestine using 15 µg/mL Goat Anti-Mouse Cathepsin D Antigen Affinity-purified Polyclonal Antibody (Catalog # AF1029) overnight at 4 °C. Tissue was stained with the Anti-Goat HRP-DAB Cell & Tissue Staining Kit (brown; CTS008) and counter-stained with hematoxylin (blue). Specific labeling was localized to epithelial cells in intestinal villi. View our protocol for Chromogenic IHC Staining of Frozen Tissue Sections.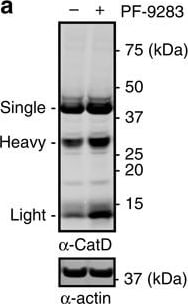
Detection of Human Cathepsin D by Western Blot
Chronic treatment with BACE1 inhibitors causes accumulation of CatD.(a) Representative western blot of brain homogenates prepared from mice dosed daily for 30 days with PF-9283 (80 mg kg−1) showed increased levels of CatD heavy and light chains, but not the CatD single chain, compared with a vehicle control. Data are presented as mean (normalized to actin)±s.e.m.; n=5 (PF-9283) and n=6 (veh) per group. (b) ELISA of live ARPE-19 cells incubated with BACE1 inhibitors for 7 days showed accumulation of CatD; the extent of accumulation was consistent with cellular CatD IC50 values (Supplementary Table 4). Data are presented as mean±s.e.m. for three independent experiments. (c) Proteomic analysis of RPE tissue prepared from rats dosed daily for 14 days with 80 mg kg−1 PF-9283. Peptide spectral matches (PSM) of 11 of 391 identified proteins were changed more than 1.5-fold (P<0.01, red symbols, see also Supplementary Table 5) compared with vehicle controls including a 1.7-fold increase in CatD (***P=0.0002). Average PSM were calculated from six LC-MS runs consisting of two technical replicates of n=3 RPE tissues per group. For a–c, significant differences were determined using a two-tailed t-test; *P<0.05, **P<0.01, ***P<0.001. Image collected and cropped by CiteAb from the following open publication (https://pubmed.ncbi.nlm.nih.gov/27727204), licensed under a CC-BY license. Not internally tested by R&D Systems.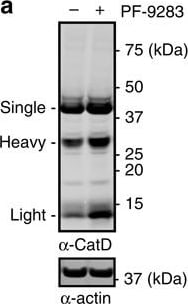
Detection of Human Cathepsin D by Western Blot
Chronic treatment with BACE1 inhibitors causes accumulation of CatD.(a) Representative western blot of brain homogenates prepared from mice dosed daily for 30 days with PF-9283 (80 mg kg−1) showed increased levels of CatD heavy and light chains, but not the CatD single chain, compared with a vehicle control. Data are presented as mean (normalized to actin)±s.e.m.; n=5 (PF-9283) and n=6 (veh) per group. (b) ELISA of live ARPE-19 cells incubated with BACE1 inhibitors for 7 days showed accumulation of CatD; the extent of accumulation was consistent with cellular CatD IC50 values (Supplementary Table 4). Data are presented as mean±s.e.m. for three independent experiments. (c) Proteomic analysis of RPE tissue prepared from rats dosed daily for 14 days with 80 mg kg−1 PF-9283. Peptide spectral matches (PSM) of 11 of 391 identified proteins were changed more than 1.5-fold (P<0.01, red symbols, see also Supplementary Table 5) compared with vehicle controls including a 1.7-fold increase in CatD (***P=0.0002). Average PSM were calculated from six LC-MS runs consisting of two technical replicates of n=3 RPE tissues per group. For a–c, significant differences were determined using a two-tailed t-test; *P<0.05, **P<0.01, ***P<0.001. Image collected and cropped by CiteAb from the following open publication (https://pubmed.ncbi.nlm.nih.gov/27727204), licensed under a CC-BY license. Not internally tested by R&D Systems.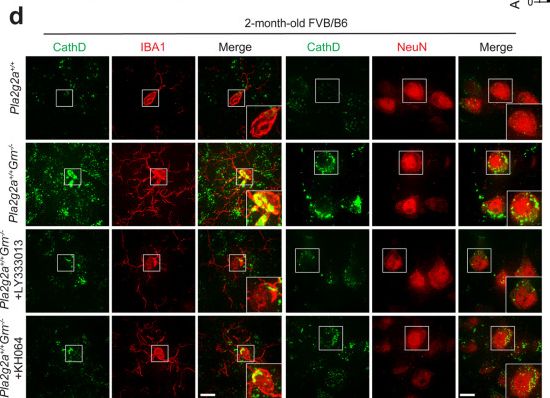
Detection of Cathepsin D by Immunocytochemistry/ Immunofluorescence
sPLA2 inhibitor treatment rescues PGRN deficiency phenotypes in mice. 5-week-old Pla2g2a+/+Grn+/+ and Pla2g2a+/+Grn−/− mice in FVB/B6 mixed background were treated with corn oil control or sPLA2 inhibitors, LY333013 or KH064 for 3 weeks. (a) Measurement of total sPLA2 activity in the serum and cortical lysates from untreated and LY333013 or KH064-treated mice. Data are presented as mean ± SEM from five mice per group (n = 5). *, p < 0.05; **, p < 0.01, Student’s t-test. (b) Brain sections were immunostained with anti-GFAP, CD68, and IBA1 antibodies, and representative images from the cortex region were shown (Scale bar = 100 μm). Another set of brain sections was stained with Hoechst and auto-fluorescent lipofuscin signals (red) in the thalamus region were imaged (scale bar = 10 μm). (c) Quantification of GFAP, CD68, and IBA1 levels and auto-fluorescent lipofuscin signals for the experiment in (b). Data are presented as mean ± SEM from five mice per group (n = 5). 3 sections were analyzed for each mouse brain. *, p < 0.05; **, p < 0.01, Student’s t-test. (d) Brain sections were immunostained with anti-CathD, NeuN, and IBA1 antibodies, and representative images from the cortex region were shown (Scale bar = 10 μm). (e) CathD signals in IBA1-positive microglia and NeuN-positive neurons were quantified. 10–20 confocal images were randomly captured from each brain section. Ten to twenty microglia and fifty to sixty neurons were quantified per section. 3 sections were analyzed for each mouse brain. Data are presented as mean ± SEM from 3–4 mice per group (n = 3–4). *, p < 0.05; **, p < 0.01, Student’s t-test Image collected and cropped by CiteAb from the following open publication (https://pubmed.ncbi.nlm.nih.gov/40528203), licensed under a CC-BY license. Not internally tested by R&D Systems.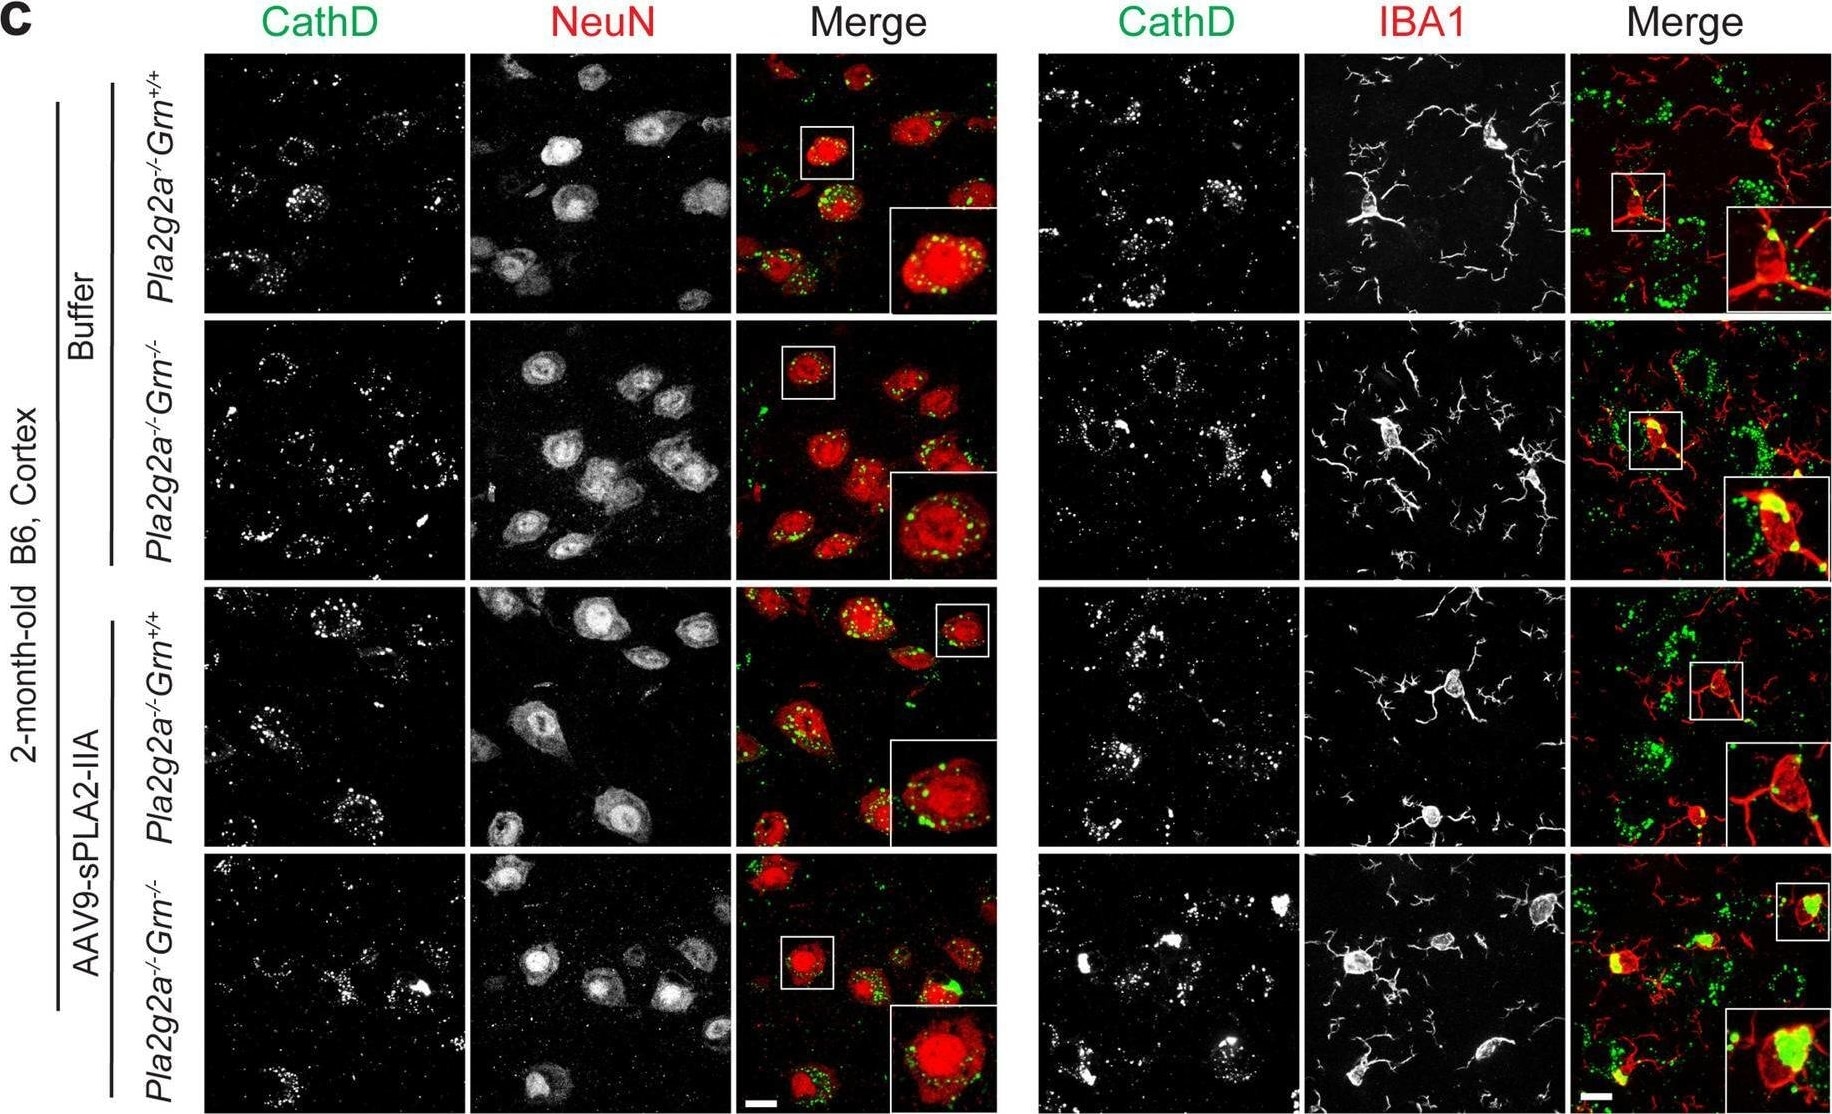
Detection of Cathepsin D by Immunocytochemistry/ Immunofluorescence
AAV9-mediated overexpression of sPLA2-IIA leads to lipofuscin accumulation and lysosomal enlargement in microglia in 2-month-old B6 Grn−/− mice. B6 WT (Pla2g2−/−Grn+/+) and Grn−/− (Pla2g2a−/−Grn−/−) pups at postnatal day (P0) were injected with AAV9-sPLA2-IIA or the buffer control, and the mice were collected at 2 months old. (a) Brain sections were stained with NeuN and IBA1, and auto-fluorescent lipofuscin signals (blue) in the cortex region were imaged (scale bar = 10 μm). (b) Quantification of autofluorescent lipofuscin signals in the cortex. Data are presented as mean ± SEM from three to five mice per group (n = 3–5). Three sections were analyzed for each mouse brain. *, p < 0.05; **, p < 0.01; ****, p < 0.0001, Student’s t-test. (c) Brain sections were immunostained with anti-CathD, NeuN, and IBA1 antibodies, and representative images from the cortex region were shown (Scale bar = 10 μm). (d) CathD signals in IBA1-positive microglia and NeuN-positive neurons were quantified. 10–20 confocal images were randomly captured from each brain section. Fifteen to thirty microglia and fifty to sixty neurons were quantified per Sect. 3 sections were analyzed for each mouse brain. Data are presented as mean ± SEM from 3–5 mice per group (n = 3–5). *, p < 0.05; **, p < 0.01; ****, p < 0.0001, Student’s t-test Image collected and cropped by CiteAb from the following open publication (https://pubmed.ncbi.nlm.nih.gov/40528203), licensed under a CC-BY license. Not internally tested by R&D Systems.Applications for Mouse Cathepsin D Antibody
Immunocytochemistry
Sample: Immersion fixed RAW264.7 mouse monocyte/macrophage cell line
Immunohistochemistry
Sample: Perfusion fixed frozen sections of mouse intestine
Immunoprecipitation
Sample: Conditioned cell culture medium spiked with Recombinant Mouse Cathepsin D (Catalog # 1029-AS), see our available Western blot detection antibodies
Western Blot
Sample: Mouse intestine tissue
Reviewed Applications
Read 2 reviews rated 5 using AF1029 in the following applications:
Formulation, Preparation, and Storage
Purification
Reconstitution
Reconstitute at 0.2 mg/mL in sterile PBS. For liquid material, refer to CoA for concentration.
Formulation
Shipping
Stability & Storage
- 12 months from date of receipt, -20 to -70 °C as supplied.
- 1 month, 2 to 8 °C under sterile conditions after reconstitution.
- 6 months, -20 to -70 °C under sterile conditions after reconstitution.
Calculators
Background: Cathepsin D
References
- Diedrich, et al. (1990) Nucl. Acid Res. 18:7184.
- Grusby, et al. (1990) Nucl. Acid Res. 18:4008.
- Hetman, et al. (1994) DNA Cell Biol. 13:419.
- Conner, (2004) in Handbook of Proteolytic Enzymes (Barrett, et al. eds) Elsevier Academic Press, San Diego, p. 43.
- Rochefort, et al. (2000) Clin. Chim. Acta. 291:157.
- Tsukuba, et al. (2000) Mol. Cells 10:601.
Alternate Names
Gene Symbol
UniProt
Additional Cathepsin D Products
Product Documents for Mouse Cathepsin D Antibody
Certificate of Analysis
To download a Certificate of Analysis, please enter a lot or batch number in the search box below.
Note: Certificate of Analysis not available for kit components.
Product Specific Notices for Mouse Cathepsin D Antibody
For research use only
Citations for Mouse Cathepsin D Antibody
 Powered by Bioz
Customer Reviews for Mouse Cathepsin D Antibody (2)
Have you used Mouse Cathepsin D Antibody?
Submit a review and receive an Amazon gift card!
$25/€18/£15/$25CAN/¥2500 for a review with an image
$10/€7/£6/$10CAN/¥1110 for a review without an image
Submit a review
Customer Images
-
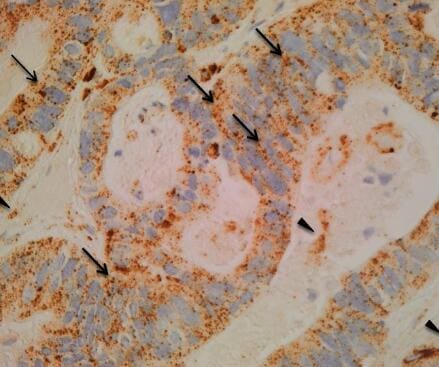
Application: ImmunohistochemistrySample Tested: Colon tissueSpecies: MouseVerified Customer | Posted 08/05/20201:200 dilution

-
Application: Flow CytometrySample Tested: Bladder tissueSpecies: HumanVerified Customer | Posted 10/31/2017
There are no reviews that match your criteria.
Protocols
Find general support by application which include: protocols, troubleshooting, illustrated assays, videos and webinars.
- Antigen Retrieval Protocol (PIER)
- Antigen Retrieval for Frozen Sections Protocol
- Appropriate Fixation of IHC/ICC Samples
- Cellular Response to Hypoxia Protocols
- Chromogenic IHC Staining of Formalin-Fixed Paraffin-Embedded (FFPE) Tissue Protocol
- Chromogenic Immunohistochemistry Staining of Frozen Tissue
- ClariTSA™ Fluorophore Kits
- Detection & Visualization of Antibody Binding
- Fluorescent IHC Staining of Frozen Tissue Protocol
- Graphic Protocol for Heat-induced Epitope Retrieval
- Graphic Protocol for the Preparation and Fluorescent IHC Staining of Frozen Tissue Sections
- Graphic Protocol for the Preparation and Fluorescent IHC Staining of Paraffin-embedded Tissue Sections
- Graphic Protocol for the Preparation of Gelatin-coated Slides for Histological Tissue Sections
- ICC Cell Smear Protocol for Suspension Cells
- ICC Immunocytochemistry Protocol Videos
- ICC for Adherent Cells
- IHC Sample Preparation (Frozen sections vs Paraffin)
- Immunocytochemistry (ICC) Protocol
- Immunocytochemistry Troubleshooting
- Immunofluorescence of Organoids Embedded in Cultrex Basement Membrane Extract
- Immunofluorescent IHC Staining of Formalin-Fixed Paraffin-Embedded (FFPE) Tissue Protocol
- Immunohistochemistry (IHC) and Immunocytochemistry (ICC) Protocols
- Immunohistochemistry Frozen Troubleshooting
- Immunohistochemistry Paraffin Troubleshooting
- Immunoprecipitation Protocol
- Preparing Samples for IHC/ICC Experiments
- Preventing Non-Specific Staining (Non-Specific Binding)
- Primary Antibody Selection & Optimization
- Protocol for Heat-Induced Epitope Retrieval (HIER)
- Protocol for Making a 4% Formaldehyde Solution in PBS
- Protocol for VisUCyte™ HRP Polymer Detection Reagent
- Protocol for the Fluorescent ICC Staining of Cell Smears - Graphic
- Protocol for the Fluorescent ICC Staining of Cultured Cells on Coverslips - Graphic
- Protocol for the Preparation & Fixation of Cells on Coverslips
- Protocol for the Preparation and Chromogenic IHC Staining of Frozen Tissue Sections
- Protocol for the Preparation and Chromogenic IHC Staining of Frozen Tissue Sections - Graphic
- Protocol for the Preparation and Chromogenic IHC Staining of Paraffin-embedded Tissue Sections
- Protocol for the Preparation and Chromogenic IHC Staining of Paraffin-embedded Tissue Sections - Graphic
- Protocol for the Preparation and Fluorescent ICC Staining of Cells on Coverslips
- Protocol for the Preparation and Fluorescent ICC Staining of Non-adherent Cells
- Protocol for the Preparation and Fluorescent ICC Staining of Stem Cells on Coverslips
- Protocol for the Preparation and Fluorescent IHC Staining of Frozen Tissue Sections
- Protocol for the Preparation and Fluorescent IHC Staining of Paraffin-embedded Tissue Sections
- Protocol for the Preparation of Gelatin-coated Slides for Histological Tissue Sections
- Protocol for the Preparation of a Cell Smear for Non-adherent Cell ICC - Graphic
- R&D Systems Quality Control Western Blot Protocol
- TUNEL and Active Caspase-3 Detection by IHC/ICC Protocol
- The Importance of IHC/ICC Controls
- Troubleshooting Guide: Immunohistochemistry
- Troubleshooting Guide: Western Blot Figures
- Western Blot Conditions
- Western Blot Protocol
- Western Blot Protocol for Cell Lysates
- Western Blot Troubleshooting
- Western Blot Troubleshooting Guide
- View all Protocols, Troubleshooting, Illustrated assays and Webinars
Associated Pathways
