Rat IL-1 beta/IL-1F2 Antibody
R&D Systems | Catalog # AF-501-NA


Scientific images may be resized, cropped, or adjusted for brightness or contrast for presentation purposes. These updates are limited to presentation and do not affect the underlying scientific interpretation of the data. Where available, additional source data may be provided upon request.
Key Product Details
Validated by
Species Reactivity
Validated:
Cited:
Applications
Validated:
Cited:
Label
Antibody Source
Product Specifications
Immunogen
Val117-Ser268
Accession # Q63264
Specificity
Clonality
Host
Isotype
Endotoxin Level
Scientific Data Images for Rat IL-1 beta/IL-1F2 Antibody
Cell Proliferation Induced by IL‑1 beta /IL‑1F2 and Neutralization by Rat IL‑1 beta /IL‑1F2 Antibody.
Recombinant Rat IL-1 beta /IL-1F2 (Catalog # 501-RL) stimulates proliferation in the the D10.G4.1 mouse helper T cell line in a dose-dependent manner (orange line). Proliferation elicited by Recombinant Rat IL-1 beta /IL-1F2 (10 ng/mL) is neutralized (green line) by increasing concentrations of Rat IL-1 beta /IL-1F2 Antigen Affinity-purified Polyclonal Antibody (Catalog # AF-501-NA). The ND50 is typically 2-10 µg/mL.
IL‑1 beta /IL‑1F2 in Rat Splenocytes.
IL‑1 beta /IL‑1F2 was detected in immersion fixed LPS-stimulated rat splenocytes using 5 µg/mL Rat IL‑1 beta /IL‑1F2 Antigen Affinity-purified Polyclonal Antibody (Catalog # AF‑501‑NA) for 3 hours at room temperature. Cells were stained with the NorthernLights™ 557-conjugated Anti-Goat IgG Secondary Antibody (red; Catalog # NL001) and counterstained (green). View our protocol for Fluorescent ICC Staining of Non-adherent Cells.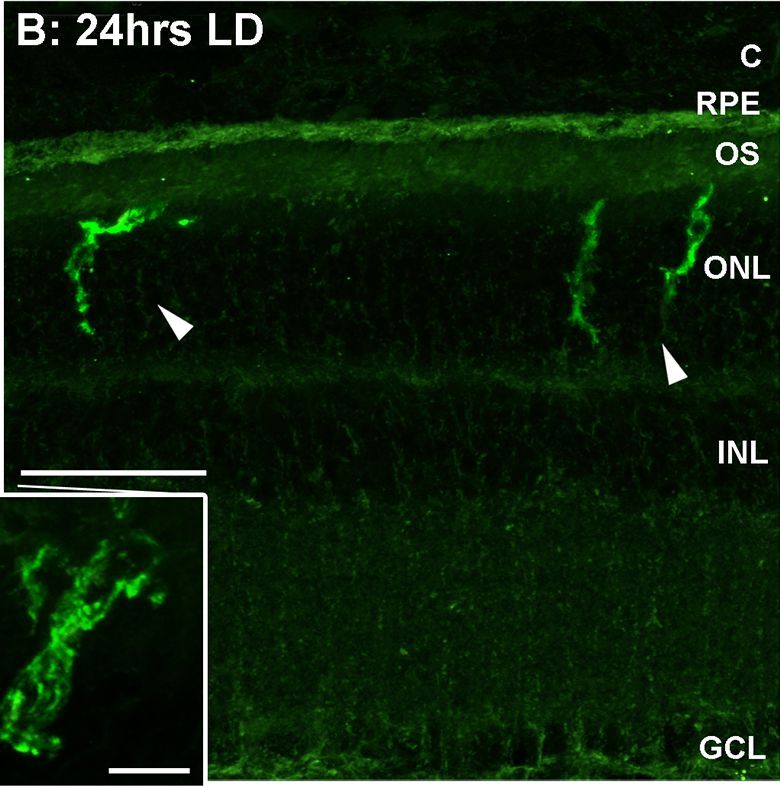
Detection of Porcine IL-1 beta/IL-1F2 by Immunocytochemistry/ Immunofluorescence
Spatiotemporal analysis of retinal Il-1 beta protein levels following LD.A-G: Immunohistochemical assessment of Il-1 beta expression (green) in retinal cryosections over the course of LD. A: Immunoreactivity (IR) for Il-1 beta protein was not observed in dim-reared animals. B-D: Il-1 beta -IR was present among ramified nuclei situated within the ONL and OS (arrowheads) immediately following exposure to 24hrs LD. E-F: Il-1 beta -IR co-localised with IBA1+ cells (red) situated in the ONL/OS, though was not apparent in IBA1+ cells outside the vicinity of the ONL (asterisks). G-H: Il-1 beta -expressing cells (H, arrowheads) did not show any discernible IR for the M2 marker CD206 (red). I: Negative control sections, in which the primary antibody was omitted, did not show any resemblance to the IR for Il-1 beta evidenced in C-D at 24hrs LD. J: ELISA for Il-1 beta protein indicated an increased abundance of the protein immediately after 24hrs LD (P<0.05), and which was virtually undetectable at all other time points. C, choroid; GCL, ganglion cell layer; INL, inner nuclear layer; IHC, immunohistochemistry; ONL, outer nuclear layer; OS, outer segments; RPE, retinal pigment epithelium. The trend in ELISA protein levels was significant by ANOVA (P < 0.05); N = 3 for each timepoint. Image collected and cropped by CiteAb from the following open publication (https://pubmed.ncbi.nlm.nih.gov/26630454), licensed under a CC-BY license. Not internally tested by R&D Systems.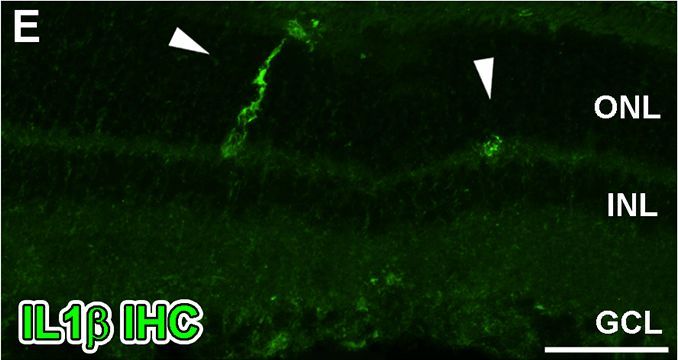
Detection of Porcine IL-1 beta/IL-1F2 by Immunocytochemistry/ Immunofluorescence
Spatiotemporal analysis of retinal Il-1 beta protein levels following LD.A-G: Immunohistochemical assessment of Il-1 beta expression (green) in retinal cryosections over the course of LD. A: Immunoreactivity (IR) for Il-1 beta protein was not observed in dim-reared animals. B-D: Il-1 beta -IR was present among ramified nuclei situated within the ONL and OS (arrowheads) immediately following exposure to 24hrs LD. E-F: Il-1 beta -IR co-localised with IBA1+ cells (red) situated in the ONL/OS, though was not apparent in IBA1+ cells outside the vicinity of the ONL (asterisks). G-H: Il-1 beta -expressing cells (H, arrowheads) did not show any discernible IR for the M2 marker CD206 (red). I: Negative control sections, in which the primary antibody was omitted, did not show any resemblance to the IR for Il-1 beta evidenced in C-D at 24hrs LD. J: ELISA for Il-1 beta protein indicated an increased abundance of the protein immediately after 24hrs LD (P<0.05), and which was virtually undetectable at all other time points. C, choroid; GCL, ganglion cell layer; INL, inner nuclear layer; IHC, immunohistochemistry; ONL, outer nuclear layer; OS, outer segments; RPE, retinal pigment epithelium. The trend in ELISA protein levels was significant by ANOVA (P < 0.05); N = 3 for each timepoint. Image collected and cropped by CiteAb from the following open publication (https://pubmed.ncbi.nlm.nih.gov/26630454), licensed under a CC-BY license. Not internally tested by R&D Systems.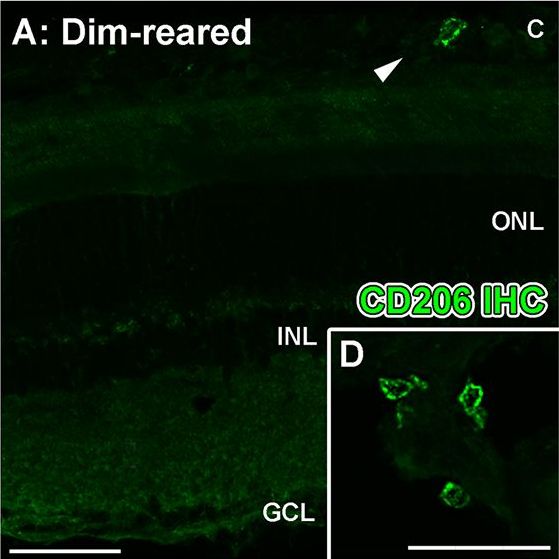
Detection of Porcine IL-1 beta/IL-1F2 by Immunocytochemistry/ Immunofluorescence
Spatiotemporal analysis of retinal CD206 protein levels following LD.A-L: investigation of CD206 immunoreactivity (IR, green) in retinal cryosections over the course of LD. A-B: In dim-reared animals, immunoreactivity (IR) for Il-1 beta protein was occasionally observed within nuclei (arrowheads) amongst the choroid (A) and ciliary body (B). C-E: Following 24hrs LD, CD206+ nuclei appeared from the ciliary body (C-D, arrowheads) and among the superficial retinal vasculature (E, arrowhead) F: At 24hrs LD, CD206+ cells were also more abundant within the ciliary body (arrowheads). G-I: There was increased abundance of CD206+ nuclei among optic nerve head (G-H) and superficial retinal vasculature (I) after 3 days post-exposure (arrowheads), compared to 24hrs LD. J: CD206+ cells were occasionally found accumulating within the choroid at 7 days post-exposure (arrowheads). K-L: All IR for CD206 was found to correlate with circular IBA1+ cells (red). M-N: CD206-expressing cells (N, arrowhead) did not show any detectable IR for the M1 marker Il-1 beta (red). O: Quantification of CD206 protein levels in retinas via ELISA. At 3 and 7 days post-exposure, the levels of CD206 protein were significantly higher compared to dim-reared controls (P<0.05). Progressive increases were observed during the post-exposure period, though this was not significant between 3 and 7 days (P>0.05). C, choroid; GCL, ganglion cell layer; INL, inner nuclear layer; IPL, inner plexiform layer; IHC, immunohistochemistry; ONL, outer nuclear layer; OS, outer segments; RPE, retinal pigment epithelium. The trend in ELISA protein levels was significant by ANOVA (P < 0.05); N = 3 for each timepoint. Image collected and cropped by CiteAb from the following open publication (https://pubmed.ncbi.nlm.nih.gov/26630454), licensed under a CC-BY license. Not internally tested by R&D Systems.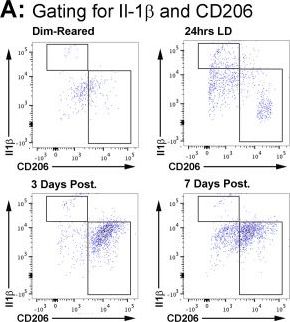
Detection of Porcine IL-1 beta/IL-1F2 by Flow Cytometry
Correlation of CD206 and Il-1 beta immunolabelling within the CD11b+ macrophage population following LD.A: Representative flow cytometry plots examine CD206+ and Il1b+ cell counts within the CD11b population following light damage. For the most part, Il-1 beta and CD206 cells occupied mutually distinct subsets within the population CD11b cells. B: Quantification of Il-1 beta +/CD206- and CD206+/Il-1 beta - cells as percentage of the CD11b+ population following LD. There was a sharp increase in the proportion of Il-1 beta +/CD206- cells immediately following 24hrs LD (P<0.05), though this then decreased dramatically afterward and was similar to control samples by 7 days (P>0.05). For CD206+/Il-1 beta - cells, there was no change in their proportion at 24hrs LD (P>0.05). At 3 days post-exposure however the proportion of CD206+/Il-1 beta - cells had tripled (P<0.05), though this was then reduced to near control proportions by 7 days post-exposure (P<0.05). The trend of both Il-1 beta +/CD206- and CD206+/Il-1 beta - cells across the time course were significant by ANOVA (P < 0.05); N = 5 for each timepoint. Image collected and cropped by CiteAb from the following open publication (https://pubmed.ncbi.nlm.nih.gov/26630454), licensed under a CC-BY license. Not internally tested by R&D Systems.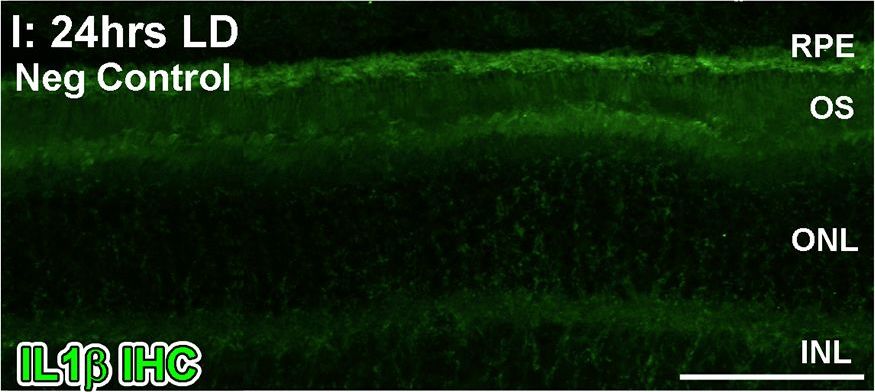
Detection of Porcine IL-1 beta/IL-1F2 by Immunocytochemistry/ Immunofluorescence
Spatiotemporal analysis of retinal Il-1 beta protein levels following LD.A-G: Immunohistochemical assessment of Il-1 beta expression (green) in retinal cryosections over the course of LD. A: Immunoreactivity (IR) for Il-1 beta protein was not observed in dim-reared animals. B-D: Il-1 beta -IR was present among ramified nuclei situated within the ONL and OS (arrowheads) immediately following exposure to 24hrs LD. E-F: Il-1 beta -IR co-localised with IBA1+ cells (red) situated in the ONL/OS, though was not apparent in IBA1+ cells outside the vicinity of the ONL (asterisks). G-H: Il-1 beta -expressing cells (H, arrowheads) did not show any discernible IR for the M2 marker CD206 (red). I: Negative control sections, in which the primary antibody was omitted, did not show any resemblance to the IR for Il-1 beta evidenced in C-D at 24hrs LD. J: ELISA for Il-1 beta protein indicated an increased abundance of the protein immediately after 24hrs LD (P<0.05), and which was virtually undetectable at all other time points. C, choroid; GCL, ganglion cell layer; INL, inner nuclear layer; IHC, immunohistochemistry; ONL, outer nuclear layer; OS, outer segments; RPE, retinal pigment epithelium. The trend in ELISA protein levels was significant by ANOVA (P < 0.05); N = 3 for each timepoint. Image collected and cropped by CiteAb from the following open publication (https://pubmed.ncbi.nlm.nih.gov/26630454), licensed under a CC-BY license. Not internally tested by R&D Systems.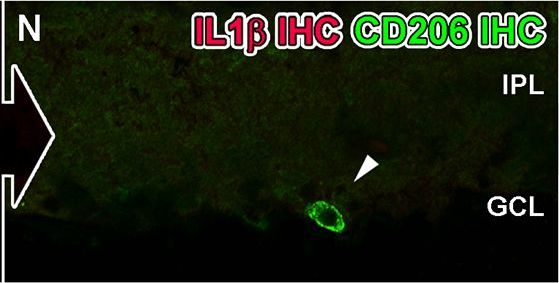
Detection of Porcine IL-1 beta/IL-1F2 by Immunocytochemistry/ Immunofluorescence
Spatiotemporal analysis of retinal CD206 protein levels following LD.A-L: investigation of CD206 immunoreactivity (IR, green) in retinal cryosections over the course of LD. A-B: In dim-reared animals, immunoreactivity (IR) for Il-1 beta protein was occasionally observed within nuclei (arrowheads) amongst the choroid (A) and ciliary body (B). C-E: Following 24hrs LD, CD206+ nuclei appeared from the ciliary body (C-D, arrowheads) and among the superficial retinal vasculature (E, arrowhead) F: At 24hrs LD, CD206+ cells were also more abundant within the ciliary body (arrowheads). G-I: There was increased abundance of CD206+ nuclei among optic nerve head (G-H) and superficial retinal vasculature (I) after 3 days post-exposure (arrowheads), compared to 24hrs LD. J: CD206+ cells were occasionally found accumulating within the choroid at 7 days post-exposure (arrowheads). K-L: All IR for CD206 was found to correlate with circular IBA1+ cells (red). M-N: CD206-expressing cells (N, arrowhead) did not show any detectable IR for the M1 marker Il-1 beta (red). O: Quantification of CD206 protein levels in retinas via ELISA. At 3 and 7 days post-exposure, the levels of CD206 protein were significantly higher compared to dim-reared controls (P<0.05). Progressive increases were observed during the post-exposure period, though this was not significant between 3 and 7 days (P>0.05). C, choroid; GCL, ganglion cell layer; INL, inner nuclear layer; IPL, inner plexiform layer; IHC, immunohistochemistry; ONL, outer nuclear layer; OS, outer segments; RPE, retinal pigment epithelium. The trend in ELISA protein levels was significant by ANOVA (P < 0.05); N = 3 for each timepoint. Image collected and cropped by CiteAb from the following open publication (https://pubmed.ncbi.nlm.nih.gov/26630454), licensed under a CC-BY license. Not internally tested by R&D Systems.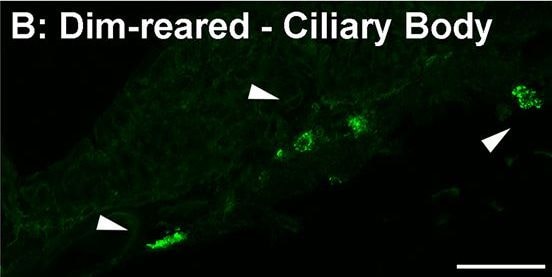
Detection of Porcine IL-1 beta/IL-1F2 by Immunocytochemistry/ Immunofluorescence
Spatiotemporal analysis of retinal CD206 protein levels following LD.A-L: investigation of CD206 immunoreactivity (IR, green) in retinal cryosections over the course of LD. A-B: In dim-reared animals, immunoreactivity (IR) for Il-1 beta protein was occasionally observed within nuclei (arrowheads) amongst the choroid (A) and ciliary body (B). C-E: Following 24hrs LD, CD206+ nuclei appeared from the ciliary body (C-D, arrowheads) and among the superficial retinal vasculature (E, arrowhead) F: At 24hrs LD, CD206+ cells were also more abundant within the ciliary body (arrowheads). G-I: There was increased abundance of CD206+ nuclei among optic nerve head (G-H) and superficial retinal vasculature (I) after 3 days post-exposure (arrowheads), compared to 24hrs LD. J: CD206+ cells were occasionally found accumulating within the choroid at 7 days post-exposure (arrowheads). K-L: All IR for CD206 was found to correlate with circular IBA1+ cells (red). M-N: CD206-expressing cells (N, arrowhead) did not show any detectable IR for the M1 marker Il-1 beta (red). O: Quantification of CD206 protein levels in retinas via ELISA. At 3 and 7 days post-exposure, the levels of CD206 protein were significantly higher compared to dim-reared controls (P<0.05). Progressive increases were observed during the post-exposure period, though this was not significant between 3 and 7 days (P>0.05). C, choroid; GCL, ganglion cell layer; INL, inner nuclear layer; IPL, inner plexiform layer; IHC, immunohistochemistry; ONL, outer nuclear layer; OS, outer segments; RPE, retinal pigment epithelium. The trend in ELISA protein levels was significant by ANOVA (P < 0.05); N = 3 for each timepoint. Image collected and cropped by CiteAb from the following open publication (https://pubmed.ncbi.nlm.nih.gov/26630454), licensed under a CC-BY license. Not internally tested by R&D Systems.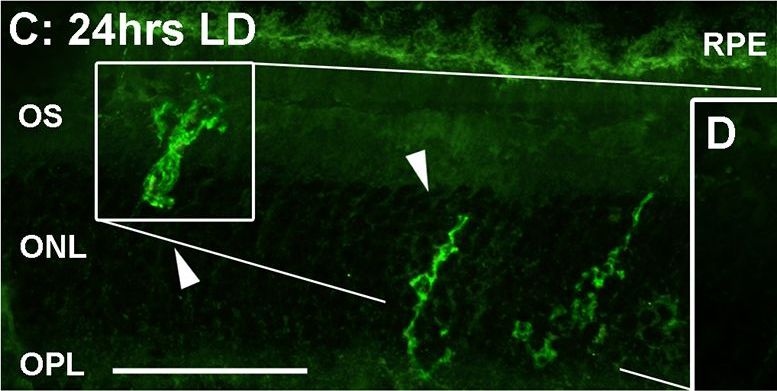
Detection of Porcine IL-1 beta/IL-1F2 by Immunocytochemistry/ Immunofluorescence
Spatiotemporal analysis of retinal Il-1 beta protein levels following LD.A-G: Immunohistochemical assessment of Il-1 beta expression (green) in retinal cryosections over the course of LD. A: Immunoreactivity (IR) for Il-1 beta protein was not observed in dim-reared animals. B-D: Il-1 beta -IR was present among ramified nuclei situated within the ONL and OS (arrowheads) immediately following exposure to 24hrs LD. E-F: Il-1 beta -IR co-localised with IBA1+ cells (red) situated in the ONL/OS, though was not apparent in IBA1+ cells outside the vicinity of the ONL (asterisks). G-H: Il-1 beta -expressing cells (H, arrowheads) did not show any discernible IR for the M2 marker CD206 (red). I: Negative control sections, in which the primary antibody was omitted, did not show any resemblance to the IR for Il-1 beta evidenced in C-D at 24hrs LD. J: ELISA for Il-1 beta protein indicated an increased abundance of the protein immediately after 24hrs LD (P<0.05), and which was virtually undetectable at all other time points. C, choroid; GCL, ganglion cell layer; INL, inner nuclear layer; IHC, immunohistochemistry; ONL, outer nuclear layer; OS, outer segments; RPE, retinal pigment epithelium. The trend in ELISA protein levels was significant by ANOVA (P < 0.05); N = 3 for each timepoint. Image collected and cropped by CiteAb from the following open publication (https://pubmed.ncbi.nlm.nih.gov/26630454), licensed under a CC-BY license. Not internally tested by R&D Systems.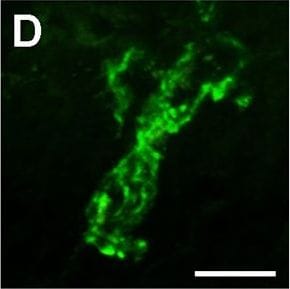
Detection of Porcine IL-1 beta/IL-1F2 by Immunocytochemistry/ Immunofluorescence
Spatiotemporal analysis of retinal Il-1 beta protein levels following LD.A-G: Immunohistochemical assessment of Il-1 beta expression (green) in retinal cryosections over the course of LD. A: Immunoreactivity (IR) for Il-1 beta protein was not observed in dim-reared animals. B-D: Il-1 beta -IR was present among ramified nuclei situated within the ONL and OS (arrowheads) immediately following exposure to 24hrs LD. E-F: Il-1 beta -IR co-localised with IBA1+ cells (red) situated in the ONL/OS, though was not apparent in IBA1+ cells outside the vicinity of the ONL (asterisks). G-H: Il-1 beta -expressing cells (H, arrowheads) did not show any discernible IR for the M2 marker CD206 (red). I: Negative control sections, in which the primary antibody was omitted, did not show any resemblance to the IR for Il-1 beta evidenced in C-D at 24hrs LD. J: ELISA for Il-1 beta protein indicated an increased abundance of the protein immediately after 24hrs LD (P<0.05), and which was virtually undetectable at all other time points. C, choroid; GCL, ganglion cell layer; INL, inner nuclear layer; IHC, immunohistochemistry; ONL, outer nuclear layer; OS, outer segments; RPE, retinal pigment epithelium. The trend in ELISA protein levels was significant by ANOVA (P < 0.05); N = 3 for each timepoint. Image collected and cropped by CiteAb from the following open publication (https://pubmed.ncbi.nlm.nih.gov/26630454), licensed under a CC-BY license. Not internally tested by R&D Systems.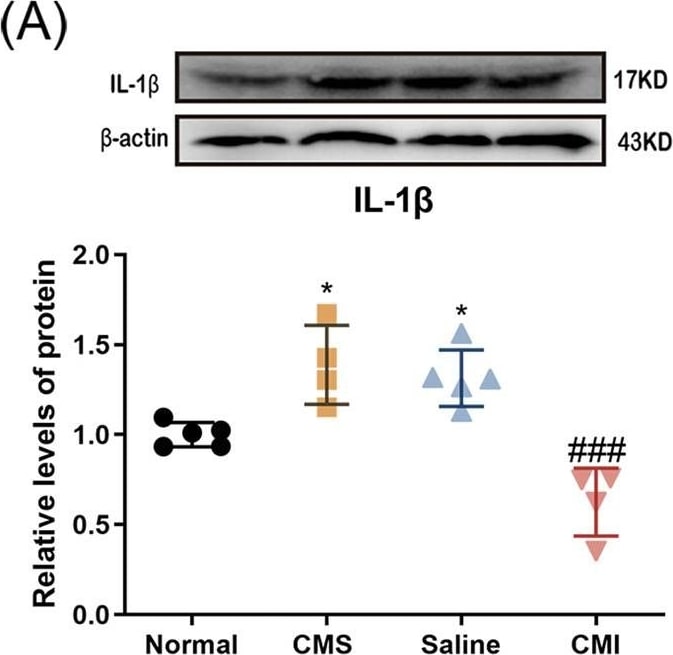
Detection of Porcine IL-1 beta/IL-1F2 by Western Blot
The effect of chronic clomipramine treatment on the hippocampal NLRP3 inflammasome level in the CMS-treated rats.The protein levels of A IL-1 beta, B cleaved caspase-1, C NLRP3, D ASC, and E pro-caspase-1 (n = 4/group) were analyzed by western blot. All data are expressed as the mean ± SD. ##p < 0.01, ###p < 0.001 compared to saline-treated rats. *p < 0.05, **p <0.01, ***p < 0.001 compared to non-stressed control rats. Image collected and cropped by CiteAb from the following open publication (https://pubmed.ncbi.nlm.nih.gov/35688836), licensed under a CC-BY license. Not internally tested by R&D Systems.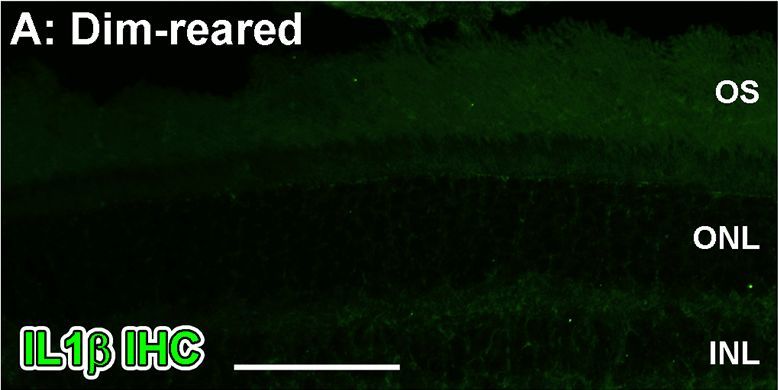
Detection of Porcine IL-1 beta/IL-1F2 by Immunocytochemistry/ Immunofluorescence
Spatiotemporal analysis of retinal Il-1 beta protein levels following LD.A-G: Immunohistochemical assessment of Il-1 beta expression (green) in retinal cryosections over the course of LD. A: Immunoreactivity (IR) for Il-1 beta protein was not observed in dim-reared animals. B-D: Il-1 beta -IR was present among ramified nuclei situated within the ONL and OS (arrowheads) immediately following exposure to 24hrs LD. E-F: Il-1 beta -IR co-localised with IBA1+ cells (red) situated in the ONL/OS, though was not apparent in IBA1+ cells outside the vicinity of the ONL (asterisks). G-H: Il-1 beta -expressing cells (H, arrowheads) did not show any discernible IR for the M2 marker CD206 (red). I: Negative control sections, in which the primary antibody was omitted, did not show any resemblance to the IR for Il-1 beta evidenced in C-D at 24hrs LD. J: ELISA for Il-1 beta protein indicated an increased abundance of the protein immediately after 24hrs LD (P<0.05), and which was virtually undetectable at all other time points. C, choroid; GCL, ganglion cell layer; INL, inner nuclear layer; IHC, immunohistochemistry; ONL, outer nuclear layer; OS, outer segments; RPE, retinal pigment epithelium. The trend in ELISA protein levels was significant by ANOVA (P < 0.05); N = 3 for each timepoint. Image collected and cropped by CiteAb from the following open publication (https://pubmed.ncbi.nlm.nih.gov/26630454), licensed under a CC-BY license. Not internally tested by R&D Systems.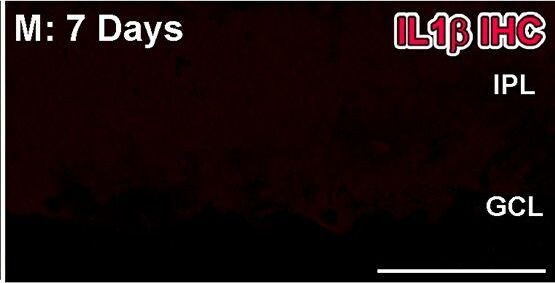
Detection of Porcine IL-1 beta/IL-1F2 by Immunocytochemistry/ Immunofluorescence
Spatiotemporal analysis of retinal CD206 protein levels following LD.A-L: investigation of CD206 immunoreactivity (IR, green) in retinal cryosections over the course of LD. A-B: In dim-reared animals, immunoreactivity (IR) for Il-1 beta protein was occasionally observed within nuclei (arrowheads) amongst the choroid (A) and ciliary body (B). C-E: Following 24hrs LD, CD206+ nuclei appeared from the ciliary body (C-D, arrowheads) and among the superficial retinal vasculature (E, arrowhead) F: At 24hrs LD, CD206+ cells were also more abundant within the ciliary body (arrowheads). G-I: There was increased abundance of CD206+ nuclei among optic nerve head (G-H) and superficial retinal vasculature (I) after 3 days post-exposure (arrowheads), compared to 24hrs LD. J: CD206+ cells were occasionally found accumulating within the choroid at 7 days post-exposure (arrowheads). K-L: All IR for CD206 was found to correlate with circular IBA1+ cells (red). M-N: CD206-expressing cells (N, arrowhead) did not show any detectable IR for the M1 marker Il-1 beta (red). O: Quantification of CD206 protein levels in retinas via ELISA. At 3 and 7 days post-exposure, the levels of CD206 protein were significantly higher compared to dim-reared controls (P<0.05). Progressive increases were observed during the post-exposure period, though this was not significant between 3 and 7 days (P>0.05). C, choroid; GCL, ganglion cell layer; INL, inner nuclear layer; IPL, inner plexiform layer; IHC, immunohistochemistry; ONL, outer nuclear layer; OS, outer segments; RPE, retinal pigment epithelium. The trend in ELISA protein levels was significant by ANOVA (P < 0.05); N = 3 for each timepoint. Image collected and cropped by CiteAb from the following open publication (https://pubmed.ncbi.nlm.nih.gov/26630454), licensed under a CC-BY license. Not internally tested by R&D Systems.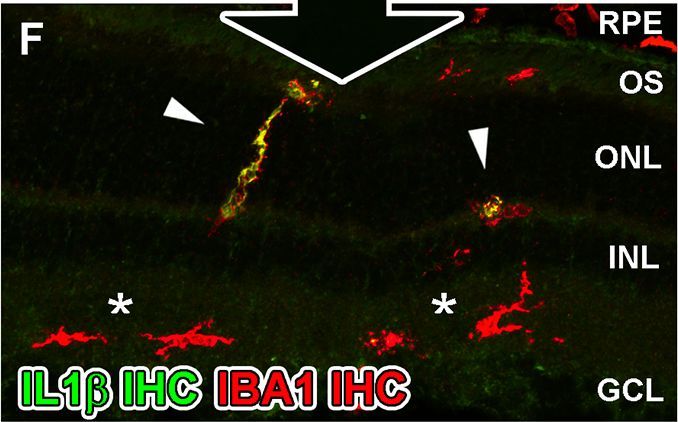
Detection of Porcine IL-1 beta/IL-1F2 by Immunocytochemistry/ Immunofluorescence
Spatiotemporal analysis of retinal Il-1 beta protein levels following LD.A-G: Immunohistochemical assessment of Il-1 beta expression (green) in retinal cryosections over the course of LD. A: Immunoreactivity (IR) for Il-1 beta protein was not observed in dim-reared animals. B-D: Il-1 beta -IR was present among ramified nuclei situated within the ONL and OS (arrowheads) immediately following exposure to 24hrs LD. E-F: Il-1 beta -IR co-localised with IBA1+ cells (red) situated in the ONL/OS, though was not apparent in IBA1+ cells outside the vicinity of the ONL (asterisks). G-H: Il-1 beta -expressing cells (H, arrowheads) did not show any discernible IR for the M2 marker CD206 (red). I: Negative control sections, in which the primary antibody was omitted, did not show any resemblance to the IR for Il-1 beta evidenced in C-D at 24hrs LD. J: ELISA for Il-1 beta protein indicated an increased abundance of the protein immediately after 24hrs LD (P<0.05), and which was virtually undetectable at all other time points. C, choroid; GCL, ganglion cell layer; INL, inner nuclear layer; IHC, immunohistochemistry; ONL, outer nuclear layer; OS, outer segments; RPE, retinal pigment epithelium. The trend in ELISA protein levels was significant by ANOVA (P < 0.05); N = 3 for each timepoint. Image collected and cropped by CiteAb from the following open publication (https://pubmed.ncbi.nlm.nih.gov/26630454), licensed under a CC-BY license. Not internally tested by R&D Systems.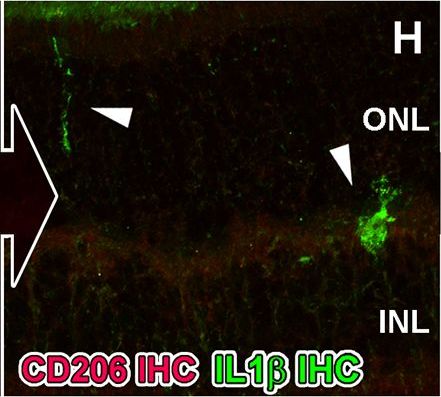
Detection of Porcine IL-1 beta/IL-1F2 by Immunocytochemistry/ Immunofluorescence
Spatiotemporal analysis of retinal Il-1 beta protein levels following LD.A-G: Immunohistochemical assessment of Il-1 beta expression (green) in retinal cryosections over the course of LD. A: Immunoreactivity (IR) for Il-1 beta protein was not observed in dim-reared animals. B-D: Il-1 beta -IR was present among ramified nuclei situated within the ONL and OS (arrowheads) immediately following exposure to 24hrs LD. E-F: Il-1 beta -IR co-localised with IBA1+ cells (red) situated in the ONL/OS, though was not apparent in IBA1+ cells outside the vicinity of the ONL (asterisks). G-H: Il-1 beta -expressing cells (H, arrowheads) did not show any discernible IR for the M2 marker CD206 (red). I: Negative control sections, in which the primary antibody was omitted, did not show any resemblance to the IR for Il-1 beta evidenced in C-D at 24hrs LD. J: ELISA for Il-1 beta protein indicated an increased abundance of the protein immediately after 24hrs LD (P<0.05), and which was virtually undetectable at all other time points. C, choroid; GCL, ganglion cell layer; INL, inner nuclear layer; IHC, immunohistochemistry; ONL, outer nuclear layer; OS, outer segments; RPE, retinal pigment epithelium. The trend in ELISA protein levels was significant by ANOVA (P < 0.05); N = 3 for each timepoint. Image collected and cropped by CiteAb from the following open publication (https://pubmed.ncbi.nlm.nih.gov/26630454), licensed under a CC-BY license. Not internally tested by R&D Systems.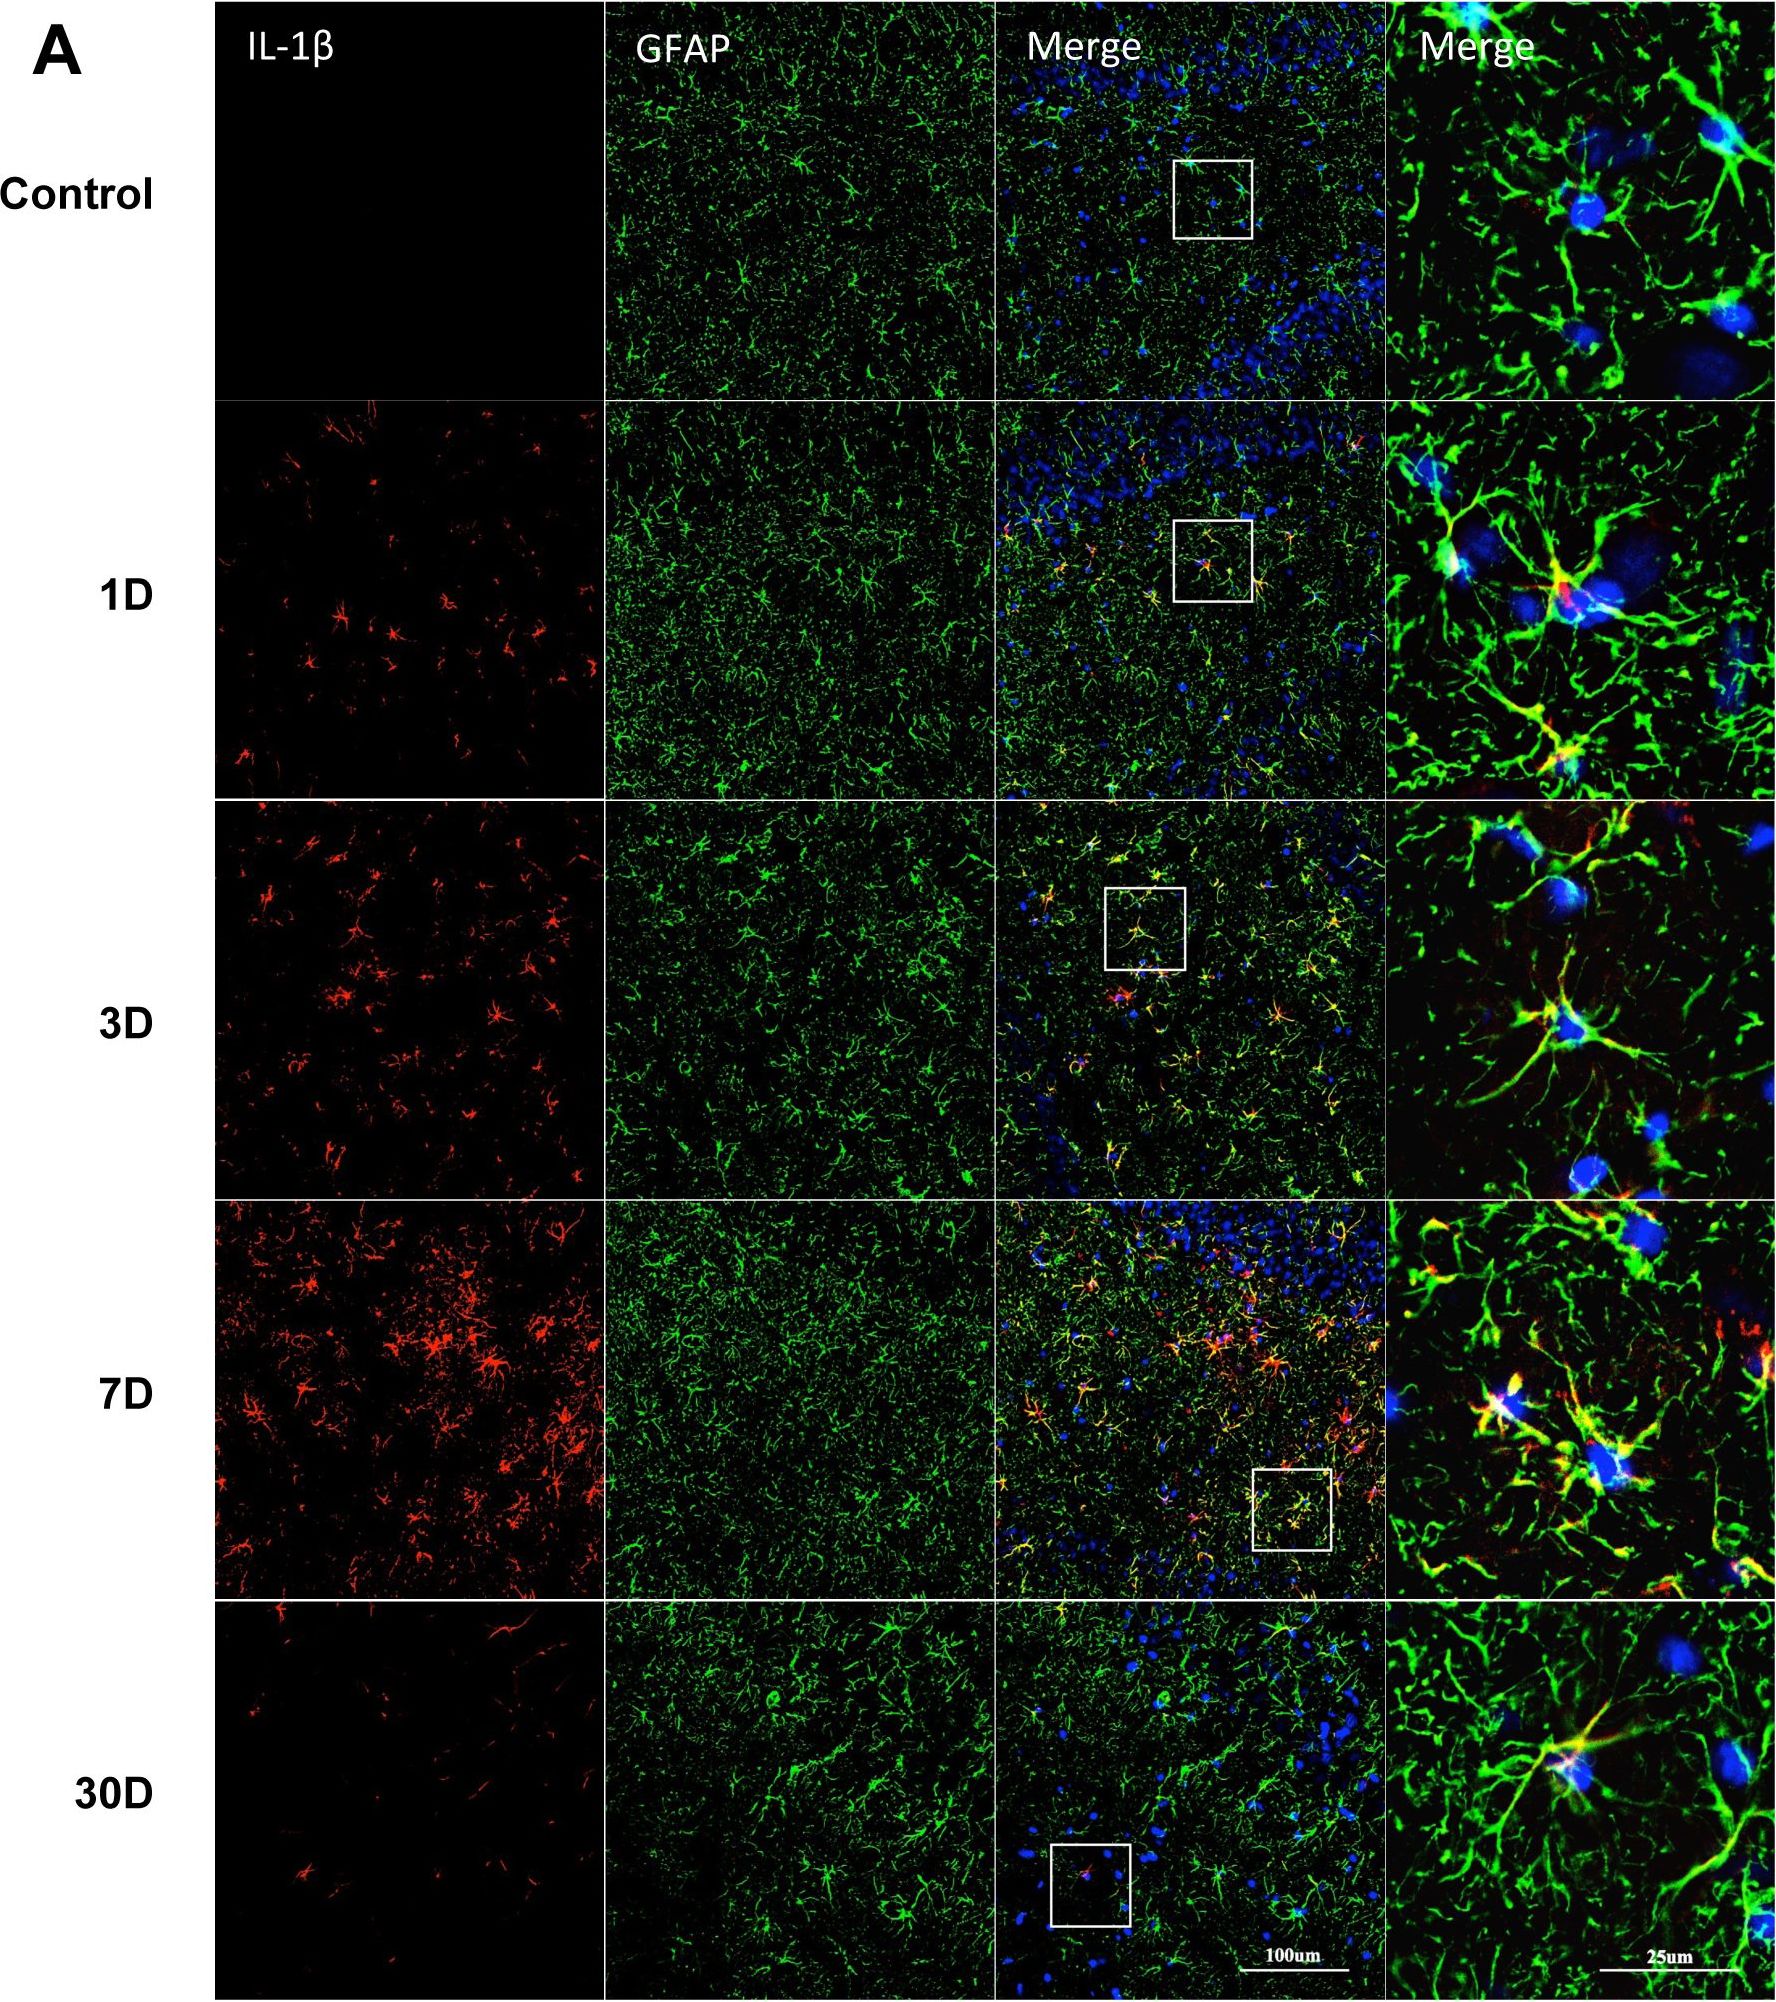
Detection of Porcine IL-1 beta/IL-1F2 by Immunocytochemistry/ Immunofluorescence
Sustained IL-1 beta up-regulation in hippocampal astrocytes.IL-1 beta immunoreactivity was measured in GFAP-positive cells after LPS exposure or saline. Levels of IL-1 beta were found up-regulated from day 1 up to day 30. Higher magnification insets highlight the co-localization of IL-1 beta with GFAP (A). The ratio of IL-1 beta positive astrocytes in total astrocytes (GFAP positive cells) was quantified (B). Pictures show DG area, data are expressed as mean ± standard error of the mean (n = 4) and compared by 1-way analysis of variance followed with Boferroni post hoc analysis, **p<0.01, ***p<0.001 vs Control. Image collected and cropped by CiteAb from the following open publication (https://dx.plos.org/10.1371/journal.pone.0106331), licensed under a CC-BY license. Not internally tested by R&D Systems.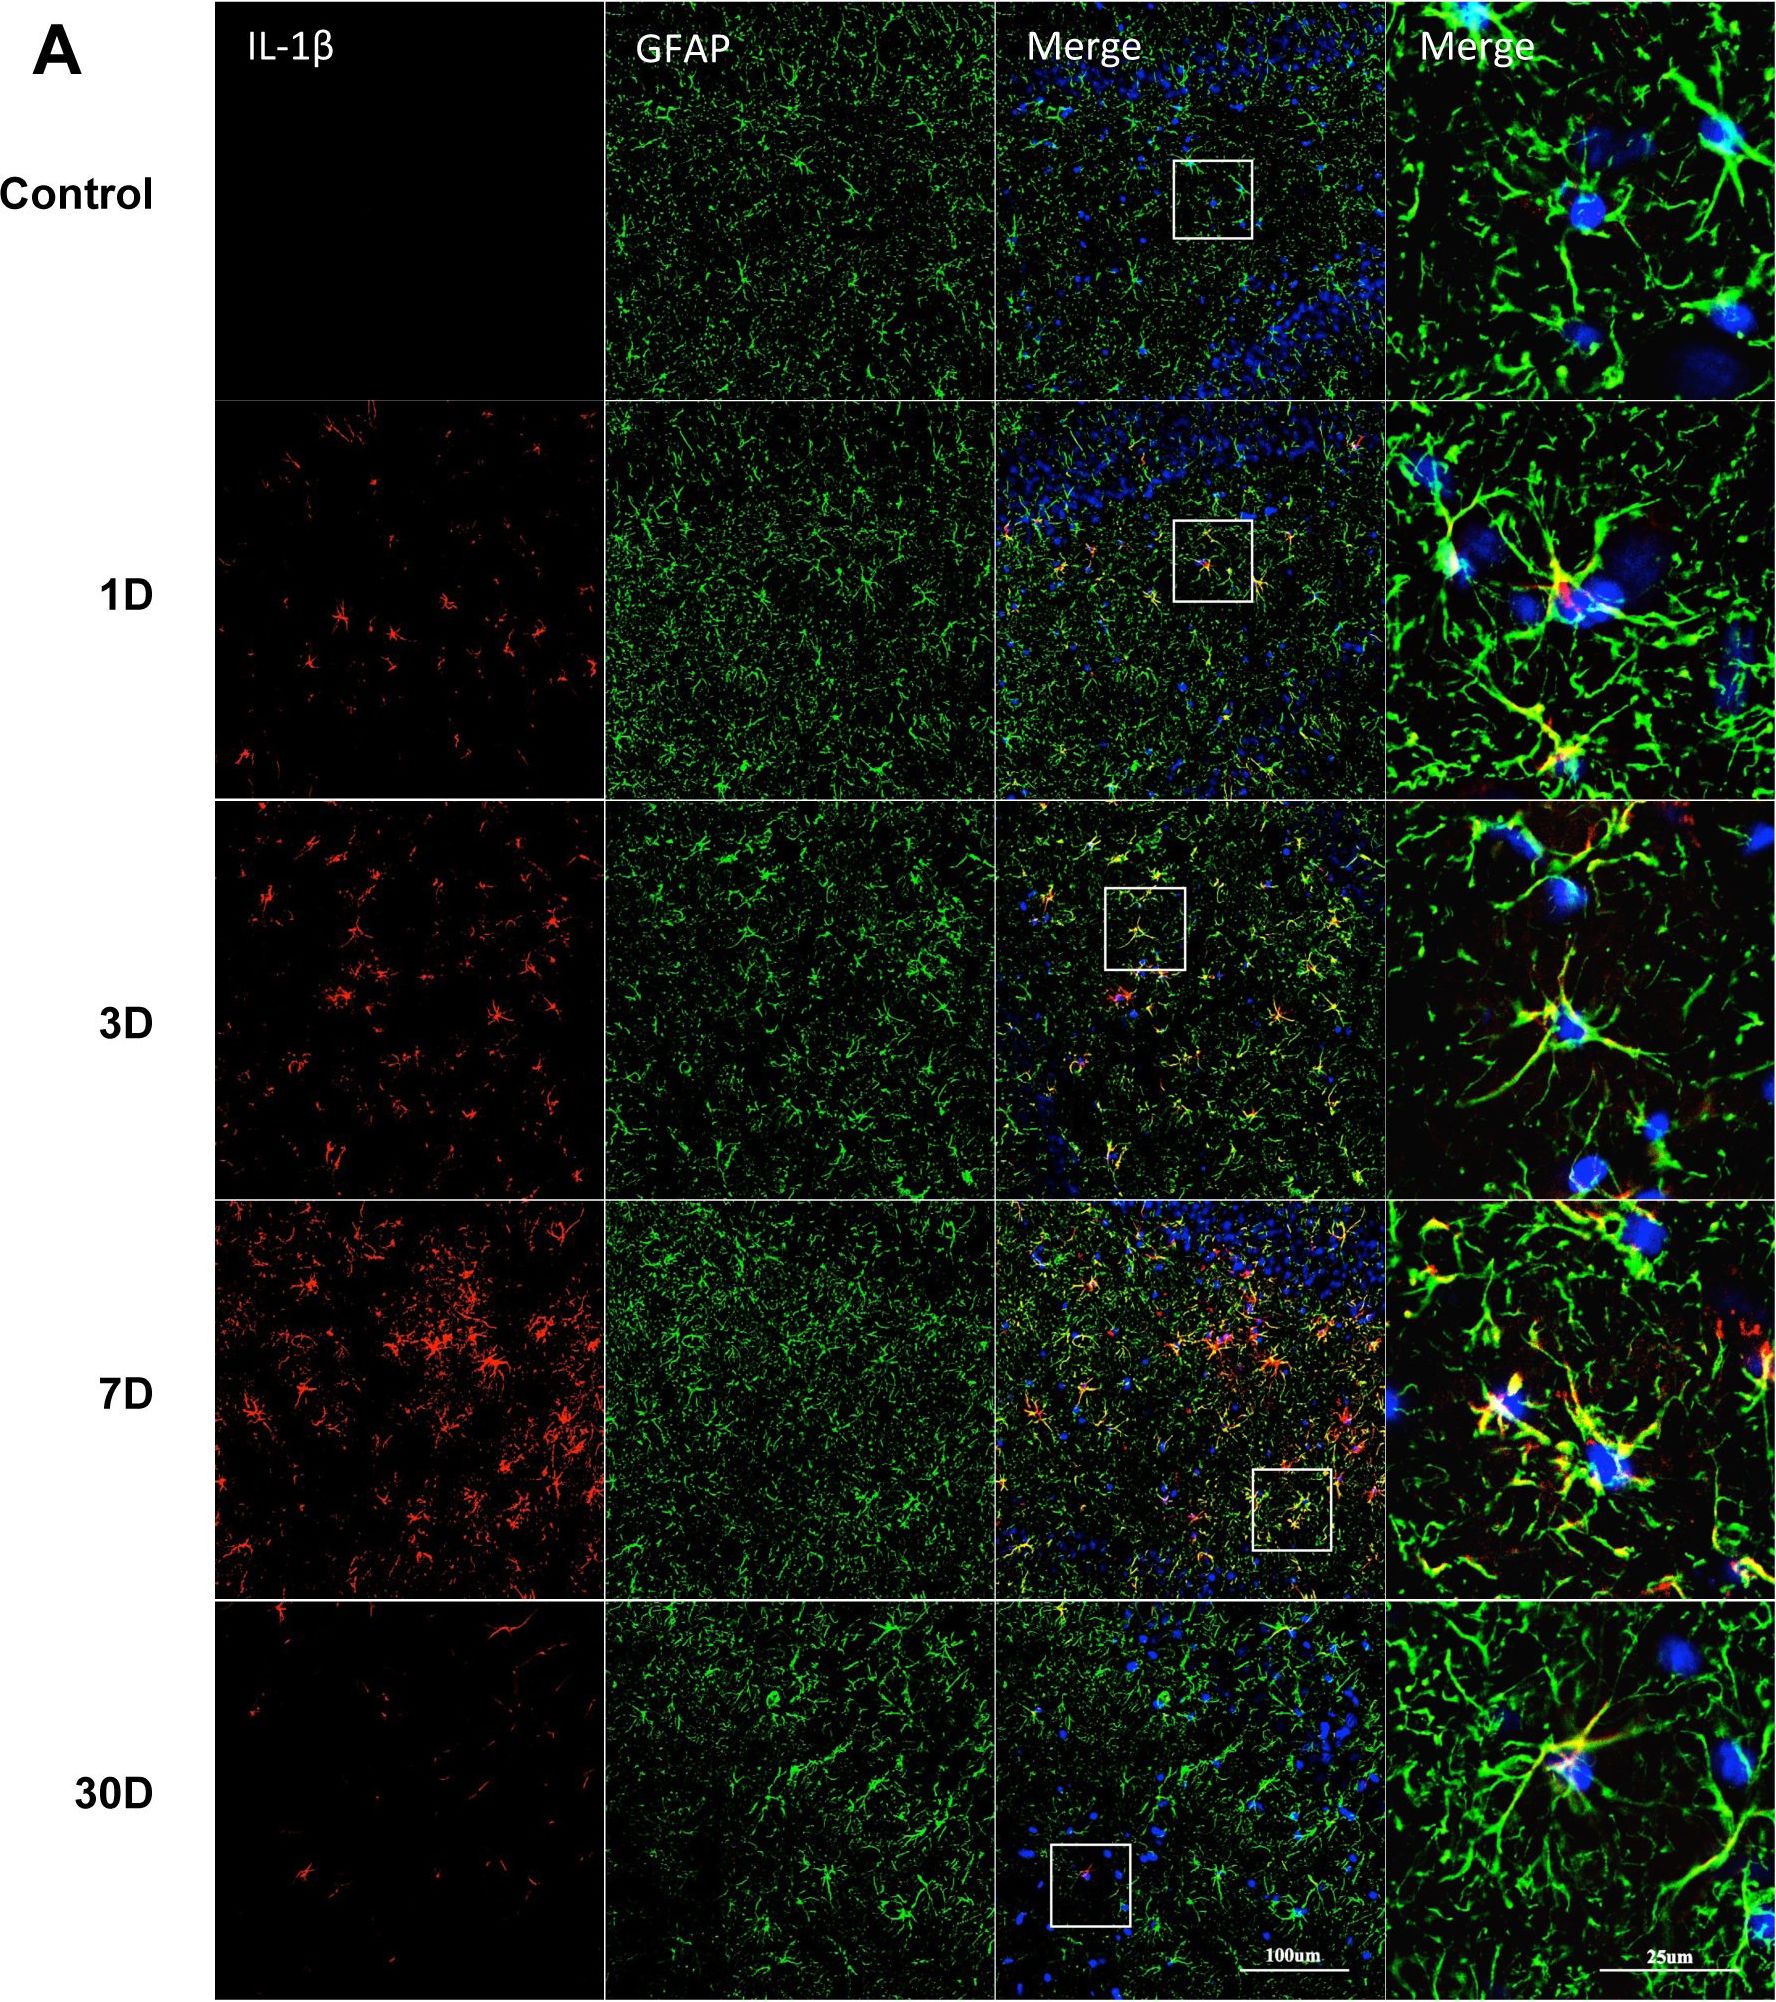
Detection of Rat IL-1 beta/IL-1F2 by Immunocytochemistry/ Immunofluorescence
Sustained IL-1 beta up-regulation in hippocampal astrocytes.IL-1 beta immunoreactivity was measured in GFAP-positive cells after LPS exposure or saline. Levels of IL-1 beta were found up-regulated from day 1 up to day 30. Higher magnification insets highlight the co-localization of IL-1 beta with GFAP (A). The ratio of IL-1 beta positive astrocytes in total astrocytes (GFAP positive cells) was quantified (B). Pictures show DG area, data are expressed as mean ± standard error of the mean (n = 4) and compared by 1-way analysis of variance followed with Boferroni post hoc analysis, **p<0.01, ***p<0.001 vs Control. Image collected and cropped by CiteAb from the following open publication (https://dx.plos.org/10.1371/journal.pone.0106331), licensed under a CC-BY license. Not internally tested by R&D Systems.
Rat IL-1 beta / IL-1F2 ELISA Standard Curve
Recombinant Rat IL‑1 beta /IL‑1F2 (Catalog # 501-RL) was serially diluted and captured by Goat Anti-Rat IL‑1 beta /IL‑1F2 Antigen Affinity-purified Polyclonal Antibody (Catalog # AF-501-NA) coated on a Clear Polystyrene Microplate (Catalog # DY990). Goat Anti-Rat IL‑1 beta /IL‑1F2 Antigen Affinity-purified Polyclonal Antibody (Catalog # AF-501-NA) was biotinylated and incubated with the protein captured on the plate. Detection of the standard curve was achieved by incubating Streptavidin-HRP (Catalog # DY998)
Rat IL-1 beta / IL-1F2 ELISA Standard Curve
Recombinant Rat IL‑1 beta /IL‑1F2 (Catalog # 501-RL) was serially diluted and captured by Goat Anti-Rat IL‑1 beta /IL‑1F2 Antigen Affinity-purified Polyclonal Antibody (Catalog # AF-501-NA) coated on a Clear Polystyrene Microplate (Catalog # DY990). Goat Anti-Rat IL‑1 beta /IL‑1F2 Antigen Affinity-purified Polyclonal Antibody (Catalog # AF-501-NA) was biotinylated and incubated with the protein captured on the plate. Detection of the standard curve was achieved by incubating Streptavidin-HRP (Catalog # DY998)Applications for Rat IL-1 beta/IL-1F2 Antibody
Immunocytochemistry
Sample: Immersion fixed LPS-stimulated rat splenocytes
Western Blot
Sample: Recombinant Rat IL‑1 beta /IL‑1F2 (Catalog # 501-RL)
Neutralization
Rat IL-1 beta /IL-1F2 Sandwich Immunoassay
Reviewed Applications
Read 1 review rated 5 using AF-501-NA in the following applications:
Formulation, Preparation, and Storage
Purification
Reconstitution
Reconstitute at 0.2 mg/mL in sterile PBS. For liquid material, refer to CoA for concentration.
Formulation
Shipping
Stability & Storage
- 12 months from date of receipt, -20 to -70 °C as supplied.
- 1 month, 2 to 8 °C under sterile conditions after reconstitution.
- 6 months, -20 to -70 °C under sterile conditions after reconstitution.
Calculators
Background: IL-1 beta/IL-1F2
Long Name
Alternate Names
Entrez Gene IDs
Gene Symbol
UniProt
Additional IL-1 beta/IL-1F2 Products
Product Documents for Rat IL-1 beta/IL-1F2 Antibody
Certificate of Analysis
To download a Certificate of Analysis, please enter a lot or batch number in the search box below.
Note: Certificate of Analysis not available for kit components.
Product Specific Notices for Rat IL-1 beta/IL-1F2 Antibody
For research use only
Related Research Areas
Citations for Rat IL-1 beta/IL-1F2 Antibody
 Powered by Bioz
Customer Reviews for Rat IL-1 beta/IL-1F2 Antibody (1)
Have you used Rat IL-1 beta/IL-1F2 Antibody?
Submit a review and receive an Amazon gift card!
$25/€18/£15/$25CAN/¥2500 for a review with an image
$10/€7/£6/$10CAN/¥1110 for a review without an image
Submit a review
Customer Images
-
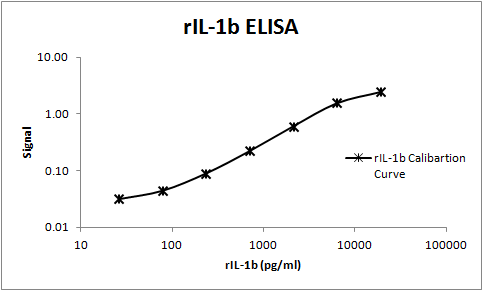
Application: ELISASample Tested: SerumSpecies: RatVerified Customer | Posted 11/07/2017This polyclonal antibody was used as both a capture and detection (the biotinylated version of this antibody, BAF501, was used as the detection) in a sandwich ELISA. Rat IL-1b was successful measured in serum samples.

There are no reviews that match your criteria.
Protocols
Find general support by application which include: protocols, troubleshooting, illustrated assays, videos and webinars.
- Appropriate Fixation of IHC/ICC Samples
- Cellular Response to Hypoxia Protocols
- ClariTSA™ Fluorophore Kits
- Detection & Visualization of Antibody Binding
- ICC Cell Smear Protocol for Suspension Cells
- ICC Immunocytochemistry Protocol Videos
- ICC for Adherent Cells
- Immunocytochemistry (ICC) Protocol
- Immunocytochemistry Troubleshooting
- Immunofluorescence of Organoids Embedded in Cultrex Basement Membrane Extract
- Immunohistochemistry (IHC) and Immunocytochemistry (ICC) Protocols
- Preparing Samples for IHC/ICC Experiments
- Preventing Non-Specific Staining (Non-Specific Binding)
- Primary Antibody Selection & Optimization
- Protocol for VisUCyte™ HRP Polymer Detection Reagent
- Protocol for the Fluorescent ICC Staining of Cell Smears - Graphic
- Protocol for the Fluorescent ICC Staining of Cultured Cells on Coverslips - Graphic
- Protocol for the Preparation and Fluorescent ICC Staining of Cells on Coverslips
- Protocol for the Preparation and Fluorescent ICC Staining of Non-adherent Cells
- Protocol for the Preparation and Fluorescent ICC Staining of Stem Cells on Coverslips
- Protocol for the Preparation of a Cell Smear for Non-adherent Cell ICC - Graphic
- R&D Systems Quality Control Western Blot Protocol
- TUNEL and Active Caspase-3 Detection by IHC/ICC Protocol
- The Importance of IHC/ICC Controls
- Troubleshooting Guide: Western Blot Figures
- Western Blot Conditions
- Western Blot Protocol
- Western Blot Protocol for Cell Lysates
- Western Blot Troubleshooting
- Western Blot Troubleshooting Guide
- View all Protocols, Troubleshooting, Illustrated assays and Webinars
Associated Pathways