53BP1 Antibody - BSA Free
Novus Biologicals | Catalog # NB100-304

Key Product Details
Validated by
Knockout/Knockdown, Biological Validation
Species Reactivity
Validated:
Human, Mouse, Rat
Cited:
Human, Mouse, Rat, Porcine, Avian, Goat, Insect - Drosophila melanogaster, Naked mole-rat, Primate, Rabbit, Reptile
Predicted:
Chimpanzee (96%), Feline (90%), Orangutan (96%), Porcine (90%), Rabbit (90%), Sheep (90%). Backed by our 100% Guarantee.
Applications
Validated:
Knockout Validated, Immunohistochemistry, Immunohistochemistry-Paraffin, Immunohistochemistry-Frozen, Western Blot, Flow (Intracellular), Immunocytochemistry/ Immunofluorescence, Simple Western, Immunoprecipitation
Cited:
Knockout Validated, Immunohistochemistry, Immunohistochemistry-Paraffin, Immunohistochemistry-Frozen, Western Blot, Immunoblotting, Flow Cytometry, Immunofluorescence, Immunocytochemistry/ Immunofluorescence, Immunoprecipitation, Chromatin Immunoprecipitation, Chemotaxis, FISH, Proximity Ligation Assay, IF-FISH, IF/ICC, IF/IHC, In Situ Hybridization, Knockdown Validated
Label
Unconjugated
Antibody Source
Polyclonal Rabbit IgG
Format
BSA Free
Loading...
Product Specifications
Immunogen
Partial synthetic peptide made to an internal portion of human 53BP1 (between amino acids 350-400) [NP_005648.1].
Reactivity Notes
Predicted cross-reactivity based on sequence identity: Gorilla (96%), Gibbon (94%), Marmoset (92%).
Marker
DNA Double Strand Break Marker
Clonality
Polyclonal
Host
Rabbit
Isotype
IgG
Theoretical MW
214 kDa.
Disclaimer note: The observed molecular weight of the protein may vary from the listed predicted molecular weight due to post translational modifications, post translation cleavages, relative charges, and other experimental factors.
Disclaimer note: The observed molecular weight of the protein may vary from the listed predicted molecular weight due to post translational modifications, post translation cleavages, relative charges, and other experimental factors.
Scientific Data Images for 53BP1 Antibody - BSA Free
Immunohistochemical Detection of 53BP1 in Frozen Mouse Ganglion Cells
Irradiated cochlear spiral ganglion cells, mouse, frozen section of fixed material. Image from verified customer review.
Knockout Validation of 53BP1 Antibody in HeLa and 53BP1 Knockout HeLa Cells in Immunocytochemistry/Immunofluorescence
53BP1 was detected in immersion fixed HeLa cells (left) but was not detected in 53BP1 knockout Hela cells (right) using Rabbit Anti-human 53BP1 polyclonal antibody (Catalog #NB100-304) at 0.3 ug/mL for 3 hours at room temperature. Cells were stained using the NorthernLights™ 557-conjugated Anti-Rabbit IgG Secondary Antibody (red; Catalog # NL004) and counterstained with DAPI (blue). Specific staining was localized to nuclei.
Western Blotting of 53BP1 in Multiple Cell Lines
Total protein from HeLa, A431, Neuro2A, and PC12 was separated on a 12% gel by SDS-PAGE, transferred to PVDF membrane and blocked in 5% non-fat milk in TBST. The membrane was probed with 1.0 ug/mL in 5% block buffer and detected with an anti-rabbit HRP secondary antibody using chemiluminescence. The observed molecular weight for these samples are ~250 kDa and the theoretical molecular weight is 214 kDa.
Immunohistochemical Analysis of 53BP1 in Paraffin Embedded Breast Tumors
Human breast tumors stained with 53BP1 antibody. Image from verified customer review.
53BP1 Staining in Multiple Tissues
Detection of Human and Mouse 53BP1 by IHC. Sample: FFPE sections of human ovarian carcinoma (left) and mouse teratoma (right). Antibody: 53BP1 Antibody (Catalog #NB100-304) used at a dilution of 1:1000 (1ug/mL). Detection: DAB.
Immunocytochemistry/Immunofluorescence Staining of 53BP1 in Multiple Cell Lines
Human medulloblastoma (DAOY) and mouse astrocyte (C8D1A) cell lines were exposed for 48 hours to DMSO or 1ug/mL of the DNA damaging agent EPE. Cells were immunostained for 53BP1 (green). The nuclei were counterstained with DAPI (blue). Image from verified customer review.
Intracellular Staining of 53BP1 in RH-30 Cells in Flow Cytometry
An intracellular stain was performed on RH-30 cells with 53BP1 Antibody (Catalog #NB100-304AF647) (blue) and a matched isotype control (orange). Cells were fixed with 4% PFA and then permeabilized with 0.1% saponin. Cells were incubated in an antibody dilution of 5 ug/mL for 30 minutes at room temperature. Both antibodies were conjugated to Alexa Fluor 647.
Detection of 53BP1 in Immunoprecipitated HCC44 Cell Lysate
Immunoprecipitation analysis lysates from HCC44 cells in 1% NP40. Image from verified customer review.


Immunocytochemistry/Immunofluorescence Staining of 53BP1 in HeLa Cells
HeLa cells were fixed in 4% paraformaldehyde for 10 minutes and permeabilized in 0.5% Triton X-100 in PBS for 5 minutes. The cells were incubated with 53BP1 Antibody conjugated to DyLight 550 (NB100-304R) at 5 ug/ml for 1 hour at room temperature. Nuclei were counterstained with DAPI (Blue). Cells were imaged using a 40X objective.
Intracellular Staining of 53BP1 in Ntera2 Cells in Flow Cytometry
An intracellular stain was performed on Ntera2 cells with 53BP1 Antibody NB100-304 (blue) and a matched isotype control NBP2-24891 (orange). Cells were fixed with 4% PFA and then permeabilized with 0.1% saponin. Cells were incubated in an antibody dilution of 1.0 ug/mL for 30 minutes at room temperature, followed by Rabbit IgG (H+L) Cross-Adsorbed Secondary Antibody, Dylight 550 (SA5-10033, Thermo Fisher).
Western Blot of 53BP1 in Multiple Cell Lines
Whole cell lysate from U2OS or 293T cells. Bands indicate an observed molecular weight of ~220 kDa and the theoretical molecular weight is 214 kDa.

Immunocytochemistry/Immunofluorescence Staining of 53BP1 in Embryonic Fibroblast Cells
Embryonic Fibroblast cells pre-extraction for 5 mins with CSK buffer. Fixed with 4% PFA and 75% Ethanol. Primary Antibody at 1:1000. Secondary Antibody at 1:1000. Image from verified customer review.
Probing of 53BP1 in Untreated and Irradiated Cells
Upper Panel: Control untreated cells. Lower Panel: Cells exposed to irradiation (10 Gy) and probed for 53BP1 foci. Cells were grown on coverslips, fixed with 4% paraformaldehyde, methanol permeabilized, blocked for 1 h, RT. Incubated with primary antibody (1:200) overnight, washed 3x with PBS, probed with tubulin (Alexa Fluor 594) antibody for 2 h, RT. Washed 3x with PBS, mounted on slides using prolong gold, imaged using Nikon confocal microscope (100x oil). Image from verified customer review.


Immunofluorescence of 53BP1 in Transfected U2OS Cells
53BP1-Antibody-Immunocytochemistry-Immunofluorescence-NB100-304-img0046.jpg
Immunofluorescent Staining of 53BP1 in Ntera2 Cells
Ntera2 cells were fixed in 4% paraformaldehyde for 10 minutes and permeabilized in 0.5% Triton X-100 in PBS for 5 minutes. The cells were incubated with anti-53BP1 Antibody NB100-304 at 2 ug/ml overnight at 4C and detected with an anti-rabbit Dylight 488 (Green) at a 1:1000 dilution for 60 minutes. Alpha tubulin (DM1A) NB100-690 was used as a co-stain at a 1:1000 dilution and detected with an anti-mouse Dylight 550 (Red) at a 1:1000 dilution. Nuclei were counterstained with DAPI (Blue). Cells were imaged using a 100X objective and digitally deconvolved.
Immunofluorescent Staining of 53BP1 in NIH3T3 Cells
NIH3T3 cells were fixed in 4% paraformaldehyde for 10 minutes and permeabilized in 0.5% Triton X-100 in PBS for 5 minutes. The cells were incubated with anti-53BP1 Antibody NB100-304 at 2 ug/ml overnight at 4C and detected with an anti-rabbit Dylight 488 (Green) at a 1:1000 dilution for 60 minutes. Alpha tubulin (DM1A) NB100-690 was used as a co-stain at a 1:1000 dilution and detected with an anti-mouse Dylight 550 (Red) at a 1:1000 dilution. Nuclei were counterstained with DAPI (Blue). Cells were imaged using a 100X objective and digitally deconvolved.
Immunocytochemistry/Immunofluorescence in HeLa Cells Using Conjugated 53BP1 Antibody
HeLa cells were fixed in 4% paraformaldehyde for 10 minutes and permeabilized in 0.5% Triton X-100 in PBS for 5 minutes. The cells were incubated with 53PB1 Antibody conjugated to DyLight 550 (NB100-304R) at 5 ug/ml for 1 hour at room temperature. Nuclei were counterstained with DAPI (Blue). Cells were imaged using a 100X objective and digitally deconvolved.
Immunohistochemical Staining of 53BP1 in Paraffin Embedded Colon Cancer
Staining of 53BP1 in human colon cancer using DAB with hematoxylin counterstain.
Flow Cytometry of A431 Cells Stained with Conjugated 53BP1 Antibody
An intracellular stain was performed on A431 cells with 53BP1 Antibody (Catalog #NB100-304AF647) (blue) and a matched isotype control (orange). Cells were fixed with 4% PFA and then permeabilized with 0.1% saponin. Cells were incubated in an antibody dilution of 2.5 ug/mL for 30 minutes at room temperature. Both antibodies were conjugated to Alexa Fluor 647.
Cells Stained with 53BP1 Antibody in Immunocytochemistry/Immunofluorescence
For 53BP1 staining, samples were incubated for 1 hour with 1:200 53BP1 primary antibody in PBS/BSA 1%, at room temperature. Green: 53BP Blue: DAPI. Image from verified customer review.
Western Blot: 53BP1 Antibody - BSA Free [NB100-304] -
DYNLL1 is required for 53BP1-dependent p53 responses to Nutlin-3. a Immunoblot analysis of the MCF-7 cell lines used in (a) with anti-53BP1 or anti-RPA32 antibodies prior to N3 treatment. b Quantification of n = 3 independent experiments represented in (a), each performed in triplicate. Mean ± SD. c Indicated parental or stably complemented 53BP1-/- MCF-7 cell lines were incubated in the presence (11 days) or absence (7 days) of Nutlin-3 (4 µM)
Immunocytochemistry/Immunofluorescence: 53BP1 Antibody - BSA Free [NB100-304] -
Depletion of PNUTS and NPAT induces a global DDR.(A) Induction of telomere dysfunction–induced foci (TIF) upon candidate knockdown in HeLa cells from Fig 5. Depletion of TRF2 was used as a positive control. 53BP1 was detected by indirect IF and telomeres by FISH with a Cy3-[CCCTAA]3 probe. (B) Frequency distribution of the number of TIFs per cell from (A). n indicates the number of cells analyzed for each condition and red lines mark the mean.
Western Blot: 53BP1 Antibody - BSA Free [NB100-304] -
HPV+ HNSCCs have decreased expression of NHEJ and HR proteins including DNA-Pk and BRCA2Cells were treated with mock or 4 Gy radiation, harvested and lysed at 15 minutes post-treatment, and analyzed by western blot for relative expression of indicated proteins. beta -actin was used as a loading control. Shown is a representative blot from 2 independent experiments.
Immunocytochemistry/Immunofluorescence: 53BP1 Antibody - BSA Free [NB100-304] -
LNCaP cells in culture were treated for 24 hrs with DMSO or ENZ, then irradiated with 0 or 1 Gy.Cell were fixed and immunostained for 53BP1 0.5, 1.5 and 24 hrs after irradiation. Immunofluorescent images were obtained by confocal microscopy. White bar = 20 microns. A) DMSO alone, B) ENZ alone, C) 1 Gy, D) ENZ + 1 Gy. White bar = 20 microns.
Detection of Human 53BP1 by Simple WesternTM.Dilution: 4-20 µg/mL
Left: Simple Western lane view shows lysates of HepG2 human hepatocellular carcinoma cell line, loaded at 1 mg/ml. A specific band was detected for 53BP1 at approximately 353 kDa (as indicated) using both 4 µg/ml and 20 µg/ml of Rabbit Anti-Human 53BP1 Antigen Affinity-purified Polyclonal Antibody (Catalog # NB100-304) followed by HRP-conjugated Goat Anti-Rabbit Secondary Antibody (Catalog # 042-206). This experiment was conducted under reducing conditions and using the 66-440kDa separation system. Right: Simple Western electropherogram showing the same Rabbit Anti-Human 53BP1 Antigen Affinity-purified Polyclonal Antibody (Catalog # NB100-304) tested at 4 µg/ml (blue line) and 20 µg/ml (green line) in the HepG2 human hepatocellular carcinoma cell line.
Immunohistochemistry: 53BP1 Antibody - BSA Free [NB100-304] -
Representative immunohistochemistry staining for 53BP1 expression in pancreatic adenocarcinoma. (A) is high intensity of 53BP1 expression and (B) is low intensity of 53BP1 expression.
53BP1 in U-2 OS Human Cell Line.
53BP1 was detected in immersion fixed U-2 OS human osteosarcoma cell line using Rabbit anti-53BP1 Antigen Affinity Purified Polyclonal Antibody conjugated to DyLight 650 (Catalog # NB100-304C) (light blue) at 10 µg/mL overnight at 4C. Cells were counterstained with DAPI (blue). Cells were imaged using a 100X objective and digitally deconvolved.
Western Blot: 53BP1 Antibody - BSA Free [NB100-304] -
Western Blot: 53BP1 Antibody - BSA Free [NB100-304] - Depletion of TPX2 causes defects in 53BP1 ionizing radiation-induced foci formation.(A) The protein level of 53BP1 is not affected by miRNA-mediated depletion of TPX2. Levels of actin used as loading controls. Image collected & cropped by CiteAb from the following publication (https://dx.plos.org/10.1371/journal.pone.0110994), licensed under a CC-BY license. Not internally tested by Novus Biologicals.
Immunocytochemistry/ Immunofluorescence: 53BP1 Antibody - BSA Free [NB100-304] -
Immunocytochemistry/ Immunofluorescence: 53BP1 Antibody - BSA Free [NB100-304] - Nuclear intensity of key BER proteins.A) Quantification of mean nuclear fluorescence intensity is shown for PARP1 (**** P < 0.0001, MDA-231 to MDA-157, HCC1806, & MDA-468), PAR (**** P < 0.0001, MDA-468 to MDA-157, MDA-231, & HCC1806), & p53 (**** P < 0.0001, MDA-157 to MDA-231, MDA-157 to MDA-468, MDA-157 to HCC1806, MDA-231 to MDA-468, MDA-231 to HCC1806, & MDA-468 to HCC1806). B) Representative fluorescent images used for quantification in A for PARP1, PAR, & p53 for all cell lines tested. Scale bar = 20 μm. Image collected & cropped by CiteAb from the following publication (https://pubmed.ncbi.nlm.nih.gov/31596905), licensed under a CC-BY license. Not internally tested by Novus Biologicals.
Immunohistochemistry: 53BP1 Antibody - BSA Free [NB100-304] -
Immunohistochemistry: 53BP1 Antibody - BSA Free [NB100-304] - Representative immunohistochemistry staining for 53BP1 expression in pancreatic adenocarcinoma. (A) is high intensity of 53BP1 expression & (B) is low intensity of 53BP1 expression. Image collected & cropped by CiteAb from the following publication (https://pubmed.ncbi.nlm.nih.gov/23530749), licensed under a CC-BY license. Not internally tested by Novus Biologicals.
Immunocytochemistry/ Immunofluorescence: 53BP1 Antibody - BSA Free [NB100-304] -
Immunocytochemistry/ Immunofluorescence: 53BP1 Antibody - BSA Free [NB100-304] - H2A.J accumulates in the aging human epidermis.(a) H2A.J & Ki-67 co-localization in sections of human skin of the indicated ages by immunofluorescent staining. H2A.J showed mutually exclusive staining with the Ki-67 proliferation marker. (b) H2A.J & 53BP1 foci increase in aging human epidermis. Arrows indicate positively-stained nuclei. A quantification of positive cells for three biological replicates is shown below the immunofluorescence images, & the one-sided Mann–Whitney U-test was used to determine the statistical significance (*P<0.05, **P<0.01). Error bars represent mean±s.e. Image collected & cropped by CiteAb from the following publication (https://www.nature.com/articles/ncomms14995), licensed under a CC-BY license. Not internally tested by Novus Biologicals.
Western Blot: 53BP1 Antibody - BSA Free [NB100-304] -
Western Blot: 53BP1 Antibody - BSA Free [NB100-304] - 53BP1 cofractionates with lamins A/C in HDF. (A) HDF were treated with IR (5 Gy, 1 h) & fractionated by sequential treatments of detergent (CSK/T) & DNase I. Extracts were then processed for immunoblotting using the indicated antibodies. WCE, whole cell extract. P, pellet; S, supernatant. (B) HDF were treated with IR (2 Gy; 1 h) & extracted in situ with CSK/T followed by DNase I digestion before being processed for immunofluorescence using lamin A/C & 53BP1 antibodies. Scale bar, 10 μm. Image collected & cropped by CiteAb from the following publication (https://pubmed.ncbi.nlm.nih.gov/25645366), licensed under a CC-BY license. Not internally tested by Novus Biologicals.
Immunocytochemistry/ Immunofluorescence: 53BP1 Antibody - BSA Free [NB100-304] -
Immunocytochemistry/ Immunofluorescence: 53BP1 Antibody - BSA Free [NB100-304] - Depletion of Ajuba results in activation of the DNA damage response. (A) Staining for p53BP1 foci on cells fixed 72 h after transfection with siRNA #3, & siGFP as a negative control. Quantification of the number of p53BP1 foci on three independent siRNA experiments shown in (B). (C, D) Western blots for induction of Chk1 phosphorylation & induction of p53 phosphorylation, showed for the three target sites, 72 h after siRNA transfection. Image collected & cropped by CiteAb from the following publication (https://pubmed.ncbi.nlm.nih.gov/23755068), licensed under a CC-BY license. Not internally tested by Novus Biologicals.
Immunocytochemistry/ Immunofluorescence: 53BP1 Antibody - BSA Free [NB100-304] -
Immunocytochemistry/ Immunofluorescence: 53BP1 Antibody - BSA Free [NB100-304] - Depletion of PNUTS & NPAT induces a global DDR.(A) Induction of telomere dysfunction–induced foci (TIF) upon candidate knockdown in HeLa cells from Fig 5. Depletion of TRF2 was used as a positive control. 53BP1 was detected by indirect IF & telomeres by FISH with a Cy3-[CCCTAA]3 probe. (B) Frequency distribution of the number of TIFs per cell from (A). n indicates the number of cells analyzed for each condition & red lines mark the mean. Image collected & cropped by CiteAb from the following publication (https://pubmed.ncbi.nlm.nih.gov/30456372), licensed under a CC-BY license. Not internally tested by Novus Biologicals.
Western Blot: 53BP1 Antibody - BSA Free [NB100-304] -
Western Blot: 53BP1 Antibody - BSA Free [NB100-304] - HPV+ HNSCCs have decreased expression of NHEJ & HR proteins including DNA-Pk & BRCA2Cells were treated with mock or 4 Gy radiation, harvested & lysed at 15 minutes post-treatment, & analyzed by western blot for relative expression of indicated proteins. beta -actin was used as a loading control. Shown is a representative blot from 2 independent experiments. Image collected & cropped by CiteAb from the following publication (https://pubmed.ncbi.nlm.nih.gov/26336991), licensed under a CC-BY license. Not internally tested by Novus Biologicals.
Immunocytochemistry/ Immunofluorescence: 53BP1 Antibody - BSA Free [NB100-304] -
Immunocytochemistry/ Immunofluorescence: 53BP1 Antibody - BSA Free [NB100-304] - Spontaneous DNA breakage in G1-phase cells: GamGFP shows large spontaneous G1 53BP1 foci to contain multi-break clusters.The large spontaneous 53BP1 foci in undamaged cells, which occur solely in G1 (Harrigan et al., 2011;Lukas et al., 2011a), contain multiple DSBs that are marked by GamGFP. The GamGFP-53BP1 co-localization is more apparent in the absence of Ku. Data are from three (Ku80-proficient) or four (Ku80-defective) independent experiments of >25 cells each with Z-stacked (optically sectioned) nuclei.DOI:http://dx.doi.org/10.7554/eLife.01222.017 Image collected & cropped by CiteAb from the following publication (https://elifesciences.org/articles/01222), licensed under a CC-BY license. Not internally tested by Novus Biologicals.
Immunocytochemistry/ Immunofluorescence: 53BP1 Antibody - BSA Free [NB100-304] -
Immunocytochemistry/ Immunofluorescence: 53BP1 Antibody - BSA Free [NB100-304] - 53BP1 cofractionates with lamins A/C in HDF. (A) HDF were treated with IR (5 Gy, 1 h) & fractionated by sequential treatments of detergent (CSK/T) & DNase I. Extracts were then processed for immunoblotting using the indicated antibodies. WCE, whole cell extract. P, pellet; S, supernatant. (B) HDF were treated with IR (2 Gy; 1 h) & extracted in situ with CSK/T followed by DNase I digestion before being processed for immunofluorescence using lamin A/C & 53BP1 antibodies. Scale bar, 10 μm. Image collected & cropped by CiteAb from the following publication (https://pubmed.ncbi.nlm.nih.gov/25645366), licensed under a CC-BY license. Not internally tested by Novus Biologicals.
Western Blot: 53BP1 Antibody - BSA Free [NB100-304] -
Western Blot: 53BP1 Antibody - BSA Free [NB100-304] - 53BP1 focus formation. (A) Bars indicate the mean ± standard error of 53BP1 focus-forming cells in three independent control & three independent Asciz−/− primary MEF cultures under basal conditions (open bars), in response to 24-h aphidicolin treatment (black bars) & following 30 min recovery after ionizing radiation (grey bars). More detailed quantifications of foci/cell are shown in Supp. Fig. S2. (B) Subcelllular distribution of 53BP1 in cell fractionation assays. M601 is used as a mitochondrial marker, & tubulin as a cytosolic marker. Image collected & cropped by CiteAb from the following publication (https://linkinghub.elsevier.com/retrieve/pii/S1568786417301349), licensed under a CC-BY license. Not internally tested by Novus Biologicals.
Immunocytochemistry/ Immunofluorescence: 53BP1 Antibody - BSA Free [NB100-304] -
Immunocytochemistry/ Immunofluorescence: 53BP1 Antibody - BSA Free [NB100-304] - hsRAD51-II3A expressing cells accumulate 53BP1 foci after treatment with HU. Representative images depicting 53BP1 foci (green) in PCNA (red) positive cells after the indicated treatments. DNA is stained in blue. Scale bar = 10 μm. Dot plot depicts quantitation of 53BP1 foci after indicated treatments. Data is combined data consisting of at least 100 nuclei from two independent experiments. Red line represents the mean. Values are presented as mean ± SD. Statistical significance was determined using the Mann–Whitney U test. Source data are provided as a source data file Image collected & cropped by CiteAb from the following publication (https://pubmed.ncbi.nlm.nih.gov/31562309), licensed under a CC-BY license. Not internally tested by Novus Biologicals.
Immunocytochemistry/ Immunofluorescence: 53BP1 Antibody - BSA Free [NB100-304] -
Immunocytochemistry/ Immunofluorescence: 53BP1 Antibody - BSA Free [NB100-304] - Persistent DNA damage exists in ALT cells. (A) IF-FISH showing DNA damage response (53BP1) in ALT (VA13, U2OS, SAOS2, SKLU-1), telomerase positive (MCF7, A549), & human normal fibroblast cells (MRC5, BJ). Scale bar: 10 μm. (B) Quantification of (A). Data represent the mean ± SEM, n = 3. More than 100 cells were counted for each experiment. (C) FACS analysis of apoptosis in cells listed in (A). (D) Quantification of (C). Data represent the mean ± SEM, n = 3. (E) Proliferation of p53-positive (VA13, U2OS) & p53-defictive (SAOS2, SKLU-1) ALT cells. (F) Western blot showing activation of JNK (phosphorylation) & accumulation of c-myc in ALT cells. Human normal BJ cells were used as a control Image collected & cropped by CiteAb from the following publication (https://pubmed.ncbi.nlm.nih.gov/31115790), licensed under a CC-BY license. Not internally tested by Novus Biologicals.
Immunocytochemistry/ Immunofluorescence: 53BP1 Antibody - BSA Free [NB100-304] -
Immunocytochemistry/ Immunofluorescence: 53BP1 Antibody - BSA Free [NB100-304] - LNCaP cells in culture were treated for 24 hrs with DMSO or ENZ, then irradiated with 0 or 1 Gy.Cell were fixed & immunostained for 53BP1 0.5, 1.5 & 24 hrs after irradiation. Immunofluorescent images were obtained by confocal microscopy. White bar = 20 microns. A) DMSO alone, B) ENZ alone, C) 1 Gy, D) ENZ + 1 Gy. White bar = 20 microns. Image collected & cropped by CiteAb from the following publication (https://pubmed.ncbi.nlm.nih.gov/30933998), licensed under a CC-BY license. Not internally tested by Novus Biologicals.
Immunocytochemistry/ Immunofluorescence: 53BP1 Antibody - BSA Free [NB100-304] -
Immunocytochemistry/ Immunofluorescence: 53BP1 Antibody - BSA Free [NB100-304] - IMR90 cells depleted for Ajuba undergo a DNA damage response. (A,C,D) Western blots for Ajuba, Cyclin A, Rb, Chk1 phosphorylation, & PARP cleavage on lysates prepared from IMR90 cells 72 h after transfection with siRNA #3. The loading controls with GAPDH for each blot are shown. (B) Staining for p53BP1 in Ajuba-depleted cells (siRNA#3), with siGFP as a control. Image collected & cropped by CiteAb from the following publication (https://pubmed.ncbi.nlm.nih.gov/23755068), licensed under a CC-BY license. Not internally tested by Novus Biologicals.
Western Blot: 53BP1 Antibody - BSA Free [NB100-304] -
Western Blot: 53BP1 Antibody - BSA Free [NB100-304] - DYNLL1 is required for 53BP1-dependent p53 responses to Nutlin-3. a Immunoblot analysis of the MCF-7 cell lines used in (a) with anti-53BP1 or anti-RPA32 antibodies prior to N3 treatment. b Quantification of n = 3 independent experiments represented in (a), each performed in triplicate. Mean ± SD. c Indicated parental or stably complemented 53BP1-/- MCF-7 cell lines were incubated in the presence (11 days) or absence (7 days) of Nutlin-3 (4 µM) Image collected & cropped by CiteAb from the following publication (https://pubmed.ncbi.nlm.nih.gov/30559443), licensed under a CC-BY license. Not internally tested by Novus Biologicals.
Immunocytochemistry/ Immunofluorescence: 53BP1 Antibody - BSA Free [NB100-304] -
Immunocytochemistry/ Immunofluorescence: 53BP1 Antibody - BSA Free [NB100-304] - RNA:DNA hybrids promote 53BP1 foci formation.(a) Immunofluorescence using the anti-flag & anti-53BP1 antibody in cells expressing Flag-tagged hybrid-binding (HB) domain or flag-tagged active RNaseH1. 53BP1 foci were quantified in cells expressing HB-domain or RNaseH1. Column bars represent the mean of n number of cells (described on each column), from three independent experiments. Error bars represent SEM. *P ≤ 0.05; **P < 0.01, ***P < 0.001 using the Kruskal-Wallis test followed by Dunn’s post hoc test. (b) Higher zoom representative images show HB-domain & 53BP1 co-localization, specifically in the euchromatin area. Image collected & cropped by CiteAb from the following publication (https://pubmed.ncbi.nlm.nih.gov/30345028), licensed under a CC-BY license. Not internally tested by Novus Biologicals.
Immunocytochemistry/ Immunofluorescence: 53BP1 Antibody - BSA Free [NB100-304] -
Immunocytochemistry/ Immunofluorescence: 53BP1 Antibody - BSA Free [NB100-304] - General chromatin effects of A∆rod & A∆rod∆hbs. (a) DNA staining (DAPI) in U2OS cells expressing A∆rod. Chromatin staining tended to be stronger on or around lamin A∆rod structures. (b) pRb is a known binding partner of lamin A, & so, it was co-stained as a positive control, revealing strong co-localization with the A∆ structures. (c) No co-localization between A∆rod structures & 53BP1 in HeLa cells indicates that chromatin is not damaged by the structures. (d) Similarly, gamma H2AX did not accumulate on A∆ structures. Image collected & cropped by CiteAb from the following publication (http://www.mdpi.com/2073-4409/6/2/9), licensed under a CC-BY license. Not internally tested by Novus Biologicals.
Immunocytochemistry/ Immunofluorescence: 53BP1 Antibody - BSA Free [NB100-304] -
Immunocytochemistry/ Immunofluorescence: 53BP1 Antibody - BSA Free [NB100-304] - UFL1 regulates the ATM signaling. a U2OS cells expressing UFL1 tet-on shRNA1 were irradiated with 2 Gy IR. Thirty minutes later, cells were lysed & blotted with indicated antibodies. b Representative picture of gamma H2AX, 53BP1, & BRCA1 foci in control (Dox-) & UFL1 knockdown (Dox+) U2OS cells 1 h after 0.5 Gy treatment. Scale bars, 10 µm. c–e Quantification of intensities of gamma H2AX, 53BP1, & BRCA1 foci in control (Dox-) & UFL1 knockdown (Dox+) U2OS cells. Data presented as mean ± SD of n = 50 cells. **p < 0.01 by Student’s t-test. Source data are provided as a Source Data file Image collected & cropped by CiteAb from the following publication (https://pubmed.ncbi.nlm.nih.gov/30886146), licensed under a CC-BY license. Not internally tested by Novus Biologicals.
Immunocytochemistry/ Immunofluorescence: 53BP1 Antibody - BSA Free [NB100-304] -
Immunocytochemistry/ Immunofluorescence: 53BP1 Antibody - BSA Free [NB100-304] - The DNA damage response at telomeres uncapped through TRF2 depletion does not require BRCA1 or CtIPImmortalized Brca1F/− MEFs were infected with retroviruses expressing the indicated shRNAs and/or Cre recombinase, followed by selection with puromycin for 72 h. Cell extracts were prepared 48 h later & analysed by Western blotting as indicated. SMC1 & tubulin were used as loading controls. *non-specific band.Cells treated as in (A) were fixed 48 h after selection & stained with an anti-53BP1 antibody (green). Telomeres were visualized with a Cy3-conjugated (CCCTAA)3-PNA probe (red). Yellow arrowheads point to 53BP1 foci that co-localize with telomeres.Quantification of TIFs in cells treated as in (B). A minimum of 200 nuclei were scored for each sample. Error bars represent SD of two independent experiments. P-values were calculated using an unpaired two-tailed t-test. *P ≤ 0.05; NS, P > 0.05. Image collected & cropped by CiteAb from the following publication (https://pubmed.ncbi.nlm.nih.gov/25582120), licensed under a CC-BY license. Not internally tested by Novus Biologicals.
Western Blot: 53BP1 Antibody - BSA Free [NB100-304] -
Western Blot: 53BP1 Antibody - BSA Free [NB100-304] - Hypoxia causes DNA damage in patient-derived colonosphere cultures in vitro(a) Two independent patient-derived colonospheres were cultured in normoxia (21%) or hypoxia (0.1%) for 24 hours. Immunofluorescence was then used to asses gamma H2AX (green) in the nuclei DAPI (blue). (b) Bar graphs showing the quantification of gamma H2AX observed in (a) (n=3), shown as percentage of the mean gamma H2AX intensity at normoxia. (c) Representative confocal pictures of the comet assay of colonospheres cultured as in (a). (d) Bar graphs showing the quantification of DNA damage observed with the comet assay (Extend tail moment) (n=73). (e) Colonospheres were cultured as in (a) & gamma H2AX was assessed by FACS. The plots show normoxic gamma H2AX levels in red & hypoxic gamma H2AX levels in blue in two independent cell lines. (f) Human colonospheres were exposed to hypoxia for the indicated periods of time. Cell lysates were then analyzed by Western blotting for the indicated markers (cropped). Image collected & cropped by CiteAb from the following publication (https://www.oncotarget.com/lookup/doi/10.18632/oncotarget.21145), licensed under a CC-BY license. Not internally tested by Novus Biologicals.
Immunocytochemistry/ Immunofluorescence: 53BP1 Antibody - BSA Free [NB100-304] -
Immunocytochemistry/ Immunofluorescence: 53BP1 Antibody - BSA Free [NB100-304] - TRF1HP1 alpha results in reduced TIFs induced by mutant hTR expression. Cells stably expressing TRF1HP1 alpha (WT or mutant variants of HP1 alpha ) were infected with lentivirus containing WT hTR, or mutant hTR (47A or TSQ1) on day 0, selected for stable expression after 48 h, & analyzed on day 5. a Fluorescence microscopy images of representative cells expressing mutant hTR 47A stained with telomeric (Tel-Cy3) peptide nucleic acid (PNA) probes (magenta in merged image) via fluorescent in situ hybridization (FISH), antibody against DNA-damage repair protein marker 53BP1 (green in merged image), & counterstained with DAPI. Zoom-in images (the last row) correspond to yellow-squared regions of the row above. b % TIF per telomere of each nucleus is quantified; n = 94–159 nuclei combining data of three independent experiments. ****p < 0.0001; n.s. (no significance). a, b Scale bar: 10 µm. c Upon TSQ1 expression, TRF1HP1 alpha results in fewer TIFs compared to Vonly, TRF1 or HP1 alpha controls. TRFHP1 alpha ~11.4% shows decreased TIFs compared to Vonly: ~19.7% ***p = 0.0008; TRF1: ~20.4% ***p = 0.0005; HP1 alpha : ~17.9% *p = 0.0137 (n = 30–38 nuclei). b, c Significance is assessed by one-way ANOVA & Dunnett’s multiple comparison test with 95% confidence level. d Fluorescence images of control cells overexpressing WT hTR (n = 27–36 nuclei). Same color scheme as a. TIFs quantification in the presence of e WT hTR or f Vonly (n = 28–36 nuclei) show minimal baseline DNA damage at telomeres. b, c; e, f Error bars represent s.e.m. Image collected & cropped by CiteAb from the following publication (https://pubmed.ncbi.nlm.nih.gov/30181605), licensed under a CC-BY license. Not internally tested by Novus Biologicals.
Immunocytochemistry/ Immunofluorescence: 53BP1 Antibody - BSA Free [NB100-304] -
Immunocytochemistry/ Immunofluorescence: 53BP1 Antibody - BSA Free [NB100-304] - Absence of Roma Leads to Activation of the DNA Damage Response & Genomic Instability(A) Representative immunofluorescence analysis of RPA2-pT21, gamma H2AX, & 53BP1 foci in tissue sections from WT & Roma−/− glands at 10dL. The white arrow indicates nucleolar gamma H2AX. Scale bars, 10 μm. The higher magnification panels on the right have been chosen to highlight the foci & are not zoomed images of the left panels.(B) Immunoblot analysis of cell-cycle checkpoint & DNA damage response in extracts from WT & Roma−/− glands at 10dL. Extracts from U2OS cells treated with 5mM HU were used as a damage control.(C) PCR analysis of p21Cip1 & MDM2 & quantitative real-time PCR analysis of p21Cip1 in extracts from 10dL WT & Roma−/− glands (p = 0.0007, Student’s t test).(D) Representative spectral karyotypes (top) & metaphase spreads (bottom panel) prepared from MECs isolated from WT & Roma−/− glands after a full natural wean.See also Figure S2. Image collected & cropped by CiteAb from the following publication (https://pubmed.ncbi.nlm.nih.gov/27149840), licensed under a CC-BY license. Not internally tested by Novus Biologicals.
Immunocytochemistry/ Immunofluorescence: 53BP1 Antibody - BSA Free [NB100-304] -
Immunocytochemistry/ Immunofluorescence: 53BP1 Antibody - BSA Free [NB100-304] - A-T post-mitotic neurons are defective in DDR. In a, D30 post-mitotic neurons (D30) were tested by western blot with antibodies specific for the various ATM phosphosubstrates & cleaved PARP at various times after treatment with 5 Gy IR. beta -Actin was used as a loading control. DNA SSBs (b) & DSBs (c) were analyzed in neurons (D30) by alkaline & neutral comet assay, respectively, at two different times after treatment. 20 min after H2O2 or IR treatment was considered the time point with the maximum DNA damage. In b & c, representative photos of comets from untreated cells & at different time points following treatment. The ratio between treated & untreated tail moments of at least 50–70 cells per experimental point is shown in the graphs (values in %). One representative experiment out of three is shown. In d & e, formation & resolution of IR-induced nuclear foci. Neurons (D30) were irradiated with 0.5 Gy, collected at the indicated times & labeled for gamma -H2AX (d) & 53BP1 (e). For each treatment, the number of foci was scored from 100 cell nuclei per duplicate preparations & from three independent experiments (mean±S.D.) (d & e, bottom) For each time point, the difference between Ctrl & A-T was statistically significant (#P<0.01) (analysis performed by the Student's t-test) Image collected & cropped by CiteAb from the following publication (https://pubmed.ncbi.nlm.nih.gov/25032865), licensed under a CC-BY license. Not internally tested by Novus Biologicals.
Immunocytochemistry/ Immunofluorescence: 53BP1 Antibody - BSA Free [NB100-304] -
Immunocytochemistry/ Immunofluorescence: 53BP1 Antibody - BSA Free [NB100-304] - Exposure to radiation induces persistent genomic instability.(a) Time course of micronucleus frequency in binucleated cells exposed to 1Gy X-rays or Fe ions (average of two independent irradiations, error bars represent SEM). Paired Student's t-test, *p<0.05, **p<0.01. (b) Time course of gamma H2AX- 53BP1 positive foci per cell distribution in a population of 50 cells per condition following exposure to 1Gy of the indicated radiation. One of two experiments is shown. Chi-Square test NI vs. X-rays or Fe ions. day 7 & day 14 p<0.001. Day 21 p>0.05. (c) Immunofluorescence staining of gamma H2AX-53BP1 positive foci 7 days following exposure to 1Gy of the indicated radiation type. Scale bar is 10 µm. (d) Immunofluorescence staining for BrdU & 53BP1 7 days following exposure to 1Gy Fe ions. Scale bar is 10 µm. The graph represents the average of scoring in 5 different fields a total of 70 cells. Image collected & cropped by CiteAb from the following publication (https://dx.plos.org/10.1371/journal.pone.0108234), licensed under a CC-BY license. Not internally tested by Novus Biologicals.
Immunocytochemistry/ Immunofluorescence: 53BP1 Antibody - BSA Free [NB100-304] -
Immunocytochemistry/ Immunofluorescence: 53BP1 Antibody - BSA Free [NB100-304] - SPOC1 is recruited to I-SceI-induced DSBs where it colocalizes with 53BP1. (A) In situ immunofluorescence studies with U2OS19 ptight13 GFP-LacR cells with a stably integrated I-SceI cleavage site flanked by lac operator repeats reveals localization of the GFP-lac repressor protein (GFP-LacR) at the lac-operator DNA sequences in the nucleus before (−I-SceI) & 16 h after I-SceI-induced (+ I-SceI) DSB. In contrast, SPOC1 (white) & 53BP1 (red) are distributed throughout the nucleus in the absence of I-Scel, & partially colocalized in naturally occurring repair foci. After I-SceI cleavage to generate DSBs, SPOC1 & 53BP1 colocalize at distinct foci, including the cleaved DNA adjacent to DNA-bound GFP-LacR. Proteins were visualized by immunostaining & confocal microscopy. Scale bars = 10 μm. (B) Quantitative analysis of SPOC1 recruitment to the 53BP1 & GFP-LacR positive lacO array before & 16 h after I-SceI induction. (C) Monitoring of the kinetics of SPOC1 & 53BP1 recruitment to DSBs between 0 & 24 h post-I-SceI induction. (D) Quantifying ATM kinase inhibitor-mediated effects on recruitment of SPOC1 & 53BP1 to DSBs as evident 16 h after I-SceI-induced cleavage. (E) SPOC1 & 53BP1 colocalize at a large discrete endogenous repair focus as observed in some non-irradiated U2OS cells by immunostaining. Scale bar = 10µm. Image collected & cropped by CiteAb from the following publication (https://academic.oup.com/nar/article-lookup/doi/10.1093/nar/gks868), licensed under a CC-BY license. Not internally tested by Novus Biologicals.
Western Blot: 53BP1 Antibody - BSA Free [NB100-304] -
Western Blot: 53BP1 Antibody - BSA Free [NB100-304] - A-type lamin depletion inhibits DNA repair & reduces cellular fitness to DNA damage. (A) Wild-type (WT) or Y259X HDF treated w/ proteasome inhibitor MG-132 (30 μm). Cell extracts prepared & levels of 53BP1 assessed by immunoblotting. beta -tubulin a loading control. WCE, whole cell extract. The relative levels of 53BP1 expressed relative to levels of untreated WT HDF (1.00). In untreated Y259X cells, 53BP1 levels fell to 15% & restored to ∽50% following treatment w/ MG-132. (B) Cell extracts prepared from WT & Y259X HDF & assessed by immunoblotting w/ indicated antibodies. Shown is a representative set of blots from two independent experiments. (C) WT & Y259X HDF biochemically extracted into cytoplasmic & nuclear fractions before immunoblotting for levels of 53BP1. (D) HDF & Y259X cells treated w/ IR (3 Gy), fixed at the times indicated & stained w/ gamma -H2AX antibody. The number of gamma -H2AX foci at each time point quantified & data represents the mean ± SD from 3 independent experiments. (E) U2OS cells transfected w/ siCTRL or siLMNA siRNA & plated onto 60-mm dishes. The cells then exposed to varying doses of IR & fixed 12 days later in a solution containing crystal violet. The surviving fraction at each IR dose calculated based on the plating efficiency of untreated plates. Data represent the mean ± SD from 3 independent experiments. (F) HDF or Y259X cells treated w/ DMSO or KU55933 ATM inhibitor (10 μm) before exposure to indicated doses of IR then fixed, processed & stained w/ gamma -H2AX antibody. Residual gamma -H2AX foci enumerated & the data represent the mean ± SD from 3 independent experiments. (G) HDF or Y259X cells exposed to IR, briefly extracted w/ CSK buffer & processed for IF w/ gamma -H2AX & pKAP-1 antibodies. Scale bar, 10 μm. Image collected & cropped by CiteAb from the following publication (https://pubmed.ncbi.nlm.nih.gov/25645366), licensed under a CC-BY license. Not internally tested by Novus Biologicals.
Immunocytochemistry/ Immunofluorescence: 53BP1 Antibody - BSA Free [NB100-304] -
Immunocytochemistry/ Immunofluorescence: 53BP1 Antibody - BSA Free [NB100-304] - TRF2/Terc double null mutation induces DNA damage response resulting in terminal differentiation of metastatic tumorsHistopathology of primary SCC from K14Cre;TRF2+/+;Terc+/+ A. & K14Cre;TRF2f/f;Terc-/- C. mice is shown by H&E staining. Scale bar = 10 μm. Histopathology of metastatic SCC from K14Cre;TRF2+/+;Terc+/+ B. & K14Cre;TRF2f/f;Terc-/- D., E. mice is shown by H&E staining. Scale bar in (D) = 50 μm. Apoptotic cells in primary SCC from K14Cre;TRF2+/+;Terc+/+ F. & K14Cre;TRF2f/f;Terc-/- G. mice are shown by TUNEL assay. Scale bar = 10 μm. Proliferating cells were detected in K14Cre;TRF2+/+;Terc+/+ H. & K14Cre;TRF2f/f;Terc-/- I. primary SCC by PCNA immunohistochemistry & quantitated in J.. Error bars indicate SEM. Asterisk indicates statistically significant difference. Co-localization of 53BP1 (shown by immunofluorescence, AlexaFluor 488) at telomeres (shown by fluorescence in situ hybridization, Cy3) in histopathologic sections from K14Cre;TRF2+/+;Terc+/+ K. & K14Cre;TRF2f/f;Terc-/- L. primary SCC & quantitated in M. Error bars indicate SEM. Nuclei were counterstained with DAPI. Scale bar = 5 μm. N. Average telomere length ratios in CD34+ stem, Lgr6+ stem, & basal cells from K14Cre;TRF2+/+;Terc+/+ & K14Cre;TRF2f/f;Terc-/- primary SCC were determined by qPCR. Error bars represent SEM. O. Phospho-ATM, phospho-Chk2, & p53 expression in K14Cre;TRF2+/+;Terc+/+ & K14Cre;TRF2f/f;Terc-/- primary SCC is shown by western blot. beta -actin expression was used to control for equal loading of each lane. Representative blots are shown. Image collected & cropped by CiteAb from the following publication (https://pubmed.ncbi.nlm.nih.gov/29113290), licensed under a CC-BY license. Not internally tested by Novus Biologicals.
Immunocytochemistry/ Immunofluorescence: 53BP1 Antibody - BSA Free [NB100-304] -
Immunocytochemistry/ Immunofluorescence: 53BP1 Antibody - BSA Free [NB100-304] - Increased Neurogenesis in the Absence of INK4a/ARF Expression Is Independent of Apoptosis & Microglial Activation(A) Quantification of the number of apoptotic cells, as detected by TUNEL, in the DG 6 hr following exposure of WT, ink4a/arf-deficient (INK4a/ARF KO), & p53-deficient (p53 KO) mice to 6 Gy cranial IR. Indicated is the average number of apoptotic cells per DG section (n = 4 mice per group).(B) Quantification of CD68 expression in the DG 24 hr following exposure of mice to IR.(C) Representative confocal images showing CD68+ cells (in red) next to apoptotic TUNEL+ cells (in green) following exposure of WT mice to IR. Note the increase in CD68 signal & side by side localization of CD68+ & TUNEL+ cells following IR.(D–F) Proportion of neurons (NeuN, in green), young neurons (DCX, in green), & progenitor cells (Sox2, in green) showing persistent DNA damage foci (53BP1, in red) in the hippocampus of mice sacrificed 8 weeks post exposure to IR. Nuclei were stained with DAPI.(G) Representative confocal images of brain sections from irradiated WT mice displaying 53BP1 DNA damage foci with the indicated cell markers are shown. Images were acquired by a Leica microsystems TSC SP8 HyVolution confocal microscope & an HC PL APO CS2 40×/1.3 oil objective. The p values (∗p < 0.05; ∗∗∗p < 0.001) were obtained by performing a Student's t test. ND (no cells were detected). Image collected & cropped by CiteAb from the following publication (https://linkinghub.elsevier.com/retrieve/pii/S2213671118301528), licensed under a CC-BY license. Not internally tested by Novus Biologicals.
Immunocytochemistry/ Immunofluorescence: 53BP1 Antibody - BSA Free [NB100-304] -
Immunocytochemistry/ Immunofluorescence: 53BP1 Antibody - BSA Free [NB100-304] - GamGFP marks DSBs in mammalian cells & is inhibited by Ku.(A) GamGFP co-localizes with 53BP1 on laser-induced DNA breaks. (B) Ku inhibits recruitment of GamGFP to laser-induced damage, live cells. (C & D) Ku inhibits recruitment of GamGFP, fixed cells. Mean ± SEM of three experiments, n >25 cells each. (E) GamGFP forms IR-induced foci in Ku80-defective MEFs. (F) Zoomed image from E. (G) IR-induced foci containing Gam only, 53BP1 only or both Gam & 53BP1 (>2600 total foci counted in three independent experiments). Error bars, SEM. Scale bars = 5 μm.DOI:http://dx.doi.org/10.7554/eLife.01222.012GamGFP marks DSBs in mammalian cells.(A) Live analysis of GamGFP localization to laser-induced DNA damage. Hela cells producing GamGFP were laser damaged along the cell track indicated by the red line at 0 min (m) & images were taken at the indicated times as shown. (B) GamGFP co-localizes with gamma H2AX in fixed Hela cells.DOI:http://dx.doi.org/10.7554/eLife.01222.013Ku inhibits GamGFP recruitment at DSBs independently of non-homologous end joining.Cells lacking either Ku80 or LigIV are defective in non-homologous end joining (NHEJ), yet the presence of Ku still inhibits recruitment of GamGFP to laser-induced DSBs even in NHEJ-defective cells, & thus independently of the cell's ability to complete NHEJ. Whereas it could have been possible that reduced GamGFP recruitment in the presence of Ku was caused by reduced persistence of DSBs due to their repair by NHEJ, our data show instead that Ku inhibits recruitment independently of successful NHEJ & imply that Ku binding to DSEs itself is inhibitory.DOI:http://dx.doi.org/10.7554/eLife.01222.014 Image collected & cropped by CiteAb from the following publication (https://elifesciences.org/articles/01222), licensed under a CC-BY license. Not internally tested by Novus Biologicals.
Immunocytochemistry/ Immunofluorescence: 53BP1 Antibody - BSA Free [NB100-304] -
Immunocytochemistry/ Immunofluorescence: 53BP1 Antibody - BSA Free [NB100-304] - Loss of functional PRPF31 induce RNA:DNA hybrid dependent genomic instability but not in mice retinal neurons.(a andb) gamma H2AX & 53BP1 foci analysis in PRPF31 siRNA-transfected RPE-1 cells. (c & d) gamma H2AX & 53BP1 foci analysis in vasculo-stromal fraction derived primary cells fromPrpf31+/A216P mice (Prpf31-ki). (e) gamma H2AX & 53BP1 foci analysis in retina fromPrpf31+/A216P mice on postnatal day 20. All column bars represent the mean. For (a-d) “n”, mentioned on respective column, signify number of cells analyzed from two independent experiments. For (e) n=16 for each column & signify number of retinal sections analyzed; acquired from n=4 eyes. Error bars represent Standard error of Mean (SEM). *P≤0.05; **P<0.01, ***P<0.001 using Mann-Whitney test (a,b), Kruskal-Wallis test followed by Dunn’s post hoc test (c,d); & two tailed unpaired Student’s t-test (e). Image collected & cropped by CiteAb from the following publication (https://pubmed.ncbi.nlm.nih.gov/30345028), licensed under a CC-BY license. Not internally tested by Novus Biologicals.
Western Blot: 53BP1 Antibody - BSA Free [NB100-304] -
Western Blot: 53BP1 Antibody - BSA Free [NB100-304] - Lamin A/C-53BP1 interaction is regulated in a DNA damage-dependent manner. (A) Left; HDF were subjected to IR (10 Gy) & allowed to recover for 1 h. Association between A-type lamins & 53BP1 was assessed by immunoprecipitation of endogenous lamin A/C followed by immunoblotting with 53BP1 & lamin A/C antibodies. WCE, whole cell extract, IP: immunoprecipitates. WCE represents 5% input. Right; endogenous lamin A/C was immunoprecipitated & supernatants or pellets were analysed by immunoblotting for interaction with JMJD2A. (B) U2OS/GFP-lamin A cells were pretreated with caffeine (20 mm) for 1 h before exposure to IR (10 Gy, 1 h recovery). Cell extracts were then subjected to immunoprecipitation using GFP-Trap beads, & bound complexes were then analysed by immunoblotting using 53BP1 & GFP antibodies. WCE represents 1% input. (C) As in (C) except cells were pretreated with 10 μm ATMi for 1 h before IR. WCE represents 1% input. (D) U2OS/GFP-lamin A cells were subjected to laser micro-irradiation, fixed 1 h later & immunostained with gamma -H2AX antibody. Scale bar, 10 μm. (E) U2OS cells were transfected with siCTRL or siLMNA & subjected to laser micro-irradiation, fixed 15 min later & then processed for immunofluorescence with gamma -H2AX & 53BP1 antibodies. Scale bar, 10 μm. Image collected & cropped by CiteAb from the following publication (https://pubmed.ncbi.nlm.nih.gov/25645366), licensed under a CC-BY license. Not internally tested by Novus Biologicals.
Immunocytochemistry/ Immunofluorescence: 53BP1 Antibody - BSA Free [NB100-304] -
Immunocytochemistry/ Immunofluorescence: 53BP1 Antibody - BSA Free [NB100-304] - SPOC1 is recruited to I-SceI-induced DSBs where it colocalizes with 53BP1. (A) In situ immunofluorescence studies with U2OS19 ptight13 GFP-LacR cells with a stably integrated I-SceI cleavage site flanked by lac operator repeats reveals localization of the GFP-lac repressor protein (GFP-LacR) at the lac-operator DNA sequences in the nucleus before (−I-SceI) & 16 h after I-SceI-induced (+ I-SceI) DSB. In contrast, SPOC1 (white) & 53BP1 (red) are distributed throughout the nucleus in the absence of I-Scel, & partially colocalized in naturally occurring repair foci. After I-SceI cleavage to generate DSBs, SPOC1 & 53BP1 colocalize at distinct foci, including the cleaved DNA adjacent to DNA-bound GFP-LacR. Proteins were visualized by immunostaining & confocal microscopy. Scale bars = 10 μm. (B) Quantitative analysis of SPOC1 recruitment to the 53BP1 & GFP-LacR positive lacO array before & 16 h after I-SceI induction. (C) Monitoring of the kinetics of SPOC1 & 53BP1 recruitment to DSBs between 0 & 24 h post-I-SceI induction. (D) Quantifying ATM kinase inhibitor-mediated effects on recruitment of SPOC1 & 53BP1 to DSBs as evident 16 h after I-SceI-induced cleavage. (E) SPOC1 & 53BP1 colocalize at a large discrete endogenous repair focus as observed in some non-irradiated U2OS cells by immunostaining. Scale bar = 10µm. Image collected & cropped by CiteAb from the following publication (https://academic.oup.com/nar/article-lookup/doi/10.1093/nar/gks868), licensed under a CC-BY license. Not internally tested by Novus Biologicals.
Immunocytochemistry/ Immunofluorescence: 53BP1 Antibody - BSA Free [NB100-304] -
Immunocytochemistry/ Immunofluorescence: 53BP1 Antibody - BSA Free [NB100-304] - Comparative kinetics of 53BP1 & SPOC1 recruitment to radiomimetic drug NCS-induced DSBs. U2OS cells fixed before (mock) or at the indicated times post-treatment (+NCS), immunostained for SPOC1 (green) & 53BP1 (red) & analyzed by confocal microcopy. At the earliest observation period after NCS treatment (15 min) a large number of small 53BP1 stained DSB repair foci emerged, but were not detectably stained by SPOC1. Between 2 to 24 h post-NCS treatment the number of small 53BP1 stained foci gradually, then almost completely disappeared, concomitant with emerging larger repair foci. At around 8 h post-NCS treatment most of the large 53BP1-stained repair foci were also strongly stained by SPOC1, suggesting SPOC1 is recruited to & accumulates at DSBs in heterochromatin known for their slow repair kinetics. Scale bars = 10µm. Image collected & cropped by CiteAb from the following publication (https://academic.oup.com/nar/article-lookup/doi/10.1093/nar/gks868), licensed under a CC-BY license. Not internally tested by Novus Biologicals.
Immunocytochemistry/ Immunofluorescence: 53BP1 Antibody - BSA Free [NB100-304] -
Immunocytochemistry/ Immunofluorescence: 53BP1 Antibody - BSA Free [NB100-304] - RNA:DNA hybrid formation is central to ATM-53BP1 repair pathway.(a) Immunofluorescence using the anti-flag to quantify nuclear hybrid-binding (HB) domain foci signal in pre-permeabilized RPE cells & quantification of HB domain signal in cells treated with siATM, (b) Western blot showing ATM depletion. (c) Immunofluorescence & HB-domain foci quantification in cells treated with ATM inhibitor. (d) Quantitation of gamma H2AX foci in cells expressing HB domain or active RNAseH1, in presence or absence of H2O2 dependent oxidative stress. siC, non-targeted control siLuciferease RNA. Column bars represent the mean of n number of cells (described on each column) from three independent experiments. Error bars represent SEM. *P ≤ 0.05; **P < 0.01, ***P < 0.001 using Mann-Whitney test (a,c) & Kruskal-Wallis test followed by Dunn’s post hoc test (d). Image collected & cropped by CiteAb from the following publication (https://pubmed.ncbi.nlm.nih.gov/30345028), licensed under a CC-BY license. Not internally tested by Novus Biologicals.
Immunocytochemistry/ Immunofluorescence: 53BP1 Antibody - BSA Free [NB100-304] -
Immunocytochemistry/ Immunofluorescence: 53BP1 Antibody - BSA Free [NB100-304] - UMI acidic residues are required for RNF168-mediated site-specific ubiquitination & the DDR.a Sequence alignment analysis of RNF168 UMI domains across species. The evolutionary conserved E143/E144 are highlighted in red. b Deletion of residues 143-144 attenuates 53BP1 IRIF formation. U2OS RNF168 KO cells were transiently transfected with GFP-RNF168 or RNF168 delta 143-144. Cells were irradiated with 10 Gy, allowed to recover for 1 h, followed by immunofluorescence analysis with indicated antibodies. Repeated three times with similar results. c Deletion of 143-144 abolishes RNF168-mediated ubiquitination. Co-transfection of GFP-RNF168 or mutant with Flag-H2AX K13/K15 only vector in HEK293T cells followed by western blot analysis. Repeated three times with similar results. d RNF168 delta 143-144 is recruited to laser damage. U2OS RNF168 KO cells expressing GFP-RNF168 & RNF168 delta 143-144 were damaged using a 405 nm laser source & analyzed 15 min later by confocal microscopy. Dotted line indicates the laser path. Repeated three times independently with similar results. e–f U2OS cells were transfected with GFP-RNF168 wildtype & mutants. Proximity ligation assay (PLA) was performed using specific antibodies against GFP & gamma H2AX. Mean intensity of PLA signals in GFP-positive cells were measured & analyzed using ImageJ software. Data presented as mean ± SD. One-way ANOVA, Dunn’s multiple comparison test was used in statistical analysis, wildtype vs. R57D P = 0.1455, wildtype vs. delta 143-144 P = 0.1589, R57D vs. delta 143-144, P > 0.9999, ****P < 0.0001 with 95% confidence interval. n = 75 (wildtype), 48 (R57D), 74 ( delta 143-144), 53 (R57D/ delta 143-144) over 3 independent experiments. Source data are provided as Source Data file. Image collected & cropped by CiteAb from the following publication (https://pubmed.ncbi.nlm.nih.gov/32424115), licensed under a CC-BY license. Not internally tested by Novus Biologicals.
Immunocytochemistry/ Immunofluorescence: 53BP1 Antibody - BSA Free [NB100-304] -
Immunocytochemistry/ Immunofluorescence: 53BP1 Antibody - BSA Free [NB100-304] - TRF2/Terc double null mutant mice exhibit DNA damage response at short telomeres in epidermisA. Average telomere length ratios in CD34+ stem, Lgr6+ stem, & basal cells from K14Cre;TRF2+/+;Terc+/+, K14Cre;TRF2f/f;Terc+/+, K14Cre;TRF2+/+;Terc-/-, & K14Cre;TRF2f/f;Terc-/- epidermis were determined by qPCR. Error bars represent SEM. Co-localization of 53BP1 (shown by immunofluorescence, AlexaFluor 488) at telomeres (shown by fluorescence in situ hybridization, Cy3) in histopathologic sections from K14Cre;TRF2+/+;Terc+/+ B., K14Cre;TRF2f/f;Terc-/- C., K14Cre;TRF2+/+;Terc-/- D., & K14Cre;TRF2f/f;Terc+/+ E. epidermis is shown. Nuclei are counterstained with DAPI. Scale bar = 5 μm. Phospho-ATM expression in histopathologic sections from K14Cre;TRF2+/+;Terc+/+ F., K14Cre;TRF2f/f;Terc-/- G., K14Cre;TRF2+/+;Terc-/- H., & K14Cre;TRF2f/f;Terc+/+ I. epidermis. Phospho-Chk2 expression in histopathologic sections from K14Cre;TRF2+/+;Terc+/+ J., K14Cre;TRF2f/f;Terc-/- K., K14Cre;TRF2+/+;Terc-/- L., & K14Cre;TRF2f/f;Terc+/+ M. epidermis. p53 protein expression in histopathologic sections from K14Cre;TRF2+/+;Terc+/+ N., K14Cre;TRF2f/f;Terc-/- O., K14Cre;TRF2+/+;Terc-/- P., & K14Cre;TRF2f/f;Terc+/+ Q. epidermis. Representative sections are shown. Image collected & cropped by CiteAb from the following publication (https://pubmed.ncbi.nlm.nih.gov/29113290), licensed under a CC-BY license. Not internally tested by Novus Biologicals.
Western Blot: 53BP1 Antibody - BSA Free [NB100-304] -
Western Blot: 53BP1 Antibody - BSA Free [NB100-304] - Vismodegib increases radiation-induced gamma H2AX/53BP1 nuclear foci. BCC-1 or SCC-25 cells were treated for 24 h with 10 or 40 µM vismodegib or with DMSO as control followed by irradiation with 4 Gy. (A) Representative images of phosphorylated gamma histone-2AX ( gamma H2AX)/p53-binding protein 1 (53BP1) foci from non-irradiated & 4 Gy-irradiated DMSO control versus 40 µM vismodegib-treated cells are shown. Nuclei were counterstained with DAPI. Scale bar, 10 µm. (B) Quantification of persistent gamma H2AX/53BP1 foci in vismodegib treated & irradiated BCC-1 (left panel) & SCC-25 (right panel) cells. Bars represent means + SD from three independent experiments performed in duplicate. ** p < 0.01 vismodegib- versus DMSO-treated cells & #p < 0.05, ##p < 0.01 4 Gy versus non-irradiated cells (t-test). Gy, Gray; Vism., vismodegib. Image collected & cropped by CiteAb from the following publication (https://pubmed.ncbi.nlm.nih.gov/30142876), licensed under a CC-BY license. Not internally tested by Novus Biologicals.
Western Blot: 53BP1 Antibody - BSA Free [NB100-304] -
Western Blot: 53BP1 Antibody - BSA Free [NB100-304] - The hypoxia-activated pro-drug Tirapazamine (TPZ) reduces stem-like Aldefluorbright population in vitro & in liver metastases(a) Human colonospheres cultured in hypoxia (0.1%) & normoxia (21%) for 24 hrs in absence or presence of TPZ for 4 hrs. Cells processed for IF analysis of gamma H2AX (green). DAPI (blue) used to visualize cell nuclei. (b) Bar graphs showing quantification of gamma H2AX foci observed in (a), shown as % of mean gamma H2AX intensity at normoxia (n=3). (c) Representative confocal pictures of comet assay of colonospheres cultured as in (a). (d) Bar graphs showing quantification of DNA damage observed w/ the comet assay (Extend tail moment) (n=77). (e) Experiment performed as in (a), but cells either treated or untreated for 16 hrs. Cells lysed & analyzed by WB for the indicated markers (cropped). (f) Colonospheres cultured in hypoxia & treated w/ TPZ for 16 hrs. The cells FACS sorted into Aldefluorbright & Aldefluordim populations & analyzed by WB for the indicated markers. (g) Human colonospheres cultured in hypoxia (0.1%) for 24 hrs in absence or presence of TPZ for 4 hrs & FACS sorted into Aldefluorbright & Aldefluordim populations. Bar graph the fold change Aldefluordim & Aldefluorbright cells upon TPZ treatment (n=3). (h) C26 tumor cells injected into liver parenchyma of immune-deficient mice. Following tumor initiation, tumor-bearing liver lobes subjected to a vascular clamping protocol [24] to induce hypoxia & treated w/ saline (control) or TPZ (treatment) for 10 days. At endpoint, livers excised & expression of ALDH1 examined by IHC. Magnification 20x, T=tumor. (i) Bar graphs showing quantification of ALDH1 (n=28) observed in (h) (n=14). * = significant (p>0.05). ns = not significant. Image collected & cropped by CiteAb from the following publication (https://www.oncotarget.com/lookup/doi/10.18632/oncotarget.21145), licensed under a CC-BY license. Not internally tested by Novus Biologicals.
Immunocytochemistry/ Immunofluorescence: 53BP1 Antibody - BSA Free [NB100-304] -
Immunocytochemistry/ Immunofluorescence: 53BP1 Antibody - BSA Free [NB100-304] - TRF1HP1 alpha results in reduced TIFs induced by mutant hTR expression. Cells stably expressing TRF1HP1 alpha (WT or mutant variants of HP1 alpha ) were infected with lentivirus containing WT hTR, or mutant hTR (47A or TSQ1) on day 0, selected for stable expression after 48 h, & analyzed on day 5. a Fluorescence microscopy images of representative cells expressing mutant hTR 47A stained with telomeric (Tel-Cy3) peptide nucleic acid (PNA) probes (magenta in merged image) via fluorescent in situ hybridization (FISH), antibody against DNA-damage repair protein marker 53BP1 (green in merged image), & counterstained with DAPI. Zoom-in images (the last row) correspond to yellow-squared regions of the row above. b % TIF per telomere of each nucleus is quantified; n = 94–159 nuclei combining data of three independent experiments. ****p < 0.0001; n.s. (no significance). a, b Scale bar: 10 µm. c Upon TSQ1 expression, TRF1HP1 alpha results in fewer TIFs compared to Vonly, TRF1 or HP1 alpha controls. TRFHP1 alpha ~11.4% shows decreased TIFs compared to Vonly: ~19.7% ***p = 0.0008; TRF1: ~20.4% ***p = 0.0005; HP1 alpha : ~17.9% *p = 0.0137 (n = 30–38 nuclei). b, c Significance is assessed by one-way ANOVA & Dunnett’s multiple comparison test with 95% confidence level. d Fluorescence images of control cells overexpressing WT hTR (n = 27–36 nuclei). Same color scheme as a. TIFs quantification in the presence of e WT hTR or f Vonly (n = 28–36 nuclei) show minimal baseline DNA damage at telomeres. b, c; e, f Error bars represent s.e.m. Image collected & cropped by CiteAb from the following publication (https://pubmed.ncbi.nlm.nih.gov/30181605), licensed under a CC-BY license. Not internally tested by Novus Biologicals.
Immunocytochemistry/ Immunofluorescence: 53BP1 Antibody - BSA Free [NB100-304] -
Immunocytochemistry/ Immunofluorescence: 53BP1 Antibody - BSA Free [NB100-304] - MRE11 poly(T)11/12 sequence variant has no apparent functional consequence on DNA damage detection & repair.(A) Electropherograms & sequencing traces of the MRE11 poly(T)11 tract in leukemia/lymphoma cells: Daudi (heterozygous insertion of one bp, poly(T)11/12); Jurkat (heterozygous deletion of one bp, poly(T)10/11); & Raji (wild-type, poly(T)11). (B) MRE11 expression in Daudi, Jurkat & Raji cells. qRT-PCR was used to calculate the ratio of MRE11 expression (amplification of exons 2 to 4) relative to the GAPDH control, independently of the presence of the aberrant transcript observed in Jurkat. PCR products were loaded on the gel at saturation of the reaction, being not quantitative. MRE11 protein levels were assessed by Western blot, & were considerably lower in Jurkat. (C) ATM-pS1981 levels were assessed by Western blot in Daudi, Jurkat & Raji after 1.5 Gy irradiation of cells & 1 h, 4 h or 24 h recovery. There was an increase of ATM phosphorylation 1 h after irradiation in Daudi & Raji cells that decreased at the later time points. Jurkat showed no ATM phosphorylation after exposure to irradiation. (D) DNA repair foci was observed by immunofluorescence after 1.5 Gy IR followed by 1 h & 4 h recovery. Irradiation resulted in the formation of both MRE11 & 53BP1 foci in Daudi & Raji cells, whereas Jurkat failed to form MRE11 foci. Nuclei were counterstained with DAPI. Merged figure presents co-localization of MRE11 & 53BP1 foci visualized in yellow. Image collected & cropped by CiteAb from the following publication (https://pubmed.ncbi.nlm.nih.gov/21637783), licensed under a CC-BY license. Not internally tested by Novus Biologicals.
Immunocytochemistry/ Immunofluorescence: 53BP1 Antibody - BSA Free [NB100-304] -
Immunocytochemistry/ Immunofluorescence: 53BP1 Antibody - BSA Free [NB100-304] - Cry2−/− cells accumulate damaged DNA.(A) Representative early passage (P3–4) primary wildtype (WT), Cry1−/−, Cry2−/−, & Cry1−/−;Cry2−/− adult ear fibroblasts stained with anti-53BP1 antibody (green) & DAPI (blue). Insets show enlarged view of indicated cells. (B) Quantitation of 53BP1-positive cells prepared as described in (A). Nuclei containing more than five 53BP1 puncta & negative for BrdU labeling were considered positive for DNA damage. Data represent the mean ± s.d. for at least 200 cells per genotype. (C) Chi-squared analysis of the distributions of Cry1 & Cry2 wildtype (black), heterozygous (gray), & homozygous knockout (red) genotypes establishes a significantly reduced survival of Cry2−/− mice. **p < 0.01 by chi-squared analysis with 2 degrees of freedom (χ2 = 10.39).DOI:http://dx.doi.org/10.7554/eLife.04883.020 Image collected & cropped by CiteAb from the following publication (https://pubmed.ncbi.nlm.nih.gov/25756610), licensed under a CC-BY license. Not internally tested by Novus Biologicals.
Immunocytochemistry/ Immunofluorescence: 53BP1 Antibody - BSA Free [NB100-304] -
Immunocytochemistry/ Immunofluorescence: 53BP1 Antibody - BSA Free [NB100-304] - Exposure to radiation induces persistent genomic instability.(a) Time course of micronucleus frequency in binucleated cells exposed to 1Gy X-rays or Fe ions (average of two independent irradiations, error bars represent SEM). Paired Student's t-test, *p<0.05, **p<0.01. (b) Time course of gamma H2AX- 53BP1 positive foci per cell distribution in a population of 50 cells per condition following exposure to 1Gy of the indicated radiation. One of two experiments is shown. Chi-Square test NI vs. X-rays or Fe ions. day 7 & day 14 p<0.001. Day 21 p>0.05. (c) Immunofluorescence staining of gamma H2AX-53BP1 positive foci 7 days following exposure to 1Gy of the indicated radiation type. Scale bar is 10 µm. (d) Immunofluorescence staining for BrdU & 53BP1 7 days following exposure to 1Gy Fe ions. Scale bar is 10 µm. The graph represents the average of scoring in 5 different fields a total of 70 cells. Image collected & cropped by CiteAb from the following publication (https://dx.plos.org/10.1371/journal.pone.0108234), licensed under a CC-BY license. Not internally tested by Novus Biologicals.
Western Blot: 53BP1 Antibody - BSA Free [NB100-304] -
Western Blot: 53BP1 Antibody - BSA Free [NB100-304] - Lamin A/C-53BP1 interaction is regulated in a DNA damage-dependent manner. (A) Left; HDF were subjected to IR (10 Gy) & allowed to recover for 1 h. Association between A-type lamins & 53BP1 was assessed by immunoprecipitation of endogenous lamin A/C followed by immunoblotting with 53BP1 & lamin A/C antibodies. WCE, whole cell extract, IP: immunoprecipitates. WCE represents 5% input. Right; endogenous lamin A/C was immunoprecipitated & supernatants or pellets were analysed by immunoblotting for interaction with JMJD2A. (B) U2OS/GFP-lamin A cells were pretreated with caffeine (20 mm) for 1 h before exposure to IR (10 Gy, 1 h recovery). Cell extracts were then subjected to immunoprecipitation using GFP-Trap beads, & bound complexes were then analysed by immunoblotting using 53BP1 & GFP antibodies. WCE represents 1% input. (C) As in (C) except cells were pretreated with 10 μm ATMi for 1 h before IR. WCE represents 1% input. (D) U2OS/GFP-lamin A cells were subjected to laser micro-irradiation, fixed 1 h later & immunostained with gamma -H2AX antibody. Scale bar, 10 μm. (E) U2OS cells were transfected with siCTRL or siLMNA & subjected to laser micro-irradiation, fixed 15 min later & then processed for immunofluorescence with gamma -H2AX & 53BP1 antibodies. Scale bar, 10 μm. Image collected & cropped by CiteAb from the following publication (https://pubmed.ncbi.nlm.nih.gov/25645366), licensed under a CC-BY license. Not internally tested by Novus Biologicals.
Immunocytochemistry/ Immunofluorescence: 53BP1 Antibody - BSA Free [NB100-304] -
Immunocytochemistry/ Immunofluorescence: 53BP1 Antibody - BSA Free [NB100-304] - Persistence of repair foci at suboptimal pHe. (A) Left panel shows immunofluorescence detection of gamma H2AFX & 53BP1 following 24 h recovery from bleomycin treatment. Control, sample before damage induction. Colocalization is shown in white; PCC, Pearson correlation coefficient score. Right panel corresponding to gamma H2AFX foci/cell at 24 h & 48 h following recovery. Only foci larger than 10 pixels were counted. Experiments were performed in triplicate. Values are mean ± SEM. *P < 0.05, ****P < 0.00005. (B) Immunoblots for the detection of gamma H2AFX & histone H4. Right panel shows gamma H2AFX/H4 ratios at indicated pHe values. C, control before damage induction. Quantitation of three independent immunoblots is shown on the right. Values are mean ± SEM. *P < 0.05. (C) Immunofluorescence detection of gamma H2AFX after 48‐h incubation in range of pHe values tested without BLM treatment. Right panel corresponding to gamma H2AFX foci/cell at 48 h of pHe incubation. Only foci larger than 10 pixels were counted. Experiments were performed in triplicate. Values are mean ± SEM. *P < 0.05. Image collected & cropped by CiteAb from the following publication (https://pubmed.ncbi.nlm.nih.gov/29511618), licensed under a CC-BY license. Not internally tested by Novus Biologicals.
Western Blot: 53BP1 Antibody - BSA Free [NB100-304] -
Western Blot: 53BP1 Antibody - BSA Free [NB100-304] - BETd blocks 53BP1 function in senescent cells.a Early passage (control) or late passage (replicative senescence) TIG-3 cells were treated with 10 nM ARV825 (+) or vehicle (−) for 4 days. These cells were then subjected to western blotting using the antibodies shown on the right after immunoprecipitation with the antibodies shown at the top of the panel (IP:). b–f Early passage (control) or late passage (replicative senescence) TIG-3 cells were transfected with previously validated two different siRNA oligos against 53BP1 or control siRNA oligo twice at 2 days intervals. These cells were then subjected to RT-qPCR analysis (b), western blotting analysis (c), the cell proliferation analysis (d), immunofluorescence staining using the antibodies shown on the left (e) or neutral comet assay (f). Representative photographs of the cells in the indicated culture conditions are shown & the histogram shown at the bottom of the panel indicates the relative cell number (d). The number of gamma H2AX foci, above threshold intensity per nucleus (n = 50) was quantified & shown at the bottom of the e. The average tail olive moments were shown at the bottom of the f. Each box indicates the median & 25% & 75% quantiles, & the whiskers represent the minimum & maximum observations (e, f). For all graphs, error bars indicate mean ± s.d. (n = 3 for b, n = 4 for d) & the representative data from three independent experiments were shown. Statistical significance was determined with two-tailed unpaired Student’s t-test (b), one-way ANOVA followed by Tukey multiple comparison test (d), one-way ANOVA followed by Holm-Sidak multiple comparison test (e, f). P values < 0.05 were considered significant. Source data are provided as a Source Data file. Image collected & cropped by CiteAb from the following publication (https://pubmed.ncbi.nlm.nih.gov/32321921), licensed under a CC-BY license. Not internally tested by Novus Biologicals.
Immunocytochemistry/ Immunofluorescence: 53BP1 Antibody - BSA Free [NB100-304] -
Immunocytochemistry/ Immunofluorescence: 53BP1 Antibody - BSA Free [NB100-304] - Bystander signaling evokes DNA damage foci formation in urothelial cancer & normal urothelial cells(A) Schematic representation of experimental conditions including non-irradiated, uniformly-irradiated & shielding protocols where 50% of the slide was exposed & 50% shielded with MCP alloy. Cells were fixed & processed for 53BP1-immunofluorescence, one hour following irradiation. Micrographs of urothelial cancer T24 cells labelled with anti-53BP1 (green) to label nuclear DNA double stand break foci & DAPI to counterstain nuclei are shown for each experimental condition. (B) Summary graph of mean foci/cell in T24 cells (N=3), measured from confocal z-stacks in Volocity software. There were significantly more foci in shielded cells 0.5mm from the shield than in non-irradiated controls, indicative of a bystander effect (p=0.019). (C) Summary data for HT1376 cancer cells (N=3) where there was no difference in the mean foci/cell between non-irradiated controls & shielded cells. (D) Summary data for normal urothelial HUC (N=3). Mean foci/cell was significantly greater in shielded cells in the 0-5mm (p=0.005) & 5-10mm (p=0.04) analysis regions from the shield. * denotes p<0.05, ** denotes p<0.01 Image collected & cropped by CiteAb from the following publication (https://pubmed.ncbi.nlm.nih.gov/29228614), licensed under a CC-BY license. Not internally tested by Novus Biologicals.
Immunocytochemistry/ Immunofluorescence: 53BP1 Antibody - BSA Free [NB100-304] -
Immunocytochemistry/ Immunofluorescence: 53BP1 Antibody - BSA Free [NB100-304] - Pot1a prevents DDR in HSCs. a, b Telomeric DDR in 8 week-old LSK cells upon Pot1a knockdown. a Immunocytochemical staining of TRF1 (green) & 53BP1 (red). Foci co-stained with TRF1 & 53BP1 were identified as TIFs. Nuclei were stained with TOTO3 (blue). Scale bar, 2 μm. b Frequency of TIFs per cell after 1 week of culture. Data are expressed as the mean ± SD (n = 100, *p < 0.01 by t-test). Representative data from three independent experiments are shown. c–f Telomeric DDR in donor-derived control-GFP or Pot1a overexpressing 8 week-old LSK cells 4 months post BMT. c Immunocytochemical staining of TRF1 (green) & 53BP1 (red). Nuclei were stained with TOTO3 (blue). Scale bar, 2 μm. d Frequency of TIFs per cell. Data are expressed as the mean ± SD (n = 120, *p < 0.01 by t-test). Representative data from 3 independent experiments are shown. e Immunocytochemical staining of TRF1 (green) & RPA32 (red). f Immunocytochemical staining of TRF1 (green) & pChk1 (red). Scale bar, 2 μm. g Flow cytometric analysis of Chk1 & pChk1 in donor-derived GFP+ LSKCD48–CD150+ cells after 5 months of 2nd BMT. Mean fluorescence intensity of Chk1 & pChk1 (left panels). Data are expressed as the mean ± SD (n = 3, *p < 0.01 by t-test). Representative FACS profiles of Chk1 & pChk1 in donor-derived GFP+ LSKCD48–CD150+ cells (right panels) Image collected & cropped by CiteAb from the following publication (https://pubmed.ncbi.nlm.nih.gov/28986560), licensed under a CC-BY license. Not internally tested by Novus Biologicals.
Western Blot: 53BP1 Antibody - BSA Free [NB100-304] -
Western Blot: 53BP1 Antibody - BSA Free [NB100-304] - Aphidicolin-induced ATM signaling in immortalized MEFs. (A) Cells (WT, MJI-53; KO, MJI-1) were treated for 24 h using 0 or 3 μM aphidicolin. (B) Cells (lane 1–3, WT, MJI-91; lanes 4–6, KO, MJI-186; lanes 7–9, WT, MJI-105; lanes 1–12, KO, MJI-84) were treated for 24 h using 0, 1 or 3 μM aphidicolin. Actin & 53BP1 serve as loading controls. DYNLL1 is used as a surrogate marker for loss of ASCIZ. (C) Quantification of western blot band intensities. An arbitrary unit of 100 represents the average band intensity for the respective phospho-protein in the 3 μM aphidicolin-treated wildtype samples on each membrane. Graphs indicate the mean ± standard error, n = 3. Additional loading controls for total KAP1, p53 & H2AX are shown in Supplementary Fig. S1A & B. Image collected & cropped by CiteAb from the following publication (https://linkinghub.elsevier.com/retrieve/pii/S1568786417301349), licensed under a CC-BY license. Not internally tested by Novus Biologicals.
Immunocytochemistry/ Immunofluorescence: 53BP1 Antibody - BSA Free [NB100-304] -
Immunocytochemistry/ Immunofluorescence: 53BP1 Antibody - BSA Free [NB100-304] - POT1 prevents DDR in human HSC. a Expression of POT1 in hCB CD34+ cells & LT-HSCs (Lin–CD34+CD38−CD45RA−CD90+CD49f+). b hCB-derived LT-HSCs were cultured with MTM-POT1. After 10 days of culture, cells were isolated & re-cultured in methylcellulose medium (200 cells per dish). The number of CFU-C & HPP-CFC (>1.0 mm, >2.0 mm) are shown. Data are expressed as the mean ± SD (n = 3, *p < 0.01 by t-test). Representative data from three independent experiments are shown. c, d hCB LT-HSCs were cultured for 10 days with control MTM protein or MTM-POT1. After 10 days of culture, LT-HSCs were re-isolated & number of TIF was examined. c Immunocytochemical staining of TRF1 (green), 53BP1 (red), & TOTO3 (blue). Scale bar, 2 μm (left). Frequencies of TIFs after 10 days of culture (right). Data are expressed as the mean ± SD (n = 100: control, n = 100: MTM-POT1, *p < 0.01 by t-test). Representative data from 2 independent experiments are shown. d Immunocytochemical staining of TRF1 (green), RPA32 (red), & TOTO3 (blue). Scale bar, 2 μm (left). Frequencies of TIFs after 10 days of culture (right). Data are expressed as the mean ± SD (n = 110–120: control, n = 110: MTM-POT1, *p < 0.01 by t-test). Representative data from two independent experiments are shown Image collected & cropped by CiteAb from the following publication (https://pubmed.ncbi.nlm.nih.gov/28986560), licensed under a CC-BY license. Not internally tested by Novus Biologicals.
Immunocytochemistry/ Immunofluorescence: 53BP1 Antibody - BSA Free [NB100-304] -
Immunocytochemistry/ Immunofluorescence: 53BP1 Antibody - BSA Free [NB100-304] - Telomere-initiated senescent cells retain active DDR foci for years after senescence establishment.a. DDR, in the form of ATM pS1981 foci co-localizing with 53BP1 & gamma H2AX foci, is detectable three years after senescence establishment. Scale bar, 10 µm. Below, bar graphs show the percentage of cells positive ± s.e.m. for the indicated DDR markers, in senescent (sen), early passage proliferating (prol) or telomerized proliferating (tel) skin fibroblasts from two independent centenarian donors (cen2 & cen3). Cells were considered positive if bearing more than 3 DDR foci (*** p-value <0.001). b. SA-beta -gal staining of the two batches, cen2 & cen3, is shown together with the percentage of BrdU-positive cells. Scale bar, 100 µm. Image collected & cropped by CiteAb from the following publication (https://dx.plos.org/10.1371/journal.pone.0110969), licensed under a CC-BY license. Not internally tested by Novus Biologicals.
Immunocytochemistry/ Immunofluorescence: 53BP1 Antibody - BSA Free [NB100-304] -
Immunocytochemistry/ Immunofluorescence: 53BP1 Antibody - BSA Free [NB100-304] - VPA at a safe dose can lead to the dysfunction of DNA repair function. (A) The images represent gamma H2AX & 53BP1 foci formation in U2OS cells treated with 0.5 or 1.0 mM VPA at 24 h post-IR treatment (left panel), & the percentage of cells with gamma H2AX foci or 53BP1 foci formation in each group was calculated (right panel, the cell with >10 foci was called positive & counted). DAPI was used for nuclear staining; (B) The relative DNA damage in primary-culture tumor cells at 120 min post-IR was analyzed by comet assay (upper), & gamma H2AX foci formation in primary-culture tumor cells at 24 h post-IR was presented,“+” & “−“ indicated whether VPA was added in the groups (lower left) & calculated (lower right); (C) The clonogenic survival assay was used to detect survival in the U2OS cells treated with the combination of 0.5 or 1.0 mM VPA with 10 μM ABT888 (PARPi). Each data point in the graphs was from three independent experiments (mean ± SD). p-Values were calculated by Student’s t-test (* p < 0.05). Image collected & cropped by CiteAb from the following publication (https://pubmed.ncbi.nlm.nih.gov/28489060), licensed under a CC-BY license. Not internally tested by Novus Biologicals.
Western Blot: 53BP1 Antibody - BSA Free [NB100-304] -
Western Blot: 53BP1 Antibody - BSA Free [NB100-304] - BETd blocks 53BP1 function in senescent cells.a Early passage (control) or late passage (replicative senescence) TIG-3 cells were treated with 10 nM ARV825 (+) or vehicle (−) for 4 days. These cells were then subjected to western blotting using the antibodies shown on the right after immunoprecipitation with the antibodies shown at the top of the panel (IP:). b–f Early passage (control) or late passage (replicative senescence) TIG-3 cells were transfected with previously validated two different siRNA oligos against 53BP1 or control siRNA oligo twice at 2 days intervals. These cells were then subjected to RT-qPCR analysis (b), western blotting analysis (c), the cell proliferation analysis (d), immunofluorescence staining using the antibodies shown on the left (e) or neutral comet assay (f). Representative photographs of the cells in the indicated culture conditions are shown & the histogram shown at the bottom of the panel indicates the relative cell number (d). The number of gamma H2AX foci, above threshold intensity per nucleus (n = 50) was quantified & shown at the bottom of the e. The average tail olive moments were shown at the bottom of the f. Each box indicates the median & 25% & 75% quantiles, & the whiskers represent the minimum & maximum observations (e, f). For all graphs, error bars indicate mean ± s.d. (n = 3 for b, n = 4 for d) & the representative data from three independent experiments were shown. Statistical significance was determined with two-tailed unpaired Student’s t-test (b), one-way ANOVA followed by Tukey multiple comparison test (d), one-way ANOVA followed by Holm-Sidak multiple comparison test (e, f). P values < 0.05 were considered significant. Source data are provided as a Source Data file. Image collected & cropped by CiteAb from the following publication (https://pubmed.ncbi.nlm.nih.gov/32321921), licensed under a CC-BY license. Not internally tested by Novus Biologicals.
Western Blot: 53BP1 Antibody - BSA Free [NB100-304] -
Western Blot: 53BP1 Antibody - BSA Free [NB100-304] - The susceptibility of human LECs to low-dose ionizing radiation. The human lens cell line FHL124 was exposed to low-dose IR up to 2.28 Gy. Exposed cells were then processed for both immunofluoresence microscopy (a) & immunoblotting (b) 1 h later. The signals obtained by immunoblotting were quantified & the mean from three independent experiments calculated & plotted (c) against IR dose. GAPDH was used as a loading control. Both gamma H2AX & RAD51 increased linearly with IR dose. Signals for other markers of DNA repair, 53BP1, MRE11 & TP53, remained unchanged as assessed by immunoblotting (b). By immunofluoresence microscopy (a), MRE11 & 53BP1 redistributed into nuclear foci, particularly at the 2.28 Gy level. TP53 remained uniformly distributed throughout the nuclear compartment, but excluded from nucleoli (a). As the levels of gamma H2AX & RAD51 increased after exposure to IR (c), so the number of nuclear foci also increased (a). Scale bar, 10 µm. Image collected & cropped by CiteAb from the following publication (https://pubmed.ncbi.nlm.nih.gov/25924630), licensed under a CC-BY license. Not internally tested by Novus Biologicals.
Western Blot: 53BP1 Antibody - BSA Free [NB100-304] -
Western Blot: 53BP1 Antibody - BSA Free [NB100-304] - A-type lamin depletion inhibits DNA repair & reduces cellular fitness to DNA damage. (A) Wild-type (WT) or Y259X HDF treated w/ proteasome inhibitor MG-132 (30 μm). Cell extracts prepared & levels of 53BP1 assessed by immunoblotting. beta -tubulin a loading control. WCE, whole cell extract. The relative levels of 53BP1 expressed relative to levels of untreated WT HDF (1.00). In untreated Y259X cells, 53BP1 levels fell to 15% & restored to ∽50% following treatment w/ MG-132. (B) Cell extracts prepared from WT & Y259X HDF & assessed by immunoblotting w/ indicated antibodies. Shown is a representative set of blots from two independent experiments. (C) WT & Y259X HDF biochemically extracted into cytoplasmic & nuclear fractions before immunoblotting for levels of 53BP1. (D) HDF & Y259X cells treated w/ IR (3 Gy), fixed at the times indicated & stained w/ gamma -H2AX antibody. The number of gamma -H2AX foci at each time point quantified & data represents the mean ± SD from 3 independent experiments. (E) U2OS cells transfected w/ siCTRL or siLMNA siRNA & plated onto 60-mm dishes. The cells then exposed to varying doses of IR & fixed 12 days later in a solution containing crystal violet. The surviving fraction at each IR dose calculated based on the plating efficiency of untreated plates. Data represent the mean ± SD from 3 independent experiments. (F) HDF or Y259X cells treated w/ DMSO or KU55933 ATM inhibitor (10 μm) before exposure to indicated doses of IR then fixed, processed & stained w/ gamma -H2AX antibody. Residual gamma -H2AX foci enumerated & the data represent the mean ± SD from 3 independent experiments. (G) HDF or Y259X cells exposed to IR, briefly extracted w/ CSK buffer & processed for IF w/ gamma -H2AX & pKAP-1 antibodies. Scale bar, 10 μm. Image collected & cropped by CiteAb from the following publication (https://pubmed.ncbi.nlm.nih.gov/25645366), licensed under a CC-BY license. Not internally tested by Novus Biologicals.
Immunocytochemistry/ Immunofluorescence: 53BP1 Antibody - BSA Free [NB100-304] -
Immunocytochemistry/ Immunofluorescence: 53BP1 Antibody - BSA Free [NB100-304] - UDM1 is required for RNF168-mediated 53BP1 recruitment.a Schematic illustration of RNF8 & RNF168 structural domain organization, RNF168 fragments, & chimeric proteins used as in b & c. FHA–forkhead-association domain; coiled-coil–coiled-coil domain; RING–ubiquitin E3 ligase RING domain; Rs-arginine anchor; LRM–LR motif; UMI–UIM-and MIU-related ubiquitin binding domain; MIU–motif interacting with ubiquitin. b–c Transient transfection of GFP-tagged RNF168 fragments & chimeric proteins in U2OS RNF168 KO cells. Cells were irradiated with 10 Gy & allowed to recover for 1 h followed by immunofluorescence analysis using 53BP1 antibody as indicated. Cells were counterstained with DAPI. Repeated at least two times independently with similar results. Source data are provided as Source Data file. Image collected & cropped by CiteAb from the following publication (https://pubmed.ncbi.nlm.nih.gov/32424115), licensed under a CC-BY license. Not internally tested by Novus Biologicals.
Western Blot: 53BP1 Antibody - BSA Free [NB100-304] -
Western Blot: 53BP1 Antibody - BSA Free [NB100-304] - Loss of ATM function in retina.(a) Retinal explants pretreated with ATM inhibitor (ATMi) or PI3K inhibitor (DDRi) are irradiated & sections analyzed for gamma H2AX. (b) ATM knockout adult mice retina analyzed for irradiation dependent gamma H2AXaccumulation. (c) Western blot analysis of ATM & 53BP1 in micro-dissected neuronal retina. LC, Coomassie-equivalent staining of gels used as loading control (representation of n=2 independent repeats). (d) Cartoon depiction of domains of ATM protein. (e) Neural retina of mice was microdissected & cDNA was prepared. PCR performed using indicated domain-specific primers onATM mRNA. Unlike FATC & TAN domain coding mRNA; the FAT-domain containing mRNA could be observed even in 5-month-old adult mice retina, indicating the presence of an alternatively spliced form of ATM in the retina. Image collected & cropped by CiteAb from the following publication (https://pubmed.ncbi.nlm.nih.gov/30345028), licensed under a CC-BY license. Not internally tested by Novus Biologicals.
Immunocytochemistry/ Immunofluorescence: 53BP1 Antibody - BSA Free [NB100-304] -
Immunocytochemistry/ Immunofluorescence: 53BP1 Antibody - BSA Free [NB100-304] - TIFs measured in leukocytes. (A) The percentage of cells with one or more TIFs in griffon vultures. The age & number of cells measured for each individual was as follows: 8.06 years: 77 cells, 10 years: 29 cells, 10.9 years: 153 cells, 12.3 years: 146 cells, 15.3 years: 125 cells, & 21.4 years: 173 cells. (B) The percentage of cells with one or more TIFs in American flamingos. The age & number of cells measured for each individual was as follows: 0.79 years: 3 cells, 1.75 years: 12 cells, 1.8 years: 34 cells, 6.75 years: 21 cells, 13.8 years: 11 cells, 16.9 years: 9 cells, 19.9 years: 7 cells, 19.9 years: 7 cells, 34.9 years: 20 cells, & 35.9 years: 6 cells. In the representative images, the nuclei are stained blue with DAPI, the telomeres are red, & the 53BP1 stain is in green. 53BP1 staining at the very edge of nuclei was not counted as foci. The top row of the representative images shows maximum projections which are the result of taking the maximum value of several different z-planes. The magnification image is displayed for a single plane rather than a maximum projection to show co-localization of the stains. A white arrow indicates a colocalization of 53BP1 & a telomere spot (a TIF). Image collected & cropped by CiteAb from the following publication (https://pubmed.ncbi.nlm.nih.gov/31730540), licensed under a CC-BY license. Not internally tested by Novus Biologicals.
Immunocytochemistry/ Immunofluorescence: 53BP1 Antibody - BSA Free [NB100-304] -
Immunocytochemistry/ Immunofluorescence: 53BP1 Antibody - BSA Free [NB100-304] - UDM1 is required for RNF168-mediated 53BP1 recruitment.a Schematic illustration of RNF8 & RNF168 structural domain organization, RNF168 fragments, & chimeric proteins used as in b & c. FHA–forkhead-association domain; coiled-coil–coiled-coil domain; RING–ubiquitin E3 ligase RING domain; Rs-arginine anchor; LRM–LR motif; UMI–UIM-and MIU-related ubiquitin binding domain; MIU–motif interacting with ubiquitin. b–c Transient transfection of GFP-tagged RNF168 fragments & chimeric proteins in U2OS RNF168 KO cells. Cells were irradiated with 10 Gy & allowed to recover for 1 h followed by immunofluorescence analysis using 53BP1 antibody as indicated. Cells were counterstained with DAPI. Repeated at least two times independently with similar results. Source data are provided as Source Data file. Image collected & cropped by CiteAb from the following publication (https://pubmed.ncbi.nlm.nih.gov/32424115), licensed under a CC-BY license. Not internally tested by Novus Biologicals.
Immunocytochemistry/ Immunofluorescence: 53BP1 Antibody - BSA Free [NB100-304] -
Immunocytochemistry/ Immunofluorescence: 53BP1 Antibody - BSA Free [NB100-304] - NRK1 deletion curbs PARP activity & exacerbates DNA damage. a NAD+ levels in the liver of NRK1 LKO mice upon LFD & HFD (n = 8 for all groups except NRK1 LKO on HFD, n = 10; 24 weeks of age). b NR (left), NMN (center) & NAM (right) levels in the liver of NRK1 LKO & control mice upon HFD (n = 6 mice per group). c mRNA level of genes involved in the NAD+ biosynthesis pathways (n = 8 mice for the control group, n = 10 mice for the NRK1 LKO group). d Levels of poly(ADP-ribose) protein modification, PARP1, SIRT1, NAMPT, & GAPDH in the liver of NRK1 LKO & control mice on HFD. e Representative staining (top) & quantification (bottom) of gamma H2AX (left) & 53BP1 (right) immunofluorescence on liver sections from NRK1 LKO & control mice on HFD (n = 4 mice per group, ×10 magnification, DAPI counterstaining, scale bars: 200 μm). Results shown are mean ± SEM, * & *** indicate statistical difference vs. control group at p < 0.05 & p < 0.001, respectively. The individual values & statistical tests used for each panel can be found in the Source Data file Image collected & cropped by CiteAb from the following publication (https://pubmed.ncbi.nlm.nih.gov/31541116), licensed under a CC-BY license. Not internally tested by Novus Biologicals.
Immunocytochemistry/ Immunofluorescence: 53BP1 Antibody - BSA Free [NB100-304] -
Immunocytochemistry/ Immunofluorescence: 53BP1 Antibody - BSA Free [NB100-304] - GamGFP marks DSBs in mammalian cells & is inhibited by Ku.(A) GamGFP co-localizes with 53BP1 on laser-induced DNA breaks. (B) Ku inhibits recruitment of GamGFP to laser-induced damage, live cells. (C & D) Ku inhibits recruitment of GamGFP, fixed cells. Mean ± SEM of three experiments, n >25 cells each. (E) GamGFP forms IR-induced foci in Ku80-defective MEFs. (F) Zoomed image from E. (G) IR-induced foci containing Gam only, 53BP1 only or both Gam & 53BP1 (>2600 total foci counted in three independent experiments). Error bars, SEM. Scale bars = 5 μm.DOI:http://dx.doi.org/10.7554/eLife.01222.012GamGFP marks DSBs in mammalian cells.(A) Live analysis of GamGFP localization to laser-induced DNA damage. Hela cells producing GamGFP were laser damaged along the cell track indicated by the red line at 0 min (m) & images were taken at the indicated times as shown. (B) GamGFP co-localizes with gamma H2AX in fixed Hela cells.DOI:http://dx.doi.org/10.7554/eLife.01222.013Ku inhibits GamGFP recruitment at DSBs independently of non-homologous end joining.Cells lacking either Ku80 or LigIV are defective in non-homologous end joining (NHEJ), yet the presence of Ku still inhibits recruitment of GamGFP to laser-induced DSBs even in NHEJ-defective cells, & thus independently of the cell's ability to complete NHEJ. Whereas it could have been possible that reduced GamGFP recruitment in the presence of Ku was caused by reduced persistence of DSBs due to their repair by NHEJ, our data show instead that Ku inhibits recruitment independently of successful NHEJ & imply that Ku binding to DSEs itself is inhibitory.DOI:http://dx.doi.org/10.7554/eLife.01222.014 Image collected & cropped by CiteAb from the following publication (https://elifesciences.org/articles/01222), licensed under a CC-BY license. Not internally tested by Novus Biologicals.
Immunocytochemistry/ Immunofluorescence: 53BP1 Antibody - BSA Free [NB100-304] -
Immunocytochemistry/ Immunofluorescence: 53BP1 Antibody - BSA Free [NB100-304] - DNA repair response to irradiation-induced DNA-breaks in adult mice retina.(a) Immunofluorescence performed using anti-gamma H2AX & 53BP1 antibodies in mice retina 1hr after exposure to 5 Gyrase of ionizing radiation. gamma H2AX appears in all cell types in response to DNA breaks. 53BP only observed in the ganglion cell layer (GC) & inner strata of inner nuclear layer (INL) (seeFigure 1a). Zoom in show foci formation in cells expressing 53BP1. (b) H2AX phosphorylation in all retinal cell types is euchromatin specific. (c) Kinetics of DNA repair in mice retina. Post-Irradiation, mice were sacrificed at indicated times & retinal sections were analysed for gamma H2AX & 53BP1. Left panel show all nuclear layers of retina;right panel show zoom in images to emphasize foci formation. Two mice were used for each condition, which were processed & stained together. Random image were taken using confocal microscope on each eye. Image collected & cropped by CiteAb from the following publication (https://pubmed.ncbi.nlm.nih.gov/30345028), licensed under a CC-BY license. Not internally tested by Novus Biologicals.
Immunocytochemistry/ Immunofluorescence: 53BP1 Antibody - BSA Free [NB100-304] -
Immunocytochemistry/ Immunofluorescence: 53BP1 Antibody - BSA Free [NB100-304] - Detection of 53BP1 in CTCs from MBC patients in the DETECT IV trial. (a) Selection of MBC patients with CTC-positivity (HER2-) & primary TNBC or primary HER2-, HR+ breast cancer for Eribulin monotherapy & blood sample collection. Blood samples were drawn before therapy (baseline visit), four, twelve, & 24 weeks after the start of Eribulin treatment (1st, 2nd, & 3rd treatment visit) as well as one year after treatment initiation or during premature termination due to disease progression (final visit). The numbers of patients recruited at the different visits are indicated by black columns, the numbers of CTC+ & CTC- patients among them by red & grey columns, respectively. Note that not all of the patients described in Table 1 entered the study during the baseline visit but during later visits which explains the differences in patient numbers. (b) Evaluation of 53BP1 signals in CTCs. Following EpCAM-based CTC enrichment & immunofluorescence microscopic imaging (Cellsearch®), CTCs (CK+, CD45-) were enumerated & 53BP1-staining intensity assessed per individual CTC as indicated by representative examples. A 53BP1 score per patient sample was calculated from the percentage of CTCs without & with light, moderate or strong staining. PBMC, peripheral blood mononuclear cell (CK-, CD45+). Image collected & cropped by CiteAb from the following publication (https://pubmed.ncbi.nlm.nih.gov/32283863), licensed under a CC-BY license. Not internally tested by Novus Biologicals.
Immunocytochemistry/ Immunofluorescence: 53BP1 Antibody - BSA Free [NB100-304] -
Immunocytochemistry/ Immunofluorescence: 53BP1 Antibody - BSA Free [NB100-304] - Treatment w/ exogenous POT1 protein protects LT-HSCs in culture. a Effect of MTM-POT1a on colony formation of HSCs. LT-HSCs (8 week-old) cultured w/ MTM-POT1a for 2 weeks. After culture, Lin− cells isolated & re-cultured in MethoCult™ GF M3434 medium (200 cells per dish). Data are expressed as the mean ± SD (n = 3, *p < 0.01 by Tukey’s test). Representative data from two independent experiments are shown. b, c LT-HSCs (8 week-old) cultured w/ MTM-POT1a or control MTM protein. b Number of total cells & LT-HSCs on day 4, 7, & 10 of culture. Data are expressed as the mean ± SD (n = 6, *p < 0.01 by t-test). c Percentage of Annexin V+PI+ apoptotic cells in LT-HSCs on day 4, 7, & 10 of culture. Data are expressed as the mean ± SD (n = 6, *p < 0.01 by t-test). d LT-HSCs (8 week-old) transduced w/ control shRNA or shPot1a-1. After 2 days of shRNA transduction, GFP+LT-HSCs re-sorted & cultured w/ MTM-POT1a or control MTM protein. After 1 week of culture, Annexin V assay performed. Percentage of Annexin V+PI+ apoptotic cells in GFP+LT-HSC fraction is shown. (n = 3, **p < 0.05 by Tukey’s test). e Immunocytochemical staining of TRF (green), 53BP1 (red), & TOTO3 (blue) in 8 week-old LT-HSCs cultured for 3 weeks (left). Frequencies of TIFs after 3 weeks of culture (right). Data are expressed as the mean ± SD (n = 80–100, *p < 0.01 by t-test). f Representative FACS profiles of 8 week-old LT-HSCs after 3 weeks of culture w/ control MTM protein or MTM-POT1a (left). Numbers of LSK cells & LT-HSCs after 3 week culture (starting from 2400 cells) are shown in right panels. Data are expressed as the mean ± SD (n = 3, *p < 0.01 by t-test). Representative data from five independent experiments are shown Image collected & cropped by CiteAb from the following publication (https://pubmed.ncbi.nlm.nih.gov/28986560), licensed under a CC-BY license. Not internally tested by Novus Biologicals.
Immunocytochemistry/ Immunofluorescence: 53BP1 Antibody - BSA Free [NB100-304] -
Immunocytochemistry/ Immunofluorescence: 53BP1 Antibody - BSA Free [NB100-304] - Induction of senescence in hepatocytes causes mitochondrial dysfunction & reduces fatty acid oxidation capacity.Hepatocytes isolated from wild-type C57Bl/6 mice acquire a senescent phenotype 6 days after 10 Gy X-ray irradiation: (a) representative images showing SA-beta -Gal in non-irradiated cells (NOIR) & 6 days after irradiation, Merge: light blue=DAPI, dark blue=SA-beta -Gal, scale bar, 20 μm; (b) frequencies of SA-beta -Gal-positive hepatocytes & (c) representative images showing 53BP1 staining in NOIR & 6 days after irradiation. Merge: blue=DAPI, red=53BP1, scale bar 10 μm; (d) average number of 53BP1 foci per cell are significantly increased 6 days after irradiation. (e) Representative images showing Nile red staining in NOIR & 6 days after IR. Merge: blue=DAPI, red=Nile red, scale bar scale bar 20 μm. (f) Average fluorescence intensity of Nile red staining in senescent or non-senescent hepatocytes. (g) Change in OCR in senescent or non-senescent hepatocytes after addition of the fatty acid palmitate as substrate; (h) change in OCR in senescent or non-senescent hepatocytes after inhibition of fatty acid oxidation by etomoxir. Data in b,g,h are mean±s.e.m. & in d,f are mean±s.d. with 3–4 animals per group. Significant differences (t-test) are indicated with *P≤0.05 & **P≤0.001. Image collected & cropped by CiteAb from the following publication (https://pubmed.ncbi.nlm.nih.gov/28608850), licensed under a CC-BY license. Not internally tested by Novus Biologicals.
Detection of 53BP1 in U-2 OS Human Cell Line by Flow Cytometry.
An intracellular stain was performed on U-2 OS human osteosarcoma cell line with Rabbit anti-53BP1 Affinity Purified Polyclonal Antibody conjugated to Alexa Fluor ® 647 (Catalog # NB100-304AF647, blue histogram) or matched control antibody (Catalog # NBP2-24981AF647, orange histogram) at 2.5 µg/mL for 30 minutes at RT.
53BP1 in U-2 OS Human Cell Line.
53BP1 was detected in immersion fixed U-2 OS human osteosarcoma cell line using Rabbit anti-53BP1 Antigen Affinity Purified Polyclonal Antibody conjugated to Alexa Fluor ® 647 (Catalog # NB100-304AF647) (light blue) at 5 µg/mL overnight at 4C. Cells were counterstained with DAPI (blue). Cells were imaged using a 100X objective and digitally deconvolved.
53BP1 in SJCRH30 Human Cell Line.
53BP1 was detected in immersion fixed SJCRH30 human Rhabdomyosarcoma cell line using Rabbit anti-53BP1 Antigen Affinity Purified Polyclonal Antibody conjugated to Alexa Fluor® 488 (Catalog # NB100-304AF488) (green) at 5 µg/mL overnight at 4C. Cells were counterstained with DAPI (blue). Cells were imaged using a 100X objective and digitally deconvolved.
Detection of 53BP1 in U-2 OS Human Cell Line by Flow Cytometry.
An intracellular stain was performed on U-2 OS human osteosarcoma cell line with Rabbit anti-53BP1 Affinity Purified Polyclonal Antibody conjugated to DyLight 650 (Catalog # NB100-304C, blue histogram) or matched control antibody (Catalog # NBP2-24981C, orange histogram) at 2.5 µg/mL for 30 minutes at RT.
53BP1 in SJCRH30 Human Cell Line.
53BP1 was detected in immersion fixed SJCRH30 human Rhabdomyosarcoma cell line using Rabbit anti-53BP1 Antigen Affinity Purified Polyclonal Antibody conjugated to DyLight 488 (Catalog # NB100-304G) (green) at 5 µg/mL overnight at 4C. Cells were counterstained with DAPI (blue). Cells were imaged using a 100X objective and digitally deconvolved.
53BP1 in SJCRH30 Human Cell Line.
53BP1 was detected in immersion fixed SJCRH30 human Rhabdomyosarcoma cell line using Rabbit anti-53BP1 Antigen Affinity Purified Polyclonal Antibody conjugated to DyLight 550 (Catalog # NB100-304R) (red) at 5 µg/mL overnight at 4C. Cells were counterstained with DAPI (blue). Cells were imaged using a 100X objective and digitally deconvolved.Applications for 53BP1 Antibody - BSA Free
Application
Recommended Usage
Flow (Intracellular)
1.5 ug/ml
Immunocytochemistry/ Immunofluorescence
1:1000-1:5000
Immunohistochemistry
reported in scientific literature (PMID 24987917)
Immunohistochemistry-Frozen
reported by customer review
Immunohistochemistry-Paraffin
1:1000-1:5000. Use reported in scientific literature (PMID 27653664)
Immunoprecipitation
reported in scientific literature (PMID 25645366)
Knockout Validated
reported in scientific literature (PMID 26601238)
Simple Western
4-20 µg/mL
Western Blot
1 - 2 ug/ml
Reviewed Applications
Read 16 reviews rated 4.6 using NB100-304 in the following applications:
Flow Cytometry Panel Builder
Bio-Techne Knows Flow Cytometry
Save time and reduce costly mistakes by quickly finding compatible reagents using the Panel Builder Tool.
Advanced Features
- Spectra Viewer - Custom analysis of spectra from multiple fluorochromes
- Spillover Popups - Visualize the spectra of individual fluorochromes
- Antigen Density Selector - Match fluorochrome brightness with antigen density

Formulation, Preparation, and Storage
Purification
Immunogen affinity purified
Formulation
PBS
Format
BSA Free
Preservative
0.02% Sodium Azide
Concentration
1 mg/ml
Shipping
The product is shipped with polar packs. Upon receipt, store it immediately at the temperature recommended below.
Stability & Storage
Store at 4C short term. Aliquot and store at -20C long term. Avoid freeze-thaw cycles.
Background: 53BP1
References
1.Henry, E., Souissi-Sahraoui, I., Deynoux, M., Lefevre, A., Barroca, V., Campalans, A.,... Arcangeli, M. L. (2019). Human hematopoietic stem/progenitor cells display ROS-dependent long-term hematopoietic defects after exposure to low dose of ionizing radiations. Haematologica. doi:10.3324/haematol.2019.226936
2.Janoshazi, A. K., Horton, J. K., Zhao, M. L., Prasad, R., Scappini, E. L., Tucker, C. J., & Wilson, S. H. (2020). Shining light on the response to repair intermediates in DNA of living cells. DNA Repair (Amst), 85, 102749. doi:10.1016/j.dnarep.2019.102749
Long Name
p53 Binding Protein 1
Alternate Names
p202, TP53BP1
Gene Symbol
TP53BP1
Additional 53BP1 Products
Product Documents for 53BP1 Antibody - BSA Free
Certificate of Analysis
To download a Certificate of Analysis, please enter a lot or batch number in the search box below.
Product Specific Notices for 53BP1 Antibody - BSA Free
Please note for Lot A5, the dilution recommendations have changed from our previous lot recommendations. You may be required to use the antibody at a higher dilution than previous lots to obtain similar results. Please contact us if you have any questions.
This product is for research use only and is not approved for use in humans or in clinical diagnosis. Primary Antibodies are guaranteed for 1 year from date of receipt.
Related Research Areas
Citations for 53BP1 Antibody - BSA Free
 Powered by Bioz
Customer Reviews for 53BP1 Antibody - BSA Free (16)
4.6 out of 5
16 Customer Ratings
Have you used 53BP1 Antibody - BSA Free?
Submit a review and receive an Amazon gift card!
$25/€18/£15/$25CAN/¥2500 Yen for a review with an image
$10/€7/£6/$10CAN/¥1110 Yen for a review without an image
Submit a review
Customer Images
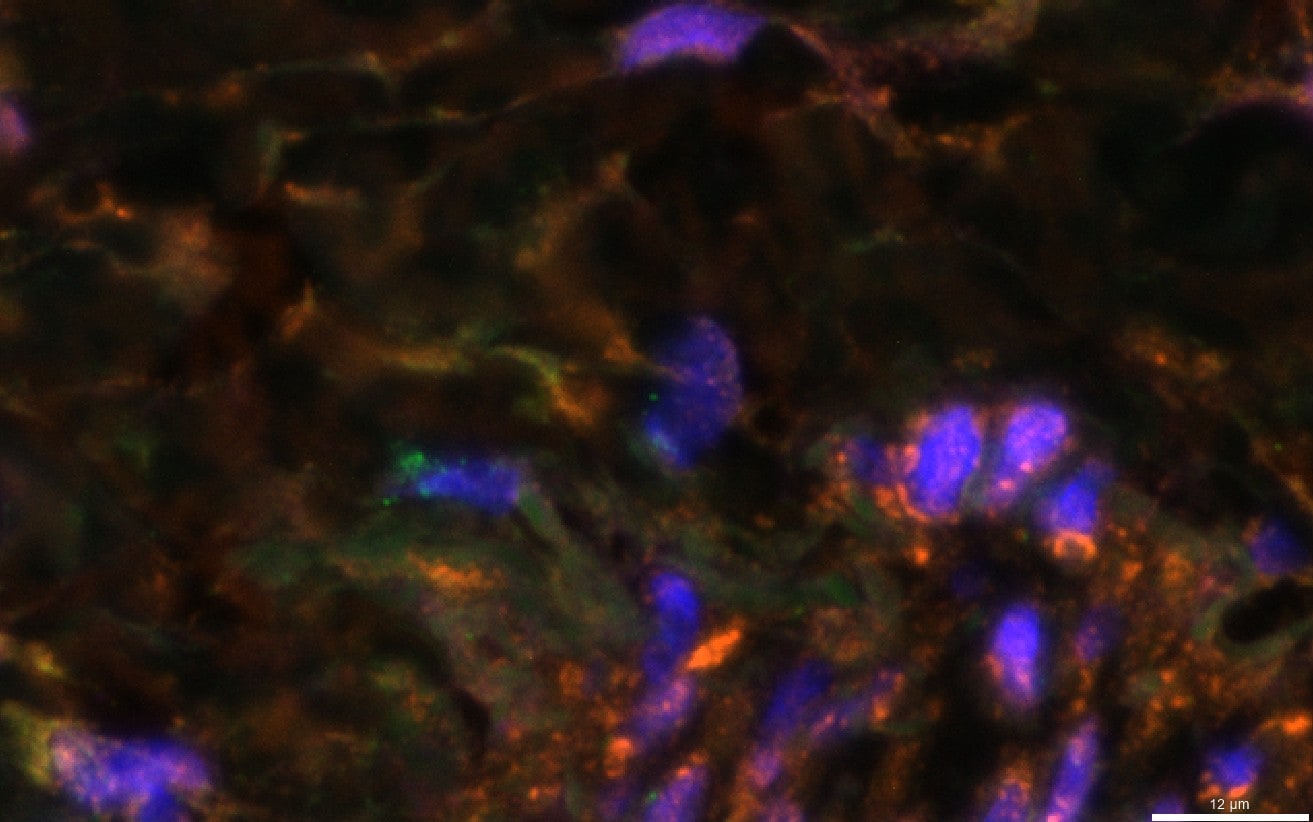
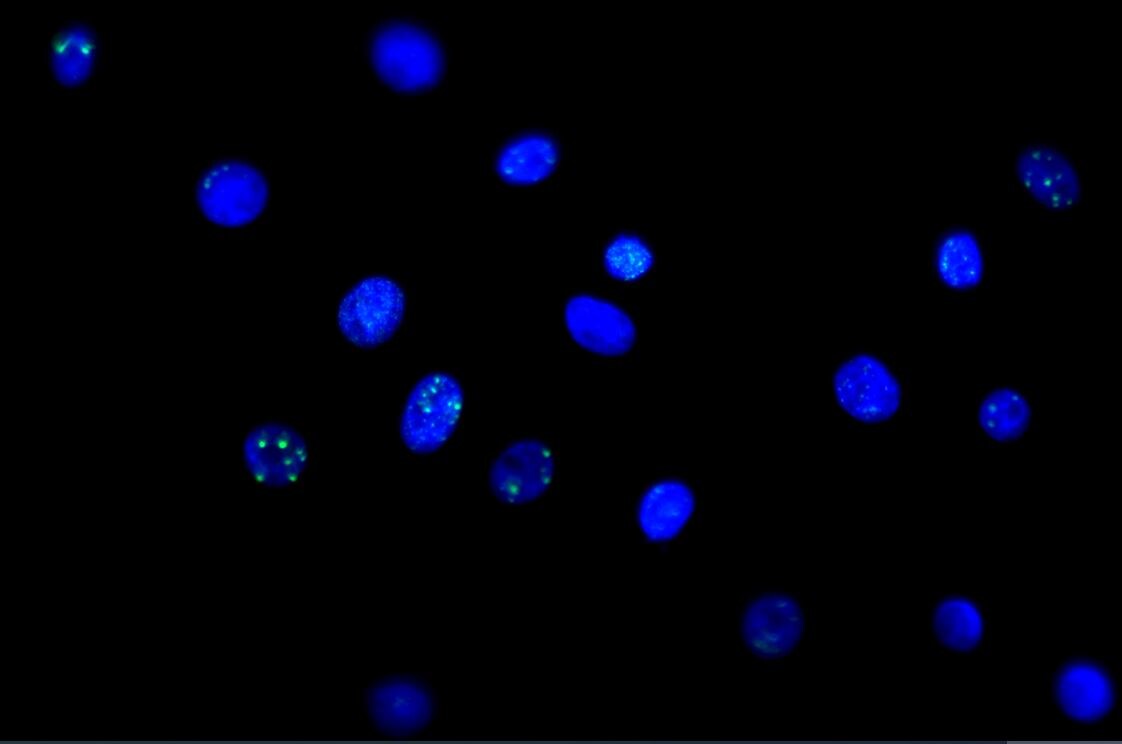
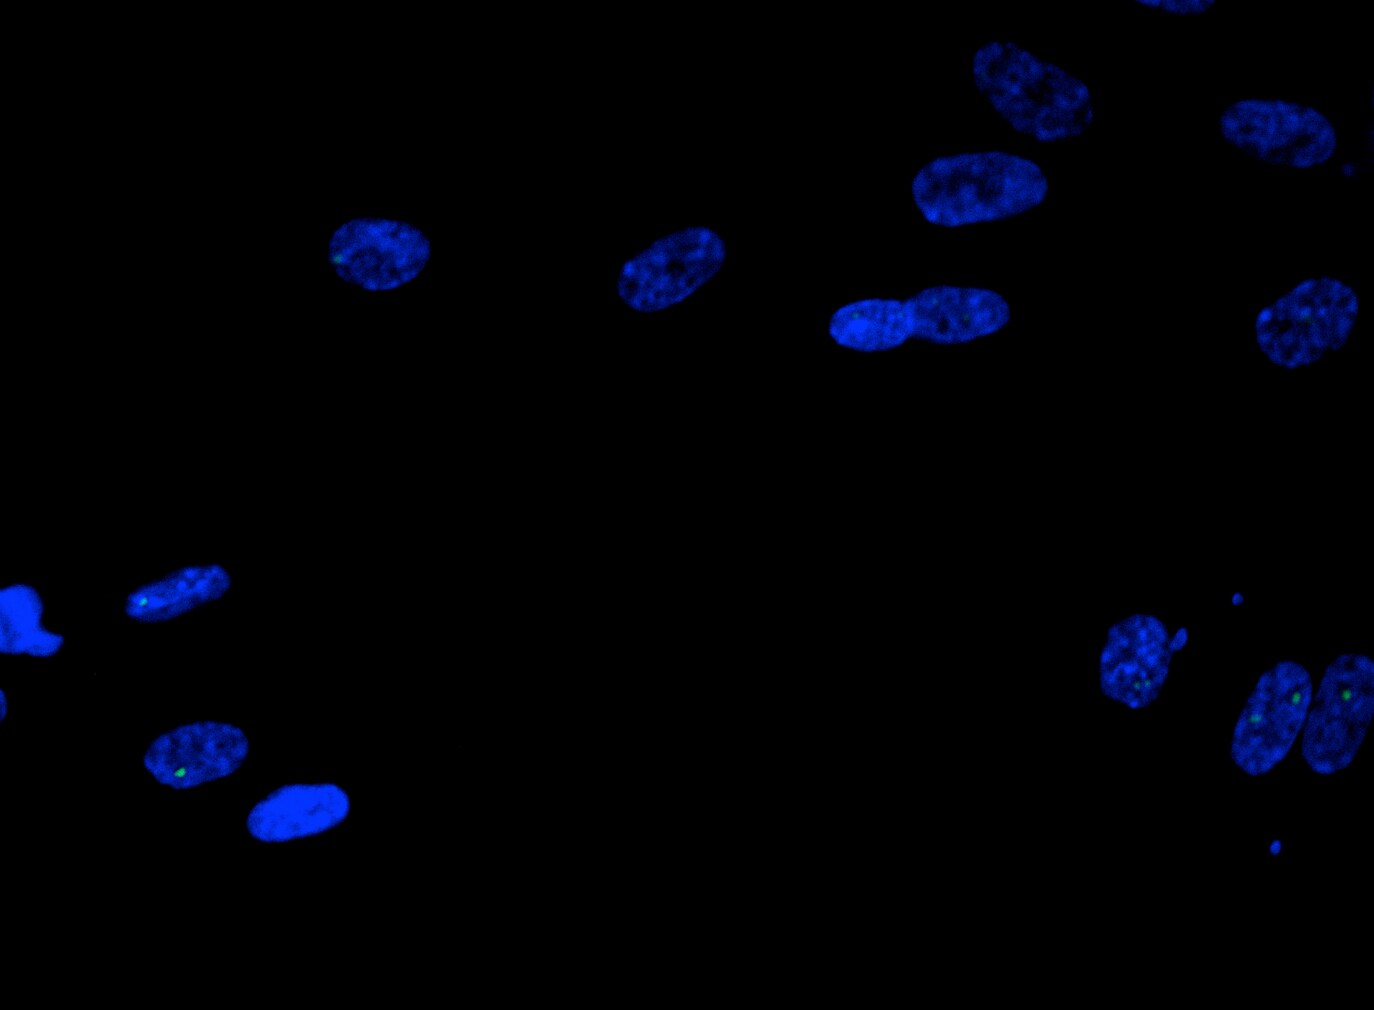
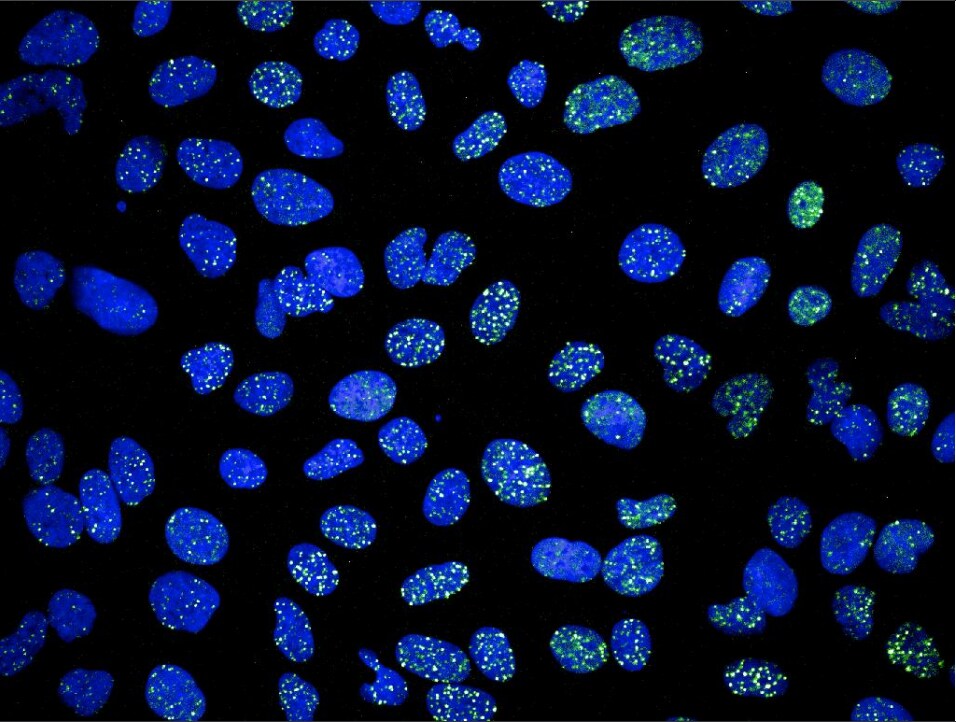
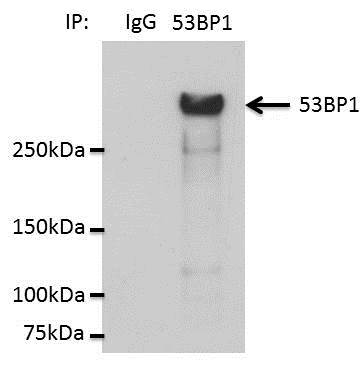
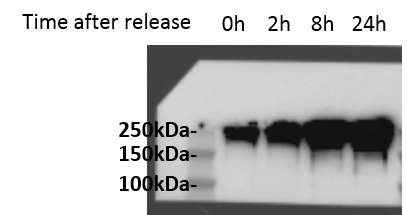
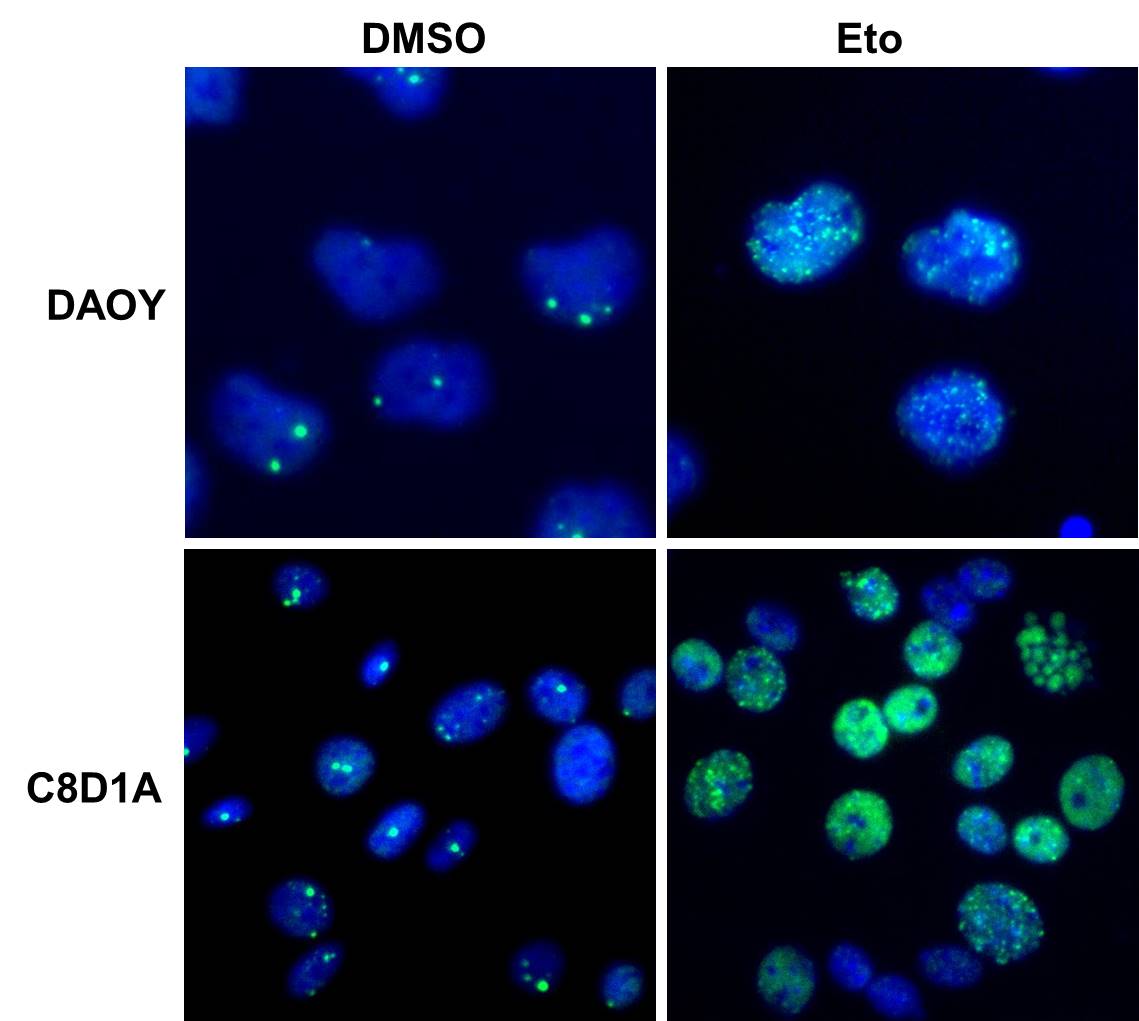
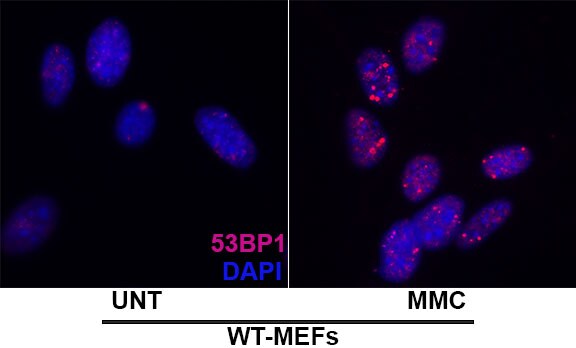
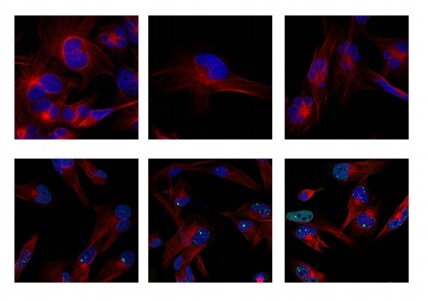
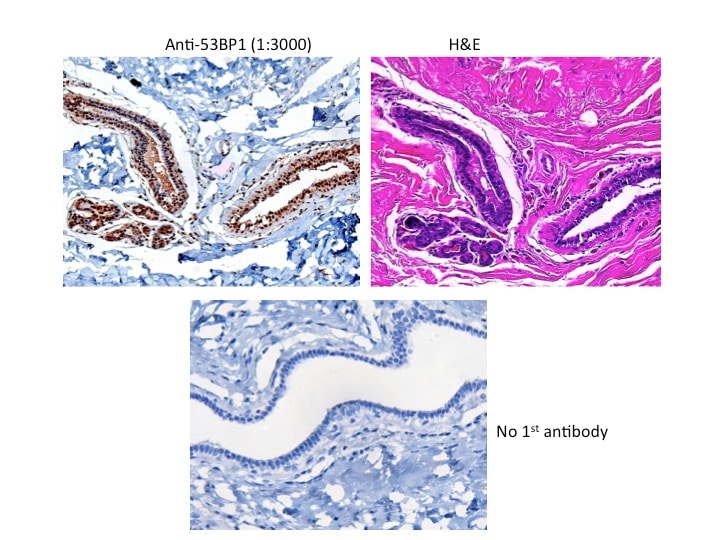
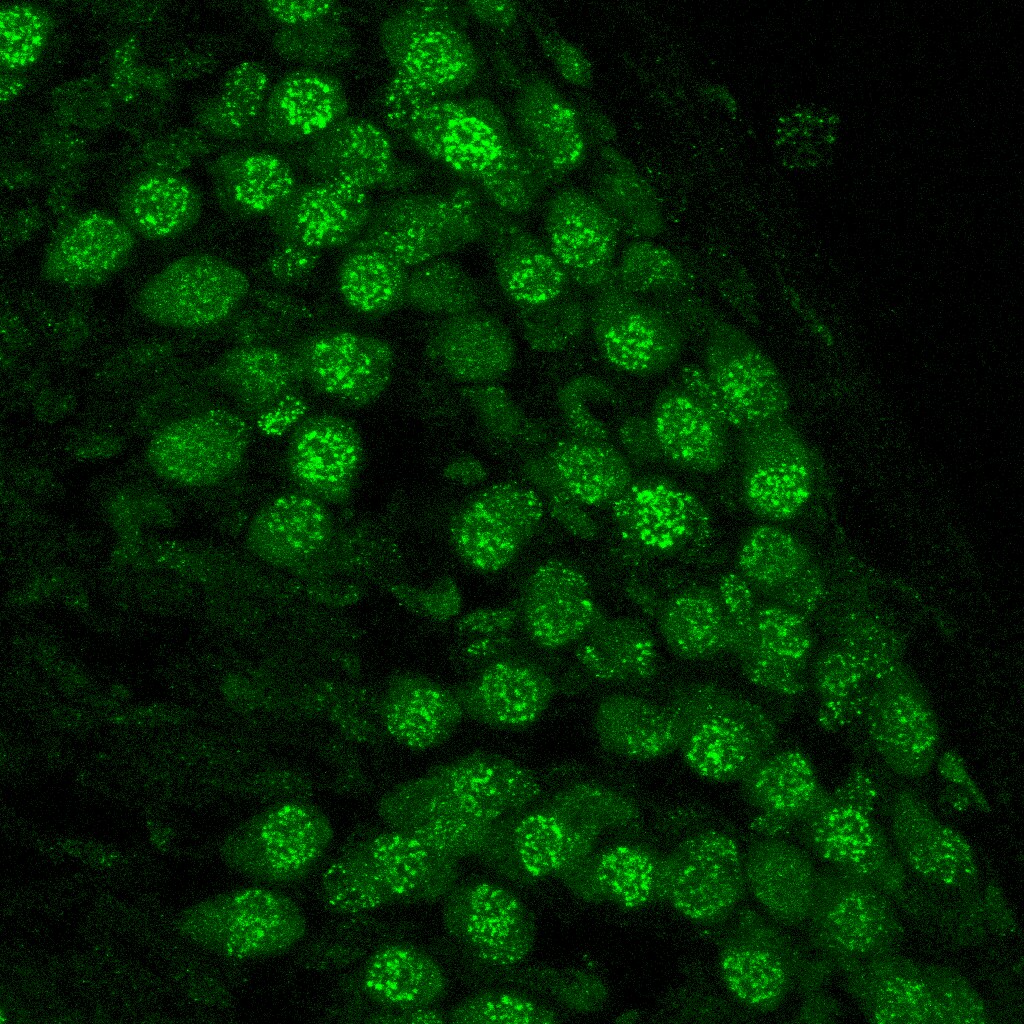
Showing
1
-
5 of
16 reviews
Showing All
Filter By:
-
Application: ImmunofluorescenceSample Tested: Adult lungSpecies: HumanVerified Customer | Posted 09/08/202553BP1 (green) expression in human COPD paraffin section (40x)I stained for 53BP1 in COPD human lungs

-
Application: ImmunocytochemistrySample Tested: Cultured Human KeratinocytesSpecies: HumanVerified Customer | Posted 06/19/2023For 53BP1 staining, samples were incubated for 1 hour with 1:200 53BP1 primary antibody in PBS/BSA 1%, at room temperature. Green: 53BP Blue: DAPI
-
Application: ImmunocytochemistrySample Tested: IMR-90 human lung fibroblast cell lineSpecies: HumanVerified Customer | Posted 05/24/2020Human diploid fibroblast fixed with 4% PFA, permeabilized and stained with 53BP1 (green, foci) and counterstained with DAPI (blue).
-
Application: ImmunocytochemistrySample Tested: Cancer CellsSpecies: HumanVerified Customer | Posted 08/08/2019Cells with 53BP1 bodies after exposure to irradiation 10 Gray. Used in U2OS cells. Cells were fixed 2 hours following irradiation. DNA damages are present and the resulting DNA damages clusters are stain thanks to 53BP1 bodies antibodies.1/1000 dilution
-
Application: ImmunoprecipitationSample Tested: human lung cancer cell lineSpecies: HumanVerified Customer | Posted 02/19/2019Lysates from HCC44 cells in 1% NP40 IP and western blot with 53BP1 novus antibody NB100-304
-
Application: ImmunocytochemistrySample Tested: mouse B cellSpecies: MouseVerified Customer | Posted 02/04/2019
-
Application: Western BlotSample Tested: mouse epithelial pancreatic cancer cellsSpecies: MouseVerified Customer | Posted 11/27/2018Samples (left to right): Cells have been treated with 0.1uM Doxorubicin for 30min, then released to repair DNA for 0, 2, 8 or 24h.Membrane was blocked with 5% non-fat dry milk, 1h RT. Then incubated ON 4C with 53bp1 antibody 1:10000. After washes, membrane was incubated with HRP-conjugated secondary antibody diluted in 5% non-fat dry milk.
-
Application: ImmunocytochemistrySample Tested: Cultured cell linesSpecies: Human and MouseVerified Customer | Posted 08/23/2017Human medulloblastoma (DAOY) and mouse astrocyte (C8D1A) cell lines were exposed for 48 hours to DMSO or 1µg/mL of the DNA damaging agent Etoposide.Cells were immunostained for 53BP1 (green). The nuclei were counterstained with Dapi (blue).
-
Application: ImmunofluorescenceSample Tested: MEFSpecies: MouseVerified Customer | Posted 07/18/2017Mouse Embryonic Fibroblast cells Pre-extraction - 5mins with CSK buffer Fixed with 4% PFA and 75% Ethanol Primary Antibody - 1:1000 Secondary Antibody - 1:1000
-
Application: ImmunocytochemistrySample Tested: A172 Glioblastoma cellsSpecies: HumanVerified Customer | Posted 06/26/2017Upper Panel: Control untreated cells; Lower Panel: Cells exposed to Irradiation (10 Gy) and probed for 53BP1 fociCells were grown on coverslips, fixed with 4% paraformaldehyde, methanol permeabilized, blocked for 1 h, RT. Incubated with 53BP1 (AF488 conjugated) antibody (1:200) overnight, washed 3x with PBS, probed with tubulin (Alexa fluor 594) antibody for 2 h, RT. Washed 3x with PBS, mounted on slides using prolong gold, imaged using Nikon confocal microscope (100x oil).
-
Application: ImmunocytochemistrySample Tested: hela cell and fibroblastsSpecies: HumanVerified Customer | Posted 05/22/2017
-
Application: ImmunocytochemistrySample Tested:Species: HumanVerified Customer | Posted 01/04/2016
-
Application: Western BlotSample Tested: See PMID 23755068Species: HumanVerified Customer | Posted 12/12/2014
-
Application: Immunohistochemistry-FrozenSample Tested: mouse cochlear spiral ganglion cellsSpecies: MouseVerified Customer | Posted 01/21/2014
-
Application: ImmunohistochemistrySample Tested: Mouse thymocytesSpecies: MouseVerified Customer | Posted 07/14/2010
-
Application: ImmunocytochemistrySample Tested: mouse B cellSpecies: MouseVerified Customer | Posted 05/27/2009
There are no reviews that match your criteria.
Protocols
View specific protocols for 53BP1 Antibody - BSA Free (NB100-304):
Protocol for Flow Cytometry Intracellular Staining
Sample Preparation.
1. Grow cells to 60-85% confluency. Flow cytometry requires between 2 x 10⁵ and 1 x 10⁶ cells for optimal performance.
2. If cells are adherent, harvest gently by washing once with staining buffer and then scraping. Avoid using trypsin as this can disrupt certain epitopes of interest. If enzymatic harvest is required, use Accutase, Collagenase, or TrypLE Express for a less damaging option.
3. Reserve 100 uL for counting, then transfer cell volume into a 50 mL conical tube and centrifuge for 8 minutes at 400 RCF.
a. Count cells using a hemocytometer and a 1:1 trypan blue exclusion stain to determine cell viability before starting the flow protocol. If cells appear blue, do not proceed.
4. Re-suspend cells to a concentration of 1 x 10⁶ cells/mL in staining buffer (NBP2-26247).
5. Aliquot out 100 uL samples in accordance with your experimental samples.
Tip: When cell surface and intracellular staining are required in the same sample, it is advisable that the cell surface staining be performed first since the fixation and permeabilization steps might reduce the availability of surface antigens.
Intracellular Staining.
Tip: When performing intracellular staining, it is important to use appropriate fixation and permeabilization reagents based upon the target and its subcellular location. Generally, our Intracellular Flow Assay Kit (NBP2-29450) is a good place to start as it contains an optimized combination of reagents for intracellular staining as well as an inhibitor of intracellular protein transport (necessary if staining secreted proteins). Certain targets may require more gentle or transient permeabilization protocols such as the commonly employed methanol or saponin-based methods.
Protocol for Cytoplasmic Targets:
1. Fix the cells by adding 100 uL fixation solution (such as 4% PFA) to each sample for 10-15 minutes.
2. Permeabilize cells by adding 100 uL of a permeabilization buffer to every 1 x 10⁶ cells present in the sample. Mix well and incubate at room temperature for 15 minutes.
a. For cytoplasmic targets, use a gentle permeabilization solution such as 1X PBS + 0.5% Saponin or 1X PBS + 0.5% Tween-20.
b. To maintain the permeabilized state throughout your experiment, use staining buffer + 0.1% of the permeabilization reagent (i.e. 0.1% Tween-20 or 0.1% Saponin).
3. Following the 15 minute incubation, add 2 mL of the staining buffer + 0.1% permeabilizer to each sample.
4. Centrifuge for 1 minute at 400 RCF.
5. Discard supernatant and re-suspend in 100 uL of staining buffer + 0.1% permeabilizer.
6. Add appropriate amount of each antibody (eg. 1 test or 1 ug per sample, as experimentally determined).
7. Mix well and incubate at room temperature for 30 minutes- 1 hour. Gently mix samples every 10-15 minutes.
8. Following the primary/conjugate incubation, add 1-2 mL/sample of staining buffer +0.1% permeabilizer and centrifuge for 1 minute at 400 RCF.
9. Wash twice by re-suspending cells in staining buffer (2 mL for tubes or 200 uL for wells) and centrifuging at 400 RCF for 5 minutes. Discard supernatant.
10. Add appropriate amount of secondary antibody (as experimentally determined) to each sample.
11. Incubate at room temperature in dark for 20 minutes.
12. Add 1-2 mL of staining buffer and centrifuge at 400 RCF for 1 minute and discard supernatant.
13. Wash twice by re-suspending cells in staining buffer (2 mL for tubes or 200 uL for wells) and centrifuging at 400 RCF for 5 minutes. Discard supernatant.
14. Resuspend in an appropriate volume of staining buffer (usually 500 uL per sample) and proceed with analysis on your flow cytometer.
Immunocytochemistry Protocol
Culture cells to appropriate density in 35 mm culture dishes or 6-well plates.
1. Remove culture medium and wash the cells briefly in PBS. Add 10% formalin to the dish and fix at room temperature for 10 minutes.
2. Remove the formalin and wash the cells in PBS.
3. Permeablize the cells with 0.1% Triton X100 or other suitable detergent for 10 min.
4. Remove the permeablization buffer and wash three times for 10 minutes each in PBS. Be sure to not let the specimen dry out.
5. To block nonspecific antibody binding, incubate in 10% normal goat serum from 1 hour to overnight at room temperature.
6. Add primary antibody at appropriate dilution and incubate overnight at 4C.
7. Remove primary antibody and replace with PBS. Wash three times for 10 minutes each.
8. Add secondary antibody at appropriate dilution. Incubate for 1 hour at room temperature.
9. Remove secondary antibody and replace with PBS. Wash three times for 10 minutes each.
10. Counter stain DNA with DAPi if required.
Immunohistochemistry-Paraffin Embedded Sections
Antigen Unmasking:
Bring slides to a boil in 10 mM sodium citrate buffer (pH 6.0) then maintain at a sub-boiling temperature for 10 minutes. Cool slides on bench-top for 30 minutes (keep slides in the sodium citrate buffer at all times).
Staining:
1. Wash sections in deionized water three times for 5 minutes each.
2. Wash sections in PBS for 5 minutes.
3. Block each section with 100-400 ul blocking solution (1% BSA in PBS) for 1 hour at room temperature.
4. Remove blocking solution and add 100-400 ul diluted primary antibody. Incubate overnight at 4 C.
5. Remove antibody solution and wash sections in wash buffer three times for 5 minutes each.
6. Add 100-400 ul HRP polymer conjugated secondary antibody. Incubate 30 minutes at room temperature.
7. Wash sections three times in wash buffer for 5 minutes each.
8. Add 100-400 ul DAB substrate to each section and monitor staining closely.
9. As soon as the sections develop, immerse slides in deionized water.
10. Counterstain sections in hematoxylin.
11. Wash sections in deionized water two times for 5 minutes each.
12. Dehydrate sections.
13. Mount coverslips.
Western Blot Protocol
1. Perform SDS-PAGE on samples to be analyzed, loading 10-25 ug of total protein per lane.
2. Transfer proteins to PVDF membrane according to the instructions provided by the manufacturer of the membrane and transfer apparatus.
3. Stain the membrane with Ponceau S (or similar product) to assess transfer success, and mark molecular weight standards where appropriate.
4. Rinse the blot TBS -0.05% Tween 20 (TBST).
5. Block the membrane in 5% Non-fat milk in TBST (blocking buffer) for at least 1 hour.
6. Wash the membrane in TBST three times for 10 minutes each.
7. Dilute primary antibody in blocking buffer and incubate overnight at 4C with gentle rocking.
8. Wash the membrane in TBST three times for 10 minutes each.
9. Incubate the membrane in diluted HRP conjugated secondary antibody in blocking buffer (as per manufacturer's instructions) for 1 hour at room temperature.
10. Wash the blot in TBST three times for 10 minutes each (this step can be repeated as required to reduce background).
11. Apply the detection reagent of choice in accordance with the manufacturers instructions.
Find general support by application which include: protocols, troubleshooting, illustrated assays, videos and webinars.
- 7-Amino Actinomycin D (7-AAD) Cell Viability Flow Cytometry Protocol
- Antigen Retrieval Protocol (PIER)
- Antigen Retrieval for Frozen Sections Protocol
- Appropriate Fixation of IHC/ICC Samples
- Cellular Response to Hypoxia Protocols
- Chromogenic IHC Staining of Formalin-Fixed Paraffin-Embedded (FFPE) Tissue Protocol
- Chromogenic Immunohistochemistry Staining of Frozen Tissue
- ClariTSA™ Fluorophore Kits
- Detection & Visualization of Antibody Binding
- Extracellular Membrane Flow Cytometry Protocol
- Flow Cytometry Protocol for Cell Surface Markers
- Flow Cytometry Protocol for Staining Membrane Associated Proteins
- Flow Cytometry Staining Protocols
- Flow Cytometry Troubleshooting Guide
- Fluorescent IHC Staining of Frozen Tissue Protocol
- Graphic Protocol for Heat-induced Epitope Retrieval
- Graphic Protocol for the Preparation and Fluorescent IHC Staining of Frozen Tissue Sections
- Graphic Protocol for the Preparation and Fluorescent IHC Staining of Paraffin-embedded Tissue Sections
- Graphic Protocol for the Preparation of Gelatin-coated Slides for Histological Tissue Sections
- ICC Cell Smear Protocol for Suspension Cells
- ICC Immunocytochemistry Protocol Videos
- ICC for Adherent Cells
- IHC Sample Preparation (Frozen sections vs Paraffin)
- Immunocytochemistry (ICC) Protocol
- Immunocytochemistry Troubleshooting
- Immunofluorescence of Organoids Embedded in Cultrex Basement Membrane Extract
- Immunofluorescent IHC Staining of Formalin-Fixed Paraffin-Embedded (FFPE) Tissue Protocol
- Immunohistochemistry (IHC) and Immunocytochemistry (ICC) Protocols
- Immunohistochemistry Frozen Troubleshooting
- Immunohistochemistry Paraffin Troubleshooting
- Immunoprecipitation Protocol
- Intracellular Flow Cytometry Protocol Using Alcohol (Methanol)
- Intracellular Flow Cytometry Protocol Using Detergents
- Intracellular Nuclear Staining Flow Cytometry Protocol Using Detergents
- Intracellular Staining Flow Cytometry Protocol Using Alcohol Permeabilization
- Intracellular Staining Flow Cytometry Protocol Using Detergents to Permeabilize Cells
- Preparing Samples for IHC/ICC Experiments
- Preventing Non-Specific Staining (Non-Specific Binding)
- Primary Antibody Selection & Optimization
- Propidium Iodide Cell Viability Flow Cytometry Protocol
- Protocol for Heat-Induced Epitope Retrieval (HIER)
- Protocol for Liperfluo
- Protocol for Making a 4% Formaldehyde Solution in PBS
- Protocol for VisUCyte™ HRP Polymer Detection Reagent
- Protocol for the Characterization of Human Th22 Cells
- Protocol for the Characterization of Human Th9 Cells
- Protocol for the Fluorescent ICC Staining of Cell Smears - Graphic
- Protocol for the Fluorescent ICC Staining of Cultured Cells on Coverslips - Graphic
- Protocol for the Preparation & Fixation of Cells on Coverslips
- Protocol for the Preparation and Chromogenic IHC Staining of Frozen Tissue Sections
- Protocol for the Preparation and Chromogenic IHC Staining of Frozen Tissue Sections - Graphic
- Protocol for the Preparation and Chromogenic IHC Staining of Paraffin-embedded Tissue Sections
- Protocol for the Preparation and Chromogenic IHC Staining of Paraffin-embedded Tissue Sections - Graphic
- Protocol for the Preparation and Fluorescent ICC Staining of Cells on Coverslips
- Protocol for the Preparation and Fluorescent ICC Staining of Non-adherent Cells
- Protocol for the Preparation and Fluorescent ICC Staining of Stem Cells on Coverslips
- Protocol for the Preparation and Fluorescent IHC Staining of Frozen Tissue Sections
- Protocol for the Preparation and Fluorescent IHC Staining of Paraffin-embedded Tissue Sections
- Protocol for the Preparation of Gelatin-coated Slides for Histological Tissue Sections
- Protocol for the Preparation of a Cell Smear for Non-adherent Cell ICC - Graphic
- Protocol: Annexin V and PI Staining by Flow Cytometry
- Protocol: Annexin V and PI Staining for Apoptosis by Flow Cytometry
- R&D Systems Quality Control Western Blot Protocol
- TUNEL and Active Caspase-3 Detection by IHC/ICC Protocol
- The Importance of IHC/ICC Controls
- Troubleshooting Guide: Fluorokine Flow Cytometry Kits
- Troubleshooting Guide: Immunohistochemistry
- Troubleshooting Guide: Western Blot Figures
- Western Blot Conditions
- Western Blot Protocol
- Western Blot Protocol for Cell Lysates
- Western Blot Troubleshooting
- Western Blot Troubleshooting Guide
- View all Protocols, Troubleshooting, Illustrated assays and Webinars
FAQs for 53BP1 Antibody - BSA Free
Showing
1
-
4 of
4 FAQs
Showing All
-
Q: Hello I want to ask you for an advice in case of antibodies. In our research we focus on DNA repair foci and use your Novus antibodies for phosphorylated histone H2AX (monoclonal mouse) and protein 53BP1(polyclonal rabbit). Now we want to use antobody for phosphorylated 53BP1 protein to increase specifity and I want to ask you which from your NOVUS antibodies will be the best for us.
A:
We currently stock just one antibody to phosphorylated 53BP1, which you can see at the following link: NB100-1803. This is guaranteed for detection of 53BP1 (pSer25) in human and mouse samples by WB, FLOW, ICC/IF,IHC-P, IP and PLA. As this antibody is a rabbit polyclonal, you would be unable to stain for both 53BP1 and its phosphorylated isoform in the same sample, unless you used an antibody from a different host for detection of total 53BP1 or used directly conjugated primaries. Our mouse monoclonal to 53BP1, with catalogue number NBP2-25028, is validated for detection of the human protein by WB, FLOW and IHC. Unfortunately we do not currently stock any other antibodies to phosphorylated 53BP1.
-
Q: Is possible to know the exact sequence of the epitope used?
A: Unfortunately I am unable to disclose the sequence of this antibody due to proprietary restrictions. At the site recognized by NB100-304, the reference sequences are too divergent to expect NB100-304 to bind to either Bovine or Little Brown Bat. Regarding Mouse Homology, 30/34 sites of the immunogen are homologous Human - 100% homologous. If you would be interested in testing these novel species, please take a look at our Innovator's Reward program.
-
Q: We're looking for anti53BP1 antibody covalently labeled with a fluorofor preferabley Cy3. Do you make it?
A:
We sell 53BP1 antibodies available conjugated to DyLight 488, 550 (very similar in spectrum to Cy3) and 650. You may also purchase the unlabeled antibodies and conjugate them to the fluorophores of your choice. The catalog numbers that you may be interested in are: NB100-904R, NB100-304R, NB100-305R.
-
Q: What is the recommended pH of sodium citrate for the 53bp1 antibody (NB100-304)?
A: I have checked our notes for use of this antibody in IHC, and they say: 1:500 to 1:2,000. Epitope retrieval with citrate buffer pH6.0 is recommended for FFPE tissue sections.
-
Q: Hello I want to ask you for an advice in case of antibodies. In our research we focus on DNA repair foci and use your Novus antibodies for phosphorylated histone H2AX (monoclonal mouse) and protein 53BP1(polyclonal rabbit). Now we want to use antobody for phosphorylated 53BP1 protein to increase specifity and I want to ask you which from your NOVUS antibodies will be the best for us.
A:
We currently stock just one antibody to phosphorylated 53BP1, which you can see at the following link: NB100-1803. This is guaranteed for detection of 53BP1 (pSer25) in human and mouse samples by WB, FLOW, ICC/IF,IHC-P, IP and PLA. As this antibody is a rabbit polyclonal, you would be unable to stain for both 53BP1 and its phosphorylated isoform in the same sample, unless you used an antibody from a different host for detection of total 53BP1 or used directly conjugated primaries. Our mouse monoclonal to 53BP1, with catalogue number NBP2-25028, is validated for detection of the human protein by WB, FLOW and IHC. Unfortunately we do not currently stock any other antibodies to phosphorylated 53BP1.
-
Q: Is possible to know the exact sequence of the epitope used?
A: Unfortunately I am unable to disclose the sequence of this antibody due to proprietary restrictions. At the site recognized by NB100-304, the reference sequences are too divergent to expect NB100-304 to bind to either Bovine or Little Brown Bat. Regarding Mouse Homology, 30/34 sites of the immunogen are homologous Human - 100% homologous. If you would be interested in testing these novel species, please take a look at our Innovator's Reward program.
-
Q: We're looking for anti53BP1 antibody covalently labeled with a fluorofor preferabley Cy3. Do you make it?
A:
We sell 53BP1 antibodies available conjugated to DyLight 488, 550 (very similar in spectrum to Cy3) and 650. You may also purchase the unlabeled antibodies and conjugate them to the fluorophores of your choice. The catalog numbers that you may be interested in are: NB100-904R, NB100-304R, NB100-305R.
-
Q: What is the recommended pH of sodium citrate for the 53bp1 antibody (NB100-304)?
A: I have checked our notes for use of this antibody in IHC, and they say: 1:500 to 1:2,000. Epitope retrieval with citrate buffer pH6.0 is recommended for FFPE tissue sections.
Loading...