
AG-2 (Anterior gradient protein 2; also AGR2, GOB4 and HPC8) is an 18‑21 kDa member of the PDI family of enzymes. It is expressed in secretory cell types, such as prostate epithelium, small intestine goblet, Paneth and enteroendocrine cells, and multiple carcinoma cell types. Although AG-2 possesses a signal sequence, it appears to be rarely secreted, instead being found in the ER due the presence of a KTEL ER retention signal at its C-terminus. AG-2 forms transient disulfide linkages with molecules destined for secretion, possibly aiding protein folding. Mature human AG-2 is 155 amino acids (aa) in length (aa 21‑175). Cys81 is presumed to participate in intermolecular bond formation. There is one potential alternative start site 20 aa upstream of the standard start site. Over aa 21‑175, human AG-2 shares 94% aa identity with mouse AG-2.
Human AG-2/AGR2 Antibody
R&D Systems | Catalog # AF6068


Scientific images may be resized, cropped, or adjusted for brightness or contrast for presentation purposes. These updates are limited to presentation and do not affect the underlying scientific interpretation of the data. Where available, additional source data may be provided upon request.
Key Product Details
Species Reactivity
Validated:
Cited:
Applications
Validated:
Cited:
Label
Antibody Source
Product Specifications
Immunogen
Arg21-Leu175
Accession # O95994
Specificity
Clonality
Host
Isotype
Scientific Data Images for Human AG-2/AGR2 Antibody
Detection of Human AG-2/AGR2 by Western Blot.
Western blot shows lysates of A549 human lung carcinoma cell line and human small intestine tissue. PVDF Membrane was probed with 1 µg/mL of Sheep Anti-Human AG-2/AGR2 Antigen Affinity-purified Polyclonal Antibody (Catalog # AF6068) followed by HRP-conjugated Anti-Sheep IgG Secondary Antibody (Catalog # HAF016). A specific band was detected for AG-2/AGR2 at approximately 20 kDa (as indicated). This experiment was conducted under reducing conditions and using Immunoblot Buffer Group 8.
AG-2/AGR2 in Human Breast Cancer Tissue.
AG-2/AGR2 was detected in immersion fixed paraffin-embedded sections of human breast cancer tissue using Sheep Anti-Human AG-2/AGR2 Antigen Affinity-purified Polyclonal Antibody (Catalog # AF6068) at 10 µg/mL overnight at 4 °C. Tissue was stained using the Anti-Sheep HRP-DAB Cell & Tissue Staining Kit (brown; Catalog # CTS019) and counterstained with hematoxylin (blue). Specific staining was localized to plasma membrane in cancer cells. View our protocol for Chromogenic IHC Staining of Paraffin-embedded Tissue Sections.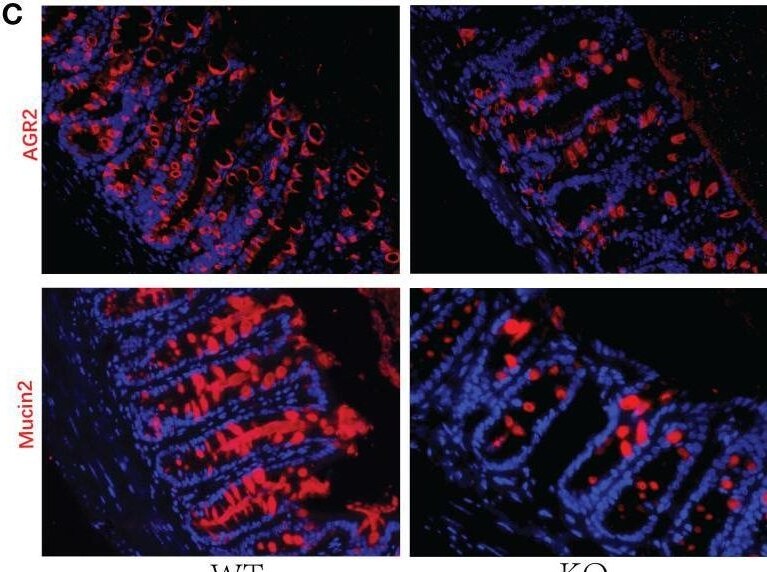
Detection of e0zxolzaoccsimhuoav6.jpg by Immunohistochemistry
Decreased GC numbers and weakened mucus layer in GC Piezo1-/- mice. (A) The mucus layer in colon tissue by AB-PAS staining. 200×. (B) the number of goblet cells and the thickness of the inner mucus layer from two groups. (C) The typical immunofluorescent images of colon tissues were stained with DAPI (blue) and Mucin2 (red) or AGR2 (red) and were observed using a confocal laser-scanning microscope. 400×. (D) The relative mean fluorescence intensity of AGR2, Mucin2. (E) The relative mRNA expression of Mucin2, AGR2, and TFF3 in colonic tissue. (F) The relative mRNA expression of DOCK4, Hes1, Spdef, and Klf4 in colonic tissue. Data are expressed as the mean ± SEM. (n = 5). *p < 0.05, **p < 0.01, ***p < 0.001;. ns, no significance. Image collected and cropped by CiteAb from the following open publication (https://pubmed.ncbi.nlm.nih.gov/36425784), licensed under a CC-BY license. Not internally tested by R&D Systems.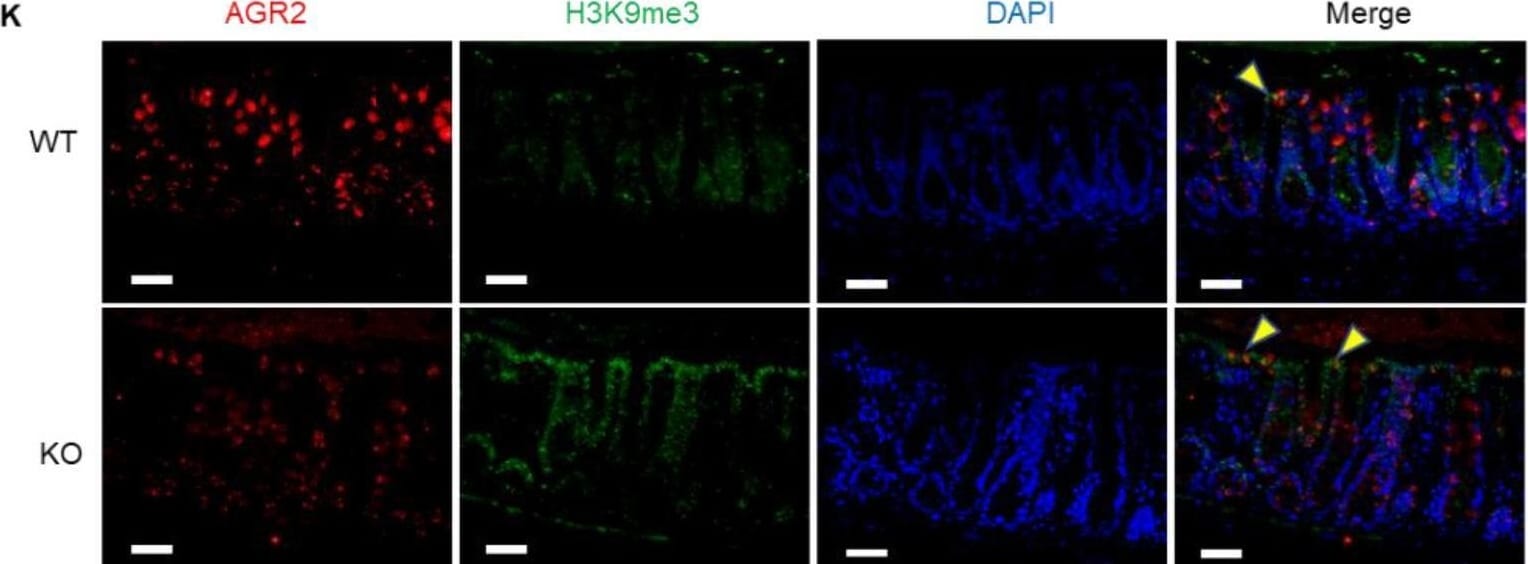
Detection of gy8g5kpfalnhjsugszqt.jpg by Immunohistochemistry
Decreased mucus expression and increased methylation in the Piezo1 flox-mucin2 Cre mice. A Immunohistochemistry of Piezo1 in WT and Piezo1 flox-mucin2 Cre mice (KO mice); bar length: 20 μm. B Western blot of Piezo1 in WT and KO mice. C, D Alcian staining and statistical analysis of mucus thickness in WT and KO mice (n ≥ 6); bar length: 50 μm. E RT-PCR of mucin2 in WT and KO mice (n ≥ 6). F, G Immunofluorescence and statistical analysis of goblet cells/ epithelial cells in WT and KO mice (n ≥ 6); bar length: 20 μm. H FISH of WT and KO mice, mucus was stained with UEA1 (green), bacteria were detected by fluorescence in situ hybridization with general bacterial 16S probes EUB (red) and DNA stained using DAPI (blue); bar length: 20 μm. I–J Western blot and statistical analysis of SUV39h1, Hdac3 and H3K9me3 in the colon mucosa of WT and KO mice. K Immunofluorescence for co-localization of AGR2 (label of goblet cells) and Piezo1 in intestinal mucosa of WT and KO mice; bar length: 20 μm Image collected and cropped by CiteAb from the following open publication (https://pubmed.ncbi.nlm.nih.gov/36631841), licensed under a CC-BY license. Not internally tested by R&D Systems.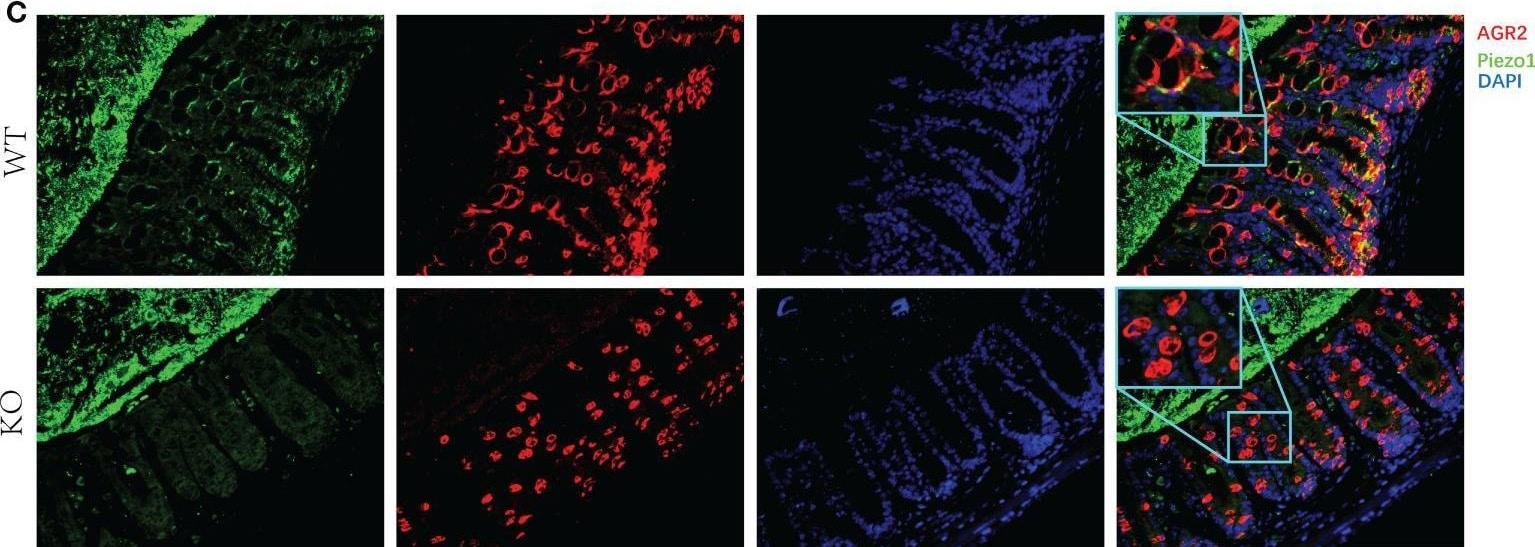
Detection of hfx63h772x3b3pha9mga.jpg by Immunohistochemistry
Expression of Piezo1 in colon. (A) Expression of Piezo1 in colon. (B) Relative mRNA expression of Piezo1. (C) The co-localization of AGR2 and GC Piezo1 in colon (400×). Data are expressed as the mean ± SEM (n =4-5). *p < 0.05. Image collected and cropped by CiteAb from the following open publication (https://pubmed.ncbi.nlm.nih.gov/36425784), licensed under a CC-BY license. Not internally tested by R&D Systems.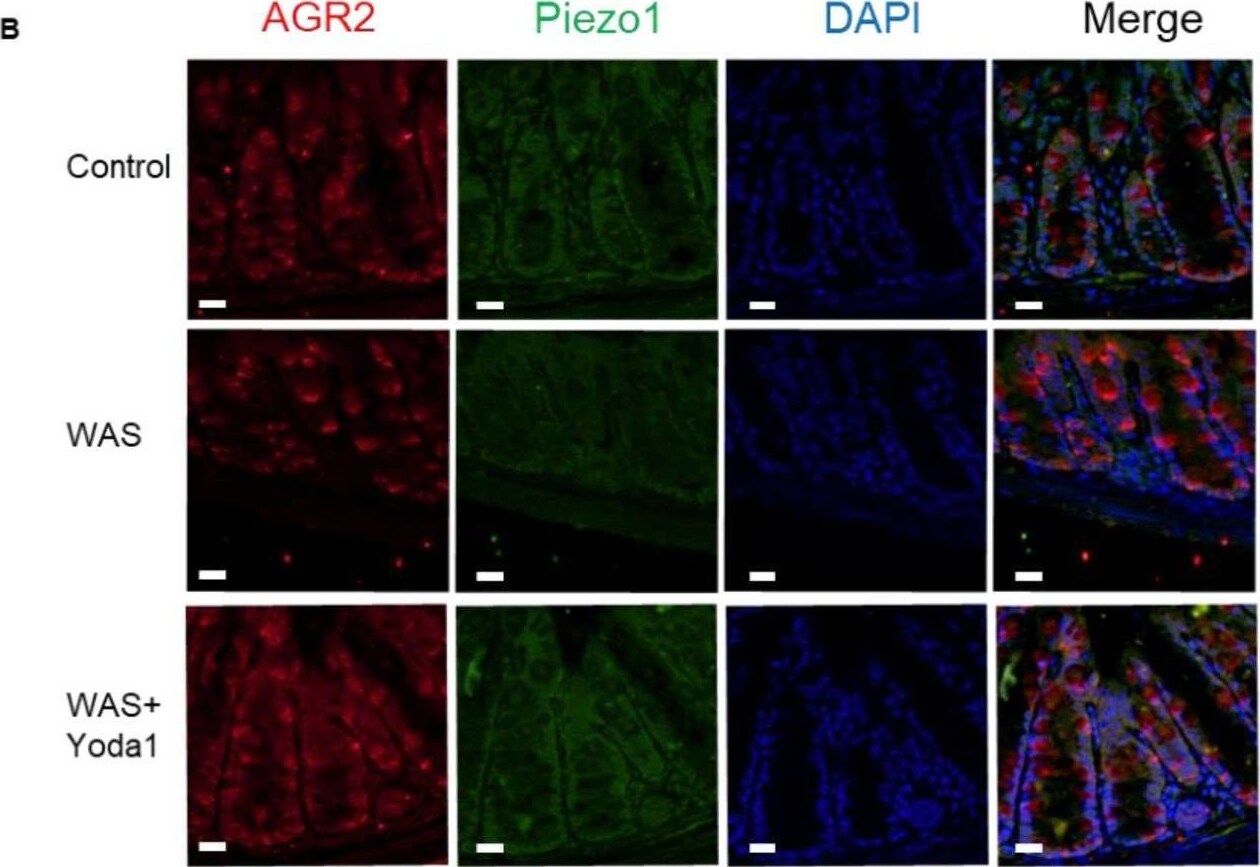
Detection of hqhzy4vxxzxnptablo9s.jpg by Immunohistochemistry
Piezo1 agonist Yoda1 reduced the methylation of intestinal mucosa in WAS model mice. A Immunofluorescence for co-localization of AGR2 and H3K9me3 in intestinal mucosa of control, WAS and WAS + Yoda1 mice; bar length: 20 μm. B Immunofluorescence for co-localization of AGR2 and Piezo1 in intestinal mucosa of control, WAS and WAS + Yoda1 mice; bar length: 20 μm. C Western blot of Piezo1, Suv39h1, Hdac3, GAPDH, H3K9me3 and T-H3 in the control and WAS mice (n ≥ 6). D Statistical analysis of protein in panel C. E RT-PCR of Piezo1, EDEM1, GRP78, ATF4 mRNA in the mucosa of control, WAS and WAS + Yoda1 mice (n ≥ 6). F Schematic showed that Yoda1 reduced the H3K9me3 modification on the mucin2 promoter by reducing Hdac3 and SUV39h1 Image collected and cropped by CiteAb from the following open publication (https://pubmed.ncbi.nlm.nih.gov/36631841), licensed under a CC-BY license. Not internally tested by R&D Systems.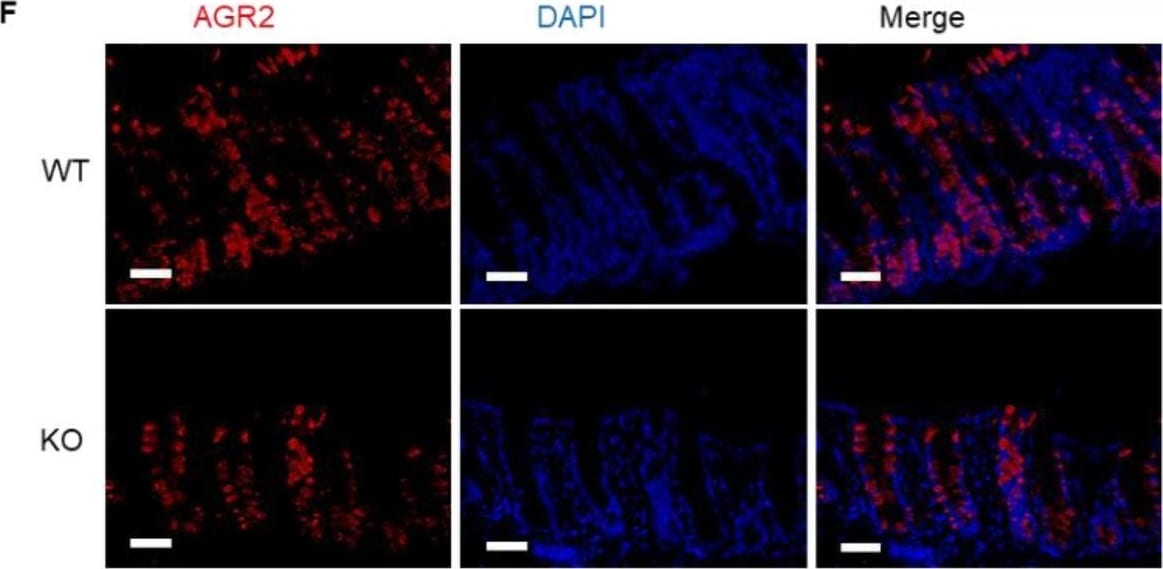
Detection of AG-2/AGR2 by Immunohistochemistry
Decreased mucus expression and increased methylation in the Piezo1 flox-mucin2 Cre mice. A Immunohistochemistry of Piezo1 in WT and Piezo1 flox-mucin2 Cre mice (KO mice); bar length: 20 μm. B Western blot of Piezo1 in WT and KO mice. C, D Alcian staining and statistical analysis of mucus thickness in WT and KO mice (n ≥ 6); bar length: 50 μm. E RT-PCR of mucin2 in WT and KO mice (n ≥ 6). F, G Immunofluorescence and statistical analysis of goblet cells/ epithelial cells in WT and KO mice (n ≥ 6); bar length: 20 μm. H FISH of WT and KO mice, mucus was stained with UEA1 (green), bacteria were detected by fluorescence in situ hybridization with general bacterial 16S probes EUB (red) and DNA stained using DAPI (blue); bar length: 20 μm. I–J Western blot and statistical analysis of SUV39h1, Hdac3 and H3K9me3 in the colon mucosa of WT and KO mice. K Immunofluorescence for co-localization of AGR2 (label of goblet cells) and Piezo1 in intestinal mucosa of WT and KO mice; bar length: 20 μm Image collected and cropped by CiteAb from the following open publication (https://pubmed.ncbi.nlm.nih.gov/36631841), licensed under a CC-BY license. Not internally tested by R&D Systems.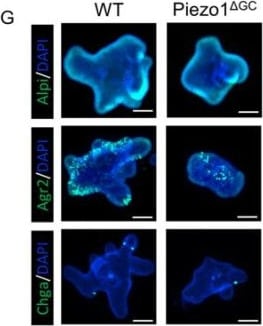
Detection of AG-2/AGR2 by Immunocytochemistry/ Immunofluorescence
Decreased self-renewal capacity of colon stem cells from Piezo1 delta GC mice. (A) Representative images of colonoids from WT and Piezo1 delta GC mice at day 5. Images of one colonoid on day 1, 3, and 5 are below, reflecting the growth process of a colonoid. Scale bar: 100 μm. (B–D) Indicators related to colonoids growth: number of buds per colonoid (B), surface area per colonoid (C), and percentage of colonoids with buds per well (D). (E) Immunofluorescence staining of EDU and Ki67 in colonoids from WT and Piezo1 delta GC mice. Scale bar: 100 μm. (F) Statistical analysis of EDU and Ki67 positive cell ratio in (E). (G) Immunofluorescence staining of differentiated colonocyte (Alpi), goblet cell (Agr2), and enteroendocrine cell (Chga) in colonoids from WT and Piezo1 delta GC mice. Scale bar: 100 μm. (H) Statistical analysis of Alpi, Agr2, and Chga positive cell ratio in (G). (I) RNA levels of Ki67 from WT and Piezo1 delta GC mouse colonoids (normalized to GAPDH). (J) AB-PAS staining of colonoids from WT and Piezo1 delta GC mice. The red arrows indicate mucus secreted by goblet cells in colonoids. Scale bar: 100 μm. At least three independent experiments were conducted. Data are presented as the mean ± SEM. (n = 5 mice). ns, not significant; * p < 0.05; ** p < 0.01; *** p < 0.001. Image collected and cropped by CiteAb from the following open publication (https://pubmed.ncbi.nlm.nih.gov/37762681), licensed under a CC-BY license. Not internally tested by R&D Systems.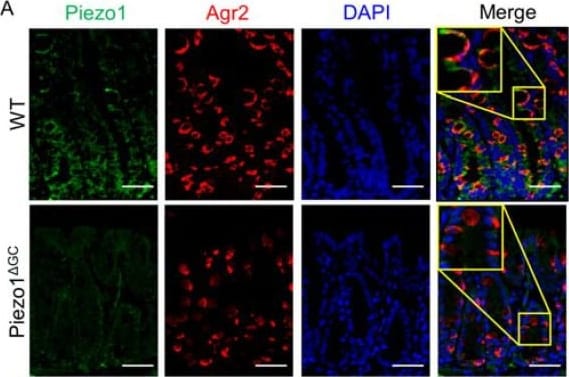
Detection of AG-2/AGR2 by Immunohistochemistry
Identification of Piezo1 delta GC mice. (A) Immunofluorescence co-localization of Piezo1 and Agr2 (label goblet cells) in WT and Piezo1 delta GC mouse colons. The yellow box shows a magnified localized image. Scale bar: 100 μm. (B) mRNA level of Piezo1 in WT and Piezo1 delta GC mouse colon crypts (normalized to GAPDH). At least three independent experiments were conducted. Data are expressed as the mean ± SEM. (n = 5 mice). ** p < 0.01. Image collected and cropped by CiteAb from the following open publication (https://pubmed.ncbi.nlm.nih.gov/37762681), licensed under a CC-BY license. Not internally tested by R&D Systems.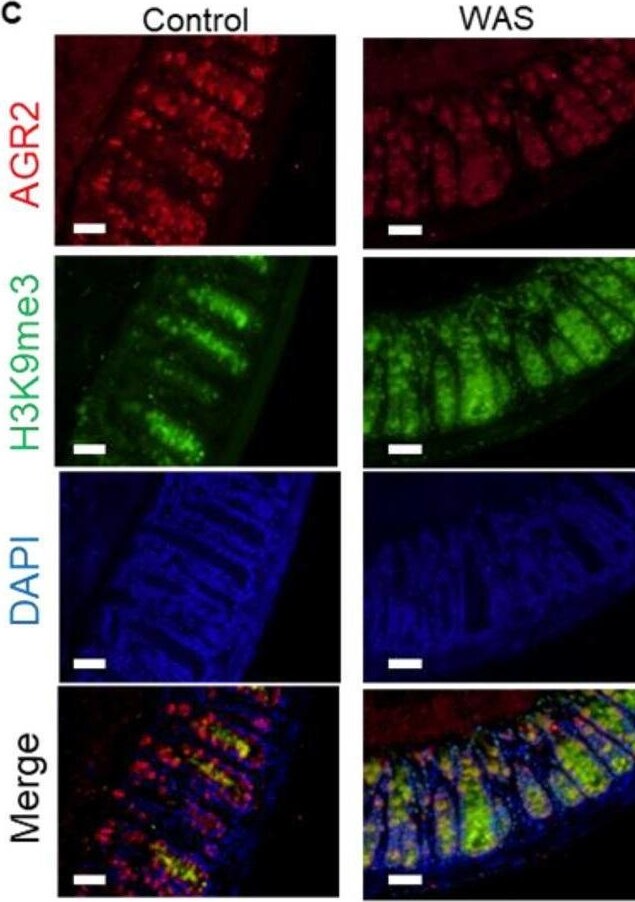
Detection of AG-2/AGR2 by Immunohistochemistry
Decreased Piezo1 and enhanced methylation in the intestinal mucosa of WAS model mice. A Western blot of Piezo1, Suv39h1, Hdac3, GAPDH, H3K9me3 and T-H3 (Internal parameter for nuclear protein H3K9me3) in the mucosa of control and WAS mice. B Statistical analysis of protein expression in panel A. C Immunofluorescence for co-localization of AGR2 (label of goblet cells) and H3K9me3 in intestinal mucosa of control and WAS mice; bar length: 20 μm. D Immunofluorescence for co-localization of AGR2 (label of goblet cells) and Piezo1 in intestinal mucosa of control and WAS mice; bar length: 20 μm Image collected and cropped by CiteAb from the following open publication (https://pubmed.ncbi.nlm.nih.gov/36631841), licensed under a CC-BY license. Not internally tested by R&D Systems.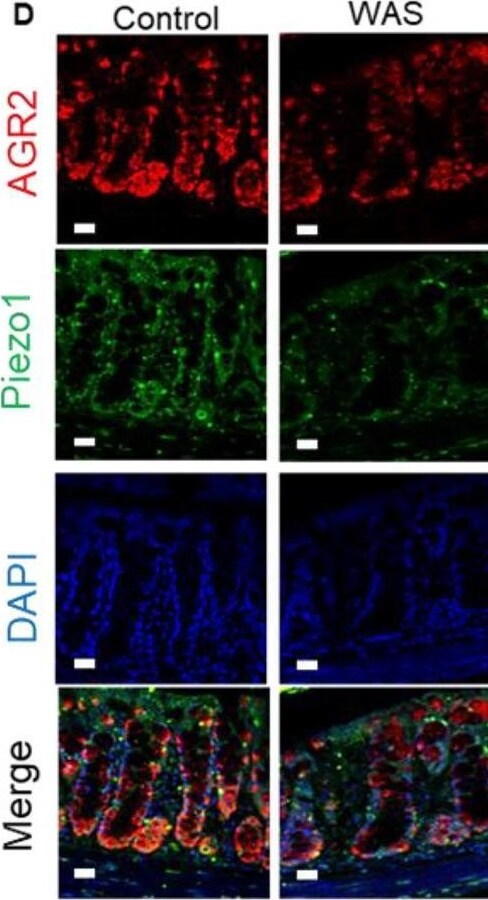
Detection of AG-2/AGR2 by Immunohistochemistry
Decreased Piezo1 and enhanced methylation in the intestinal mucosa of WAS model mice. A Western blot of Piezo1, Suv39h1, Hdac3, GAPDH, H3K9me3 and T-H3 (Internal parameter for nuclear protein H3K9me3) in the mucosa of control and WAS mice. B Statistical analysis of protein expression in panel A. C Immunofluorescence for co-localization of AGR2 (label of goblet cells) and H3K9me3 in intestinal mucosa of control and WAS mice; bar length: 20 μm. D Immunofluorescence for co-localization of AGR2 (label of goblet cells) and Piezo1 in intestinal mucosa of control and WAS mice; bar length: 20 μm Image collected and cropped by CiteAb from the following open publication (https://pubmed.ncbi.nlm.nih.gov/36631841), licensed under a CC-BY license. Not internally tested by R&D Systems.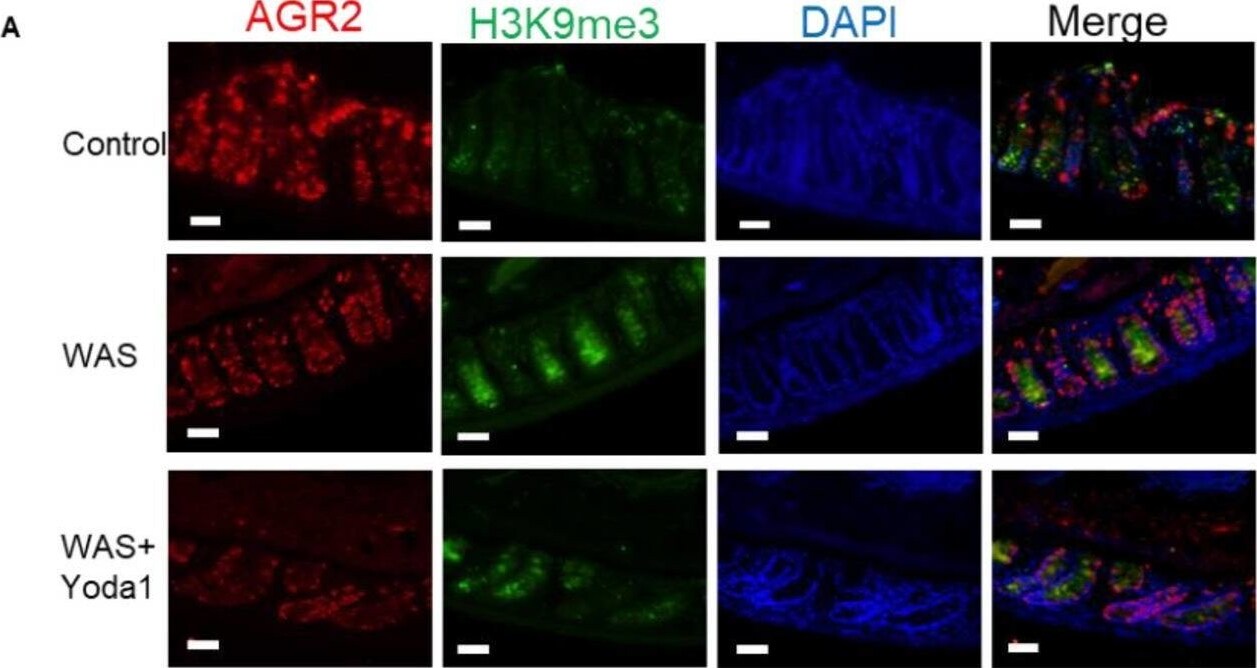
Detection of AG-2/AGR2 by Immunohistochemistry
Piezo1 agonist Yoda1 reduced the methylation of intestinal mucosa in WAS model mice. A Immunofluorescence for co-localization of AGR2 and H3K9me3 in intestinal mucosa of control, WAS and WAS + Yoda1 mice; bar length: 20 μm. B Immunofluorescence for co-localization of AGR2 and Piezo1 in intestinal mucosa of control, WAS and WAS + Yoda1 mice; bar length: 20 μm. C Western blot of Piezo1, Suv39h1, Hdac3, GAPDH, H3K9me3 and T-H3 in the control and WAS mice (n ≥ 6). D Statistical analysis of protein in panel C. E RT-PCR of Piezo1, EDEM1, GRP78, ATF4 mRNA in the mucosa of control, WAS and WAS + Yoda1 mice (n ≥ 6). F Schematic showed that Yoda1 reduced the H3K9me3 modification on the mucin2 promoter by reducing Hdac3 and SUV39h1 Image collected and cropped by CiteAb from the following open publication (https://pubmed.ncbi.nlm.nih.gov/36631841), licensed under a CC-BY license. Not internally tested by R&D Systems.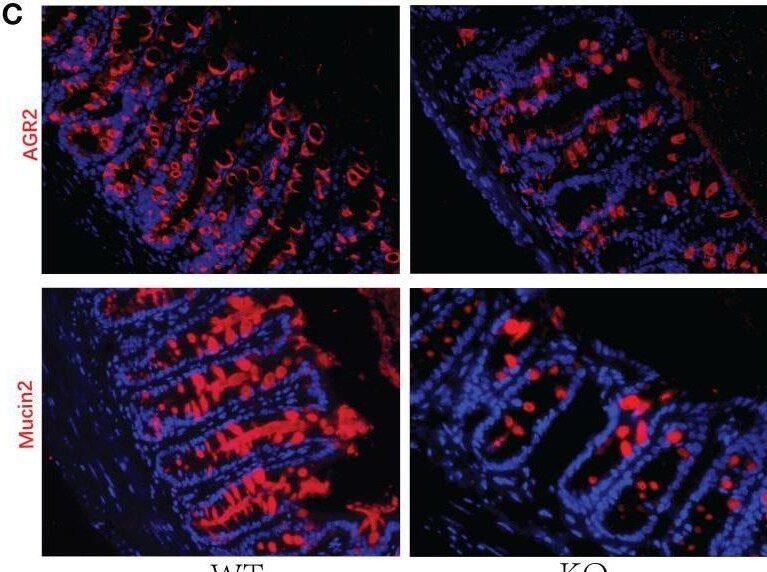
Detection of AG-2/AGR2 by Immunohistochemistry
Decreased GC numbers and weakened mucus layer in GC Piezo1-/- mice. (A) The mucus layer in colon tissue by AB-PAS staining. 200×. (B) the number of goblet cells and the thickness of the inner mucus layer from two groups. (C) The typical immunofluorescent images of colon tissues were stained with DAPI (blue) and Mucin2 (red) or AGR2 (red) and were observed using a confocal laser-scanning microscope. 400×. (D) The relative mean fluorescence intensity of AGR2, Mucin2. (E) The relative mRNA expression of Mucin2, AGR2, and TFF3 in colonic tissue. (F) The relative mRNA expression of DOCK4, Hes1, Spdef, and Klf4 in colonic tissue. Data are expressed as the mean ± SEM. (n = 5). *p < 0.05, **p < 0.01, ***p < 0.001;. ns, no significance. Image collected and cropped by CiteAb from the following open publication (https://pubmed.ncbi.nlm.nih.gov/36425784), licensed under a CC-BY license. Not internally tested by R&D Systems.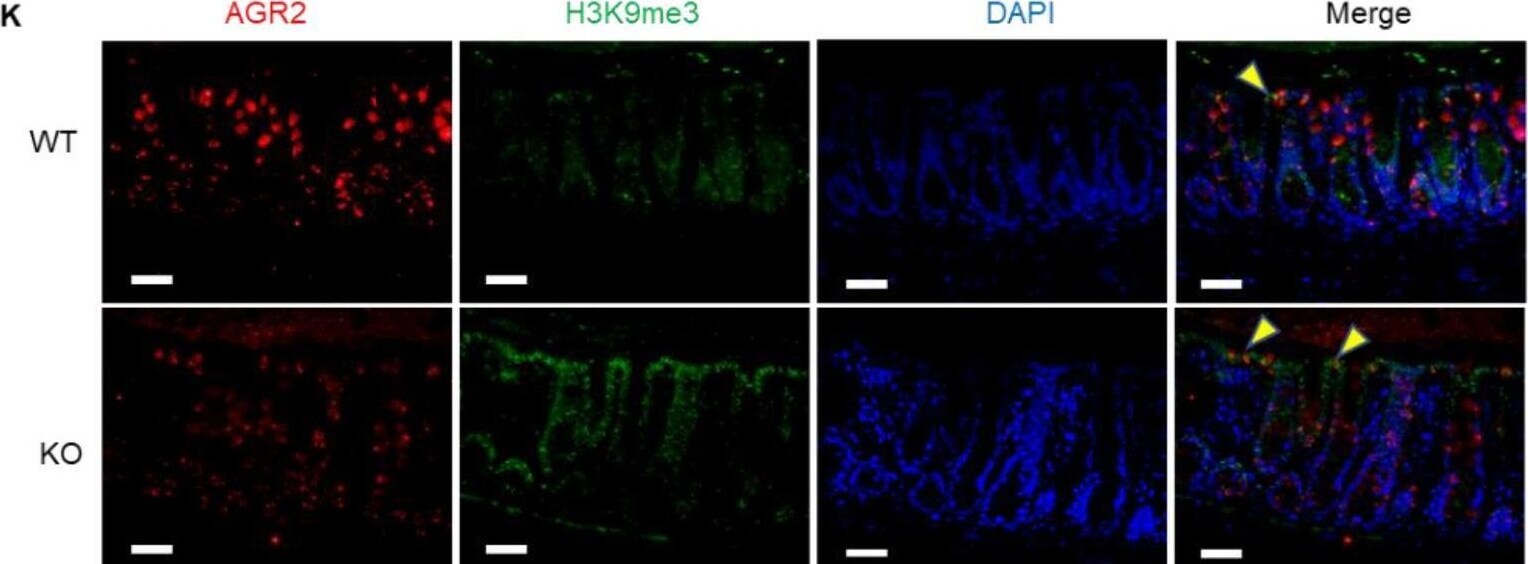
Detection of AG-2/AGR2 by Immunohistochemistry
Decreased mucus expression and increased methylation in the Piezo1 flox-mucin2 Cre mice. A Immunohistochemistry of Piezo1 in WT and Piezo1 flox-mucin2 Cre mice (KO mice); bar length: 20 μm. B Western blot of Piezo1 in WT and KO mice. C, D Alcian staining and statistical analysis of mucus thickness in WT and KO mice (n ≥ 6); bar length: 50 μm. E RT-PCR of mucin2 in WT and KO mice (n ≥ 6). F, G Immunofluorescence and statistical analysis of goblet cells/ epithelial cells in WT and KO mice (n ≥ 6); bar length: 20 μm. H FISH of WT and KO mice, mucus was stained with UEA1 (green), bacteria were detected by fluorescence in situ hybridization with general bacterial 16S probes EUB (red) and DNA stained using DAPI (blue); bar length: 20 μm. I–J Western blot and statistical analysis of SUV39h1, Hdac3 and H3K9me3 in the colon mucosa of WT and KO mice. K Immunofluorescence for co-localization of AGR2 (label of goblet cells) and Piezo1 in intestinal mucosa of WT and KO mice; bar length: 20 μm Image collected and cropped by CiteAb from the following open publication (https://pubmed.ncbi.nlm.nih.gov/36631841), licensed under a CC-BY license. Not internally tested by R&D Systems.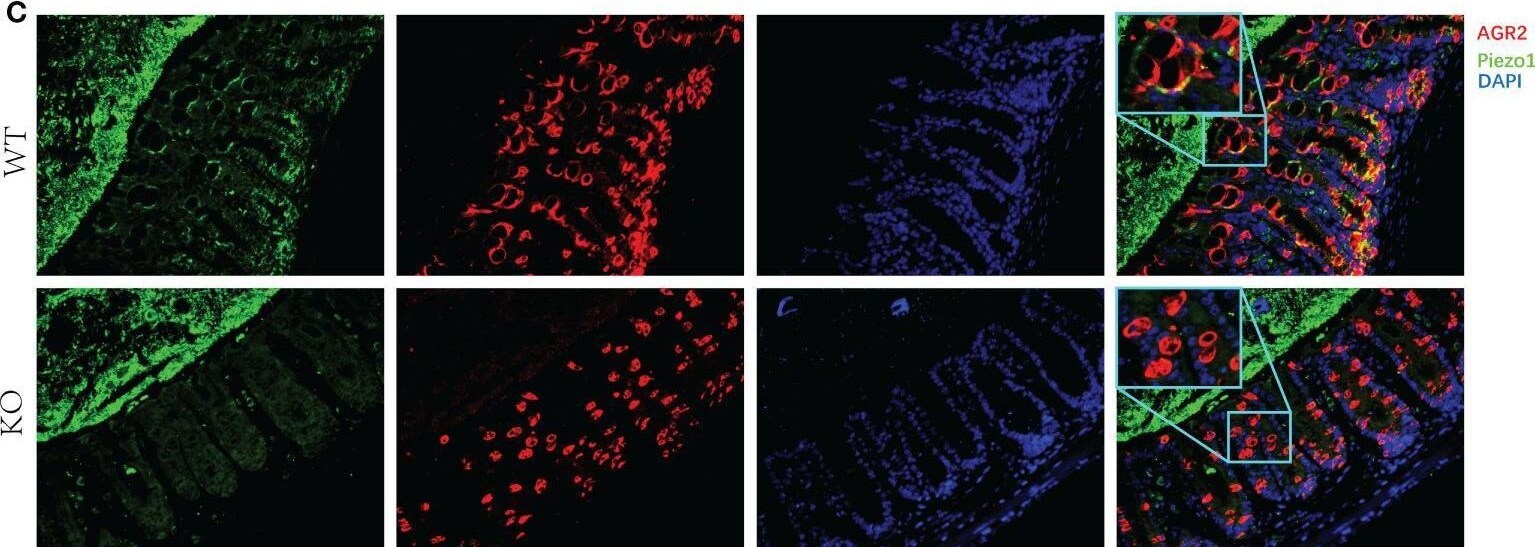
Detection of AG-2/AGR2 by Immunohistochemistry
Expression of Piezo1 in colon. (A) Expression of Piezo1 in colon. (B) Relative mRNA expression of Piezo1. (C) The co-localization of AGR2 and GC Piezo1 in colon (400×). Data are expressed as the mean ± SEM (n =4-5). *p < 0.05. Image collected and cropped by CiteAb from the following open publication (https://pubmed.ncbi.nlm.nih.gov/36425784), licensed under a CC-BY license. Not internally tested by R&D Systems.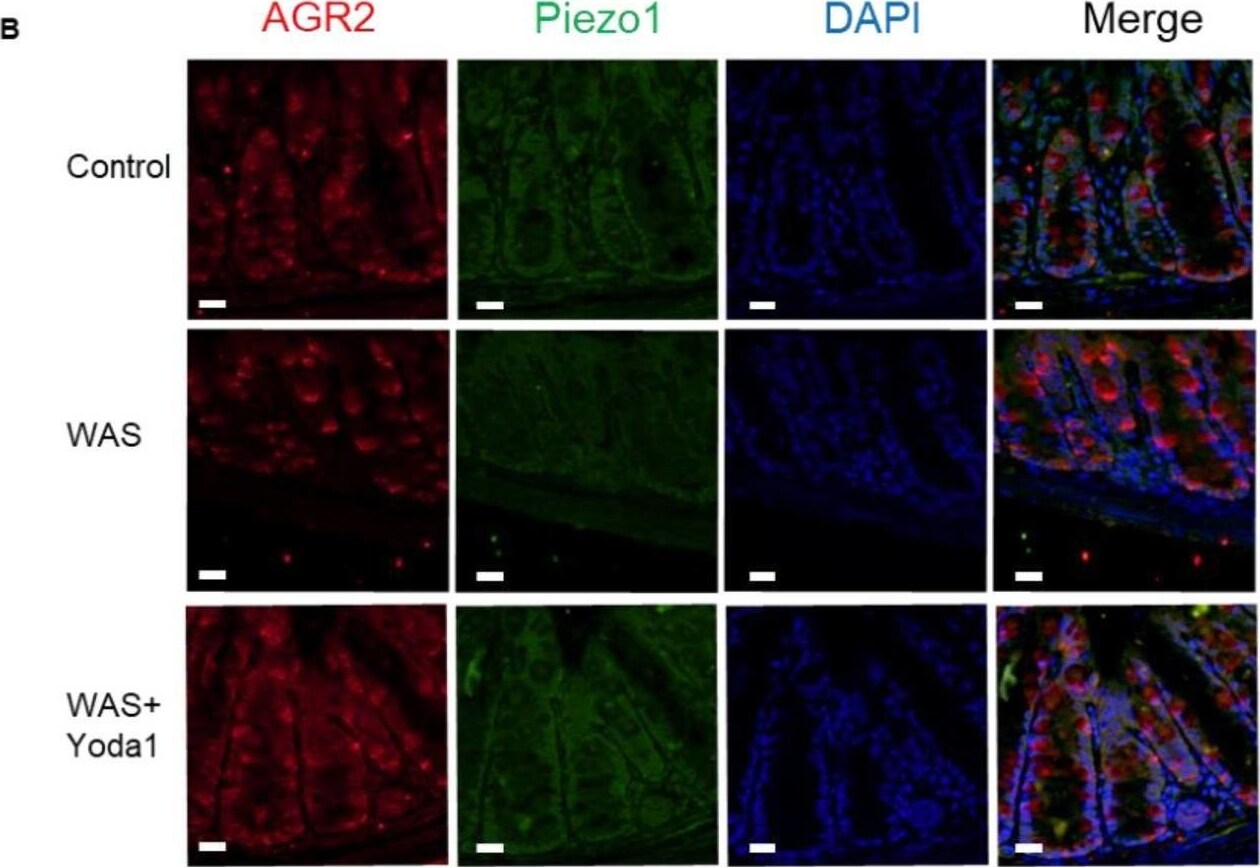
Detection of AG-2/AGR2 by Immunohistochemistry
Piezo1 agonist Yoda1 reduced the methylation of intestinal mucosa in WAS model mice. A Immunofluorescence for co-localization of AGR2 and H3K9me3 in intestinal mucosa of control, WAS and WAS + Yoda1 mice; bar length: 20 μm. B Immunofluorescence for co-localization of AGR2 and Piezo1 in intestinal mucosa of control, WAS and WAS + Yoda1 mice; bar length: 20 μm. C Western blot of Piezo1, Suv39h1, Hdac3, GAPDH, H3K9me3 and T-H3 in the control and WAS mice (n ≥ 6). D Statistical analysis of protein in panel C. E RT-PCR of Piezo1, EDEM1, GRP78, ATF4 mRNA in the mucosa of control, WAS and WAS + Yoda1 mice (n ≥ 6). F Schematic showed that Yoda1 reduced the H3K9me3 modification on the mucin2 promoter by reducing Hdac3 and SUV39h1 Image collected and cropped by CiteAb from the following open publication (https://pubmed.ncbi.nlm.nih.gov/36631841), licensed under a CC-BY license. Not internally tested by R&D Systems.Applications for Human AG-2/AGR2 Antibody
Immunohistochemistry
Sample: Immersion fixed paraffin-embedded sections of human breast cancer tissue
Western Blot
Sample: A549 human lung carcinoma cell line and human small intestine tissue
Formulation, Preparation, and Storage
Purification
Reconstitution
Reconstitute at 0.2 mg/mL in sterile PBS. For liquid material, refer to CoA for concentration.
Formulation
Shipping
Stability & Storage
- 12 months from date of receipt, -20 to -70 °C as supplied.
- 1 month, 2 to 8 °C under sterile conditions after reconstitution.
- 6 months, -20 to -70 °C under sterile conditions after reconstitution.
Calculators
Background: AG-2/AGR2
Long Name
Alternate Names
Gene Symbol
UniProt
Additional AG-2/AGR2 Products
Product Documents for Human AG-2/AGR2 Antibody
Certificate of Analysis
To download a Certificate of Analysis, please enter a lot or batch number in the search box below.
Note: Certificate of Analysis not available for kit components.
Product Specific Notices for Human AG-2/AGR2 Antibody
For research use only
Related Research Areas
Citations for Human AG-2/AGR2 Antibody
 Powered by Bioz
Customer Reviews for Human AG-2/AGR2 Antibody
There are currently no reviews for this product. Be the first to review Human AG-2/AGR2 Antibody and earn rewards!
Have you used Human AG-2/AGR2 Antibody?
Submit a review and receive an Amazon gift card!
$25/€18/£15/$25CAN/¥2500 for a review with an image
$10/€7/£6/$10CAN/¥1110 for a review without an image
Submit a review
Protocols
Find general support by application which include: protocols, troubleshooting, illustrated assays, videos and webinars.
- Antigen Retrieval Protocol (PIER)
- Antigen Retrieval for Frozen Sections Protocol
- Appropriate Fixation of IHC/ICC Samples
- Cellular Response to Hypoxia Protocols
- Chromogenic IHC Staining of Formalin-Fixed Paraffin-Embedded (FFPE) Tissue Protocol
- Chromogenic Immunohistochemistry Staining of Frozen Tissue
- ClariTSA™ Fluorophore Kits
- Detection & Visualization of Antibody Binding
- Fluorescent IHC Staining of Frozen Tissue Protocol
- Graphic Protocol for Heat-induced Epitope Retrieval
- Graphic Protocol for the Preparation and Fluorescent IHC Staining of Frozen Tissue Sections
- Graphic Protocol for the Preparation and Fluorescent IHC Staining of Paraffin-embedded Tissue Sections
- Graphic Protocol for the Preparation of Gelatin-coated Slides for Histological Tissue Sections
- IHC Sample Preparation (Frozen sections vs Paraffin)
- Immunofluorescent IHC Staining of Formalin-Fixed Paraffin-Embedded (FFPE) Tissue Protocol
- Immunohistochemistry (IHC) and Immunocytochemistry (ICC) Protocols
- Immunohistochemistry Frozen Troubleshooting
- Immunohistochemistry Paraffin Troubleshooting
- Preparing Samples for IHC/ICC Experiments
- Preventing Non-Specific Staining (Non-Specific Binding)
- Primary Antibody Selection & Optimization
- Protocol for Heat-Induced Epitope Retrieval (HIER)
- Protocol for Making a 4% Formaldehyde Solution in PBS
- Protocol for VisUCyte™ HRP Polymer Detection Reagent
- Protocol for the Preparation & Fixation of Cells on Coverslips
- Protocol for the Preparation and Chromogenic IHC Staining of Frozen Tissue Sections
- Protocol for the Preparation and Chromogenic IHC Staining of Frozen Tissue Sections - Graphic
- Protocol for the Preparation and Chromogenic IHC Staining of Paraffin-embedded Tissue Sections
- Protocol for the Preparation and Chromogenic IHC Staining of Paraffin-embedded Tissue Sections - Graphic
- Protocol for the Preparation and Fluorescent IHC Staining of Frozen Tissue Sections
- Protocol for the Preparation and Fluorescent IHC Staining of Paraffin-embedded Tissue Sections
- Protocol for the Preparation of Gelatin-coated Slides for Histological Tissue Sections
- R&D Systems Quality Control Western Blot Protocol
- TUNEL and Active Caspase-3 Detection by IHC/ICC Protocol
- The Importance of IHC/ICC Controls
- Troubleshooting Guide: Immunohistochemistry
- Troubleshooting Guide: Western Blot Figures
- Western Blot Conditions
- Western Blot Protocol
- Western Blot Protocol for Cell Lysates
- Western Blot Troubleshooting
- Western Blot Troubleshooting Guide
- View all Protocols, Troubleshooting, Illustrated assays and Webinars