Human Hemoglobin Antibody Summary
Scientific Data
 View Larger
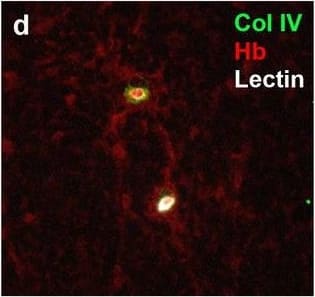
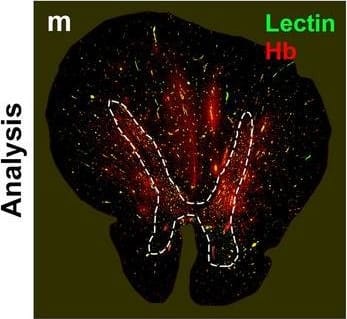
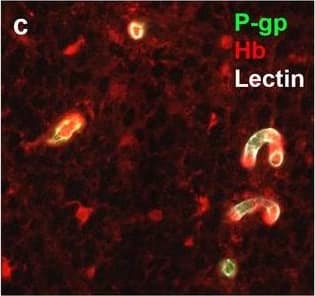
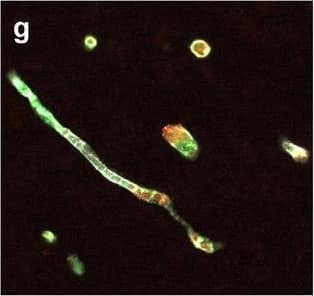
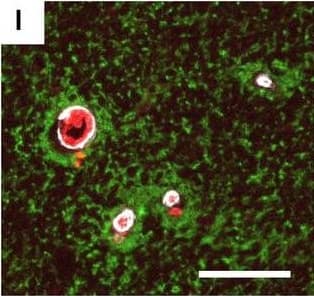
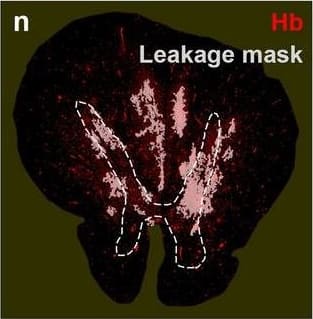
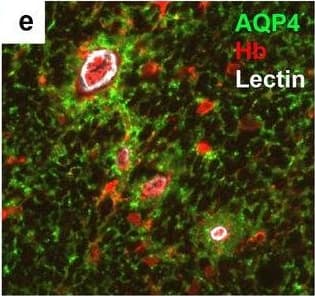
Detection of Human Hemoglobin by Immunohistochemistry Neurovascular unit component expression in leaked versus non-leaked vessels along the spinal cord axis. Immunohistochemical labelling of neurovascular unit markers in ALS spinal cord (a–l); tight junctions claudin-5 (a, g) and ZO-1 (b, h), efflux pump P-glycoprotein (c, i), basement membrane marker collagen IV (d, j), and astrocyte markers aquaporin 4 (e, k) and GFAP (f, l), in spinal cord vessels with or without hemoglobin leakage. Scale bar = 50 µm. Automated quantification of average intensity staining of neurovascular unit markers was carried out in all ALS cases (n = 13) or in a subset of ALS cases with high hemoglobin leakage (n = 5) in leaked and non-leaked areas of the white and gray matter of the spinal cord (m–r). Composite of original images showing anti-hemoglobin immunoreactivity (red) and lectin-positive vessels (green) (m) and overlays of hemoglobin leakage analysis output (white, partly transparent) over anti-hemoglobin (red) (n). Segmentation of vessels inside (magenta) or outside (white) areas of hemoglobin leakage in the white matter (o) or gray matter (p). Dashed lines show boundaries. Scale bar = 1 mm. Perivascular astrocyte endfeet staining (green) around lectin-positive vessels (white) in (q) was isolated using an automated mask of the glia limitans (r). Scale bar = 50 µm. The average intensities of marker staining were measured in leaked and non-leaked vessels of the gray and white matter (s–x). Data shown as mean ± SD (n = 5 or 13) with statistical significance determined with a two-way repeated-measures ANOVA with Sidak’s post-test. ns = not significant Image collected and cropped by CiteAb from the following open publication (https://pubmed.ncbi.nlm.nih.gov/34446086), licensed under a CC-BY license. Not internally tested by R&D Systems.
 View Larger
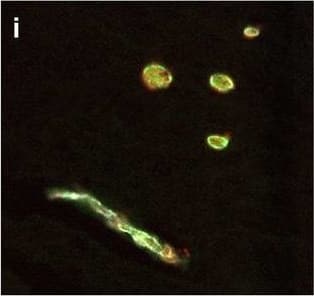
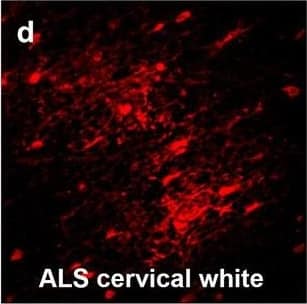
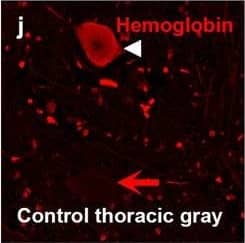
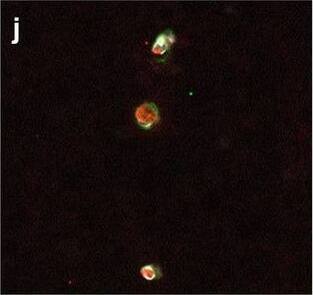
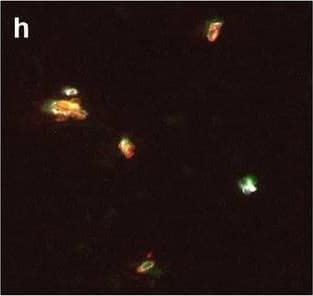
Detection of Human Hemoglobin by Immunohistochemistry Hemoglobin localization in control and ALS spinal cord. Immunohistochemical staining of hemoglobin extravasation in cervical white matter from control (a–c) or ALS (d–f) spinal cord. Hemoglobin immunoreactivity (red) and lectin-positive vessels (green) are shown with a Hoechst nuclear counterstain (blue). Scale bars = 50 µm. Representative images of full spinal cord sections from the cervical level of a control case with no hemoglobin leakage (g), the thoracic level of an ALS case with white matter hemoglobin leakage (h), and the lumbar level of an ALS case with gray matter hemoglobin leakage (i) are shown. Dashed lines show gray matter boundary; scale bar = 1 mm. Occasional hemoglobin staining of SMI-32-positive anterior horn motor neurons was also observed (j–m). White arrowhead indicates a SMI-32-positive hemoglobin-positive motor neuron, where the red arrow indicates an SMI-32-positive hemoglobin-negative motor neuron. Scale bars = 50 µm Image collected and cropped by CiteAb from the following open publication (https://pubmed.ncbi.nlm.nih.gov/34446086), licensed under a CC-BY license. Not internally tested by R&D Systems.
 View Larger
Detection of Human Hemoglobin by Immunohistochemistry Neurovascular unit component expression in leaked versus non-leaked vessels along the spinal cord axis. Immunohistochemical labelling of neurovascular unit markers in ALS spinal cord (a–l); tight junctions claudin-5 (a, g) and ZO-1 (b, h), efflux pump P-glycoprotein (c, i), basement membrane marker collagen IV (d, j), and astrocyte markers aquaporin 4 (e, k) and GFAP (f, l), in spinal cord vessels with or without hemoglobin leakage. Scale bar = 50 µm. Automated quantification of average intensity staining of neurovascular unit markers was carried out in all ALS cases (n = 13) or in a subset of ALS cases with high hemoglobin leakage (n = 5) in leaked and non-leaked areas of the white and gray matter of the spinal cord (m–r). Composite of original images showing anti-hemoglobin immunoreactivity (red) and lectin-positive vessels (green) (m) and overlays of hemoglobin leakage analysis output (white, partly transparent) over anti-hemoglobin (red) (n). Segmentation of vessels inside (magenta) or outside (white) areas of hemoglobin leakage in the white matter (o) or gray matter (p). Dashed lines show boundaries. Scale bar = 1 mm. Perivascular astrocyte endfeet staining (green) around lectin-positive vessels (white) in (q) was isolated using an automated mask of the glia limitans (r). Scale bar = 50 µm. The average intensities of marker staining were measured in leaked and non-leaked vessels of the gray and white matter (s–x). Data shown as mean ± SD (n = 5 or 13) with statistical significance determined with a two-way repeated-measures ANOVA with Sidak’s post-test. ns = not significant Image collected and cropped by CiteAb from the following open publication (https://pubmed.ncbi.nlm.nih.gov/34446086), licensed under a CC-BY license. Not internally tested by R&D Systems.
 View Larger
Detection of Human Hemoglobin by Immunohistochemistry Hemoglobin localization in control and ALS spinal cord. Immunohistochemical staining of hemoglobin extravasation in cervical white matter from control (a–c) or ALS (d–f) spinal cord. Hemoglobin immunoreactivity (red) and lectin-positive vessels (green) are shown with a Hoechst nuclear counterstain (blue). Scale bars = 50 µm. Representative images of full spinal cord sections from the cervical level of a control case with no hemoglobin leakage (g), the thoracic level of an ALS case with white matter hemoglobin leakage (h), and the lumbar level of an ALS case with gray matter hemoglobin leakage (i) are shown. Dashed lines show gray matter boundary; scale bar = 1 mm. Occasional hemoglobin staining of SMI-32-positive anterior horn motor neurons was also observed (j–m). White arrowhead indicates a SMI-32-positive hemoglobin-positive motor neuron, where the red arrow indicates an SMI-32-positive hemoglobin-negative motor neuron. Scale bars = 50 µm Image collected and cropped by CiteAb from the following open publication (https://pubmed.ncbi.nlm.nih.gov/34446086), licensed under a CC-BY license. Not internally tested by R&D Systems.
 View Larger
Detection of Human Hemoglobin by Immunohistochemistry Neurovascular unit component expression in leaked versus non-leaked vessels along the spinal cord axis. Immunohistochemical labelling of neurovascular unit markers in ALS spinal cord (a–l); tight junctions claudin-5 (a, g) and ZO-1 (b, h), efflux pump P-glycoprotein (c, i), basement membrane marker collagen IV (d, j), and astrocyte markers aquaporin 4 (e, k) and GFAP (f, l), in spinal cord vessels with or without hemoglobin leakage. Scale bar = 50 µm. Automated quantification of average intensity staining of neurovascular unit markers was carried out in all ALS cases (n = 13) or in a subset of ALS cases with high hemoglobin leakage (n = 5) in leaked and non-leaked areas of the white and gray matter of the spinal cord (m–r). Composite of original images showing anti-hemoglobin immunoreactivity (red) and lectin-positive vessels (green) (m) and overlays of hemoglobin leakage analysis output (white, partly transparent) over anti-hemoglobin (red) (n). Segmentation of vessels inside (magenta) or outside (white) areas of hemoglobin leakage in the white matter (o) or gray matter (p). Dashed lines show boundaries. Scale bar = 1 mm. Perivascular astrocyte endfeet staining (green) around lectin-positive vessels (white) in (q) was isolated using an automated mask of the glia limitans (r). Scale bar = 50 µm. The average intensities of marker staining were measured in leaked and non-leaked vessels of the gray and white matter (s–x). Data shown as mean ± SD (n = 5 or 13) with statistical significance determined with a two-way repeated-measures ANOVA with Sidak’s post-test. ns = not significant Image collected and cropped by CiteAb from the following open publication (https://pubmed.ncbi.nlm.nih.gov/34446086), licensed under a CC-BY license. Not internally tested by R&D Systems.
 View Larger
Detection of Human Hemoglobin by Immunohistochemistry Neurovascular unit component expression in leaked versus non-leaked vessels along the spinal cord axis. Immunohistochemical labelling of neurovascular unit markers in ALS spinal cord (a–l); tight junctions claudin-5 (a, g) and ZO-1 (b, h), efflux pump P-glycoprotein (c, i), basement membrane marker collagen IV (d, j), and astrocyte markers aquaporin 4 (e, k) and GFAP (f, l), in spinal cord vessels with or without hemoglobin leakage. Scale bar = 50 µm. Automated quantification of average intensity staining of neurovascular unit markers was carried out in all ALS cases (n = 13) or in a subset of ALS cases with high hemoglobin leakage (n = 5) in leaked and non-leaked areas of the white and gray matter of the spinal cord (m–r). Composite of original images showing anti-hemoglobin immunoreactivity (red) and lectin-positive vessels (green) (m) and overlays of hemoglobin leakage analysis output (white, partly transparent) over anti-hemoglobin (red) (n). Segmentation of vessels inside (magenta) or outside (white) areas of hemoglobin leakage in the white matter (o) or gray matter (p). Dashed lines show boundaries. Scale bar = 1 mm. Perivascular astrocyte endfeet staining (green) around lectin-positive vessels (white) in (q) was isolated using an automated mask of the glia limitans (r). Scale bar = 50 µm. The average intensities of marker staining were measured in leaked and non-leaked vessels of the gray and white matter (s–x). Data shown as mean ± SD (n = 5 or 13) with statistical significance determined with a two-way repeated-measures ANOVA with Sidak’s post-test. ns = not significant Image collected and cropped by CiteAb from the following open publication (https://pubmed.ncbi.nlm.nih.gov/34446086), licensed under a CC-BY license. Not internally tested by R&D Systems.
 View Larger
Detection of Human Hemoglobin by Immunohistochemistry Neurovascular unit component expression in leaked versus non-leaked vessels along the spinal cord axis. Immunohistochemical labelling of neurovascular unit markers in ALS spinal cord (a–l); tight junctions claudin-5 (a, g) and ZO-1 (b, h), efflux pump P-glycoprotein (c, i), basement membrane marker collagen IV (d, j), and astrocyte markers aquaporin 4 (e, k) and GFAP (f, l), in spinal cord vessels with or without hemoglobin leakage. Scale bar = 50 µm. Automated quantification of average intensity staining of neurovascular unit markers was carried out in all ALS cases (n = 13) or in a subset of ALS cases with high hemoglobin leakage (n = 5) in leaked and non-leaked areas of the white and gray matter of the spinal cord (m–r). Composite of original images showing anti-hemoglobin immunoreactivity (red) and lectin-positive vessels (green) (m) and overlays of hemoglobin leakage analysis output (white, partly transparent) over anti-hemoglobin (red) (n). Segmentation of vessels inside (magenta) or outside (white) areas of hemoglobin leakage in the white matter (o) or gray matter (p). Dashed lines show boundaries. Scale bar = 1 mm. Perivascular astrocyte endfeet staining (green) around lectin-positive vessels (white) in (q) was isolated using an automated mask of the glia limitans (r). Scale bar = 50 µm. The average intensities of marker staining were measured in leaked and non-leaked vessels of the gray and white matter (s–x). Data shown as mean ± SD (n = 5 or 13) with statistical significance determined with a two-way repeated-measures ANOVA with Sidak’s post-test. ns = not significant Image collected and cropped by CiteAb from the following open publication (https://pubmed.ncbi.nlm.nih.gov/34446086), licensed under a CC-BY license. Not internally tested by R&D Systems.
 View Larger
Detection of Human Hemoglobin by Immunohistochemistry Neurovascular unit component expression in leaked versus non-leaked vessels along the spinal cord axis. Immunohistochemical labelling of neurovascular unit markers in ALS spinal cord (a–l); tight junctions claudin-5 (a, g) and ZO-1 (b, h), efflux pump P-glycoprotein (c, i), basement membrane marker collagen IV (d, j), and astrocyte markers aquaporin 4 (e, k) and GFAP (f, l), in spinal cord vessels with or without hemoglobin leakage. Scale bar = 50 µm. Automated quantification of average intensity staining of neurovascular unit markers was carried out in all ALS cases (n = 13) or in a subset of ALS cases with high hemoglobin leakage (n = 5) in leaked and non-leaked areas of the white and gray matter of the spinal cord (m–r). Composite of original images showing anti-hemoglobin immunoreactivity (red) and lectin-positive vessels (green) (m) and overlays of hemoglobin leakage analysis output (white, partly transparent) over anti-hemoglobin (red) (n). Segmentation of vessels inside (magenta) or outside (white) areas of hemoglobin leakage in the white matter (o) or gray matter (p). Dashed lines show boundaries. Scale bar = 1 mm. Perivascular astrocyte endfeet staining (green) around lectin-positive vessels (white) in (q) was isolated using an automated mask of the glia limitans (r). Scale bar = 50 µm. The average intensities of marker staining were measured in leaked and non-leaked vessels of the gray and white matter (s–x). Data shown as mean ± SD (n = 5 or 13) with statistical significance determined with a two-way repeated-measures ANOVA with Sidak’s post-test. ns = not significant Image collected and cropped by CiteAb from the following open publication (https://pubmed.ncbi.nlm.nih.gov/34446086), licensed under a CC-BY license. Not internally tested by R&D Systems.
 View Larger
Detection of Human Hemoglobin by Immunohistochemistry Neurovascular unit component expression in leaked versus non-leaked vessels along the spinal cord axis. Immunohistochemical labelling of neurovascular unit markers in ALS spinal cord (a–l); tight junctions claudin-5 (a, g) and ZO-1 (b, h), efflux pump P-glycoprotein (c, i), basement membrane marker collagen IV (d, j), and astrocyte markers aquaporin 4 (e, k) and GFAP (f, l), in spinal cord vessels with or without hemoglobin leakage. Scale bar = 50 µm. Automated quantification of average intensity staining of neurovascular unit markers was carried out in all ALS cases (n = 13) or in a subset of ALS cases with high hemoglobin leakage (n = 5) in leaked and non-leaked areas of the white and gray matter of the spinal cord (m–r). Composite of original images showing anti-hemoglobin immunoreactivity (red) and lectin-positive vessels (green) (m) and overlays of hemoglobin leakage analysis output (white, partly transparent) over anti-hemoglobin (red) (n). Segmentation of vessels inside (magenta) or outside (white) areas of hemoglobin leakage in the white matter (o) or gray matter (p). Dashed lines show boundaries. Scale bar = 1 mm. Perivascular astrocyte endfeet staining (green) around lectin-positive vessels (white) in (q) was isolated using an automated mask of the glia limitans (r). Scale bar = 50 µm. The average intensities of marker staining were measured in leaked and non-leaked vessels of the gray and white matter (s–x). Data shown as mean ± SD (n = 5 or 13) with statistical significance determined with a two-way repeated-measures ANOVA with Sidak’s post-test. ns = not significant Image collected and cropped by CiteAb from the following open publication (https://pubmed.ncbi.nlm.nih.gov/34446086), licensed under a CC-BY license. Not internally tested by R&D Systems.
 View Larger
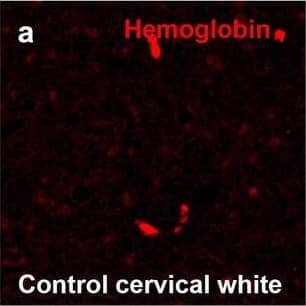
Detection of Human Hemoglobin by Immunohistochemistry Hemoglobin localization in control and ALS spinal cord. Immunohistochemical staining of hemoglobin extravasation in cervical white matter from control (a–c) or ALS (d–f) spinal cord. Hemoglobin immunoreactivity (red) and lectin-positive vessels (green) are shown with a Hoechst nuclear counterstain (blue). Scale bars = 50 µm. Representative images of full spinal cord sections from the cervical level of a control case with no hemoglobin leakage (g), the thoracic level of an ALS case with white matter hemoglobin leakage (h), and the lumbar level of an ALS case with gray matter hemoglobin leakage (i) are shown. Dashed lines show gray matter boundary; scale bar = 1 mm. Occasional hemoglobin staining of SMI-32-positive anterior horn motor neurons was also observed (j–m). White arrowhead indicates a SMI-32-positive hemoglobin-positive motor neuron, where the red arrow indicates an SMI-32-positive hemoglobin-negative motor neuron. Scale bars = 50 µm Image collected and cropped by CiteAb from the following open publication (https://pubmed.ncbi.nlm.nih.gov/34446086), licensed under a CC-BY license. Not internally tested by R&D Systems.
 View Larger
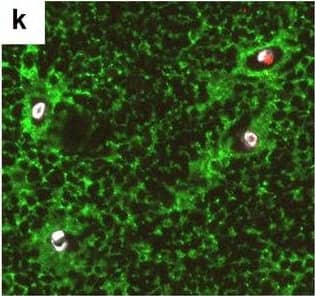
Detection of Human Hemoglobin by Immunohistochemistry Neurovascular unit component expression in leaked versus non-leaked vessels along the spinal cord axis. Immunohistochemical labelling of neurovascular unit markers in ALS spinal cord (a–l); tight junctions claudin-5 (a, g) and ZO-1 (b, h), efflux pump P-glycoprotein (c, i), basement membrane marker collagen IV (d, j), and astrocyte markers aquaporin 4 (e, k) and GFAP (f, l), in spinal cord vessels with or without hemoglobin leakage. Scale bar = 50 µm. Automated quantification of average intensity staining of neurovascular unit markers was carried out in all ALS cases (n = 13) or in a subset of ALS cases with high hemoglobin leakage (n = 5) in leaked and non-leaked areas of the white and gray matter of the spinal cord (m–r). Composite of original images showing anti-hemoglobin immunoreactivity (red) and lectin-positive vessels (green) (m) and overlays of hemoglobin leakage analysis output (white, partly transparent) over anti-hemoglobin (red) (n). Segmentation of vessels inside (magenta) or outside (white) areas of hemoglobin leakage in the white matter (o) or gray matter (p). Dashed lines show boundaries. Scale bar = 1 mm. Perivascular astrocyte endfeet staining (green) around lectin-positive vessels (white) in (q) was isolated using an automated mask of the glia limitans (r). Scale bar = 50 µm. The average intensities of marker staining were measured in leaked and non-leaked vessels of the gray and white matter (s–x). Data shown as mean ± SD (n = 5 or 13) with statistical significance determined with a two-way repeated-measures ANOVA with Sidak’s post-test. ns = not significant Image collected and cropped by CiteAb from the following open publication (https://pubmed.ncbi.nlm.nih.gov/34446086), licensed under a CC-BY license. Not internally tested by R&D Systems.
 View Larger
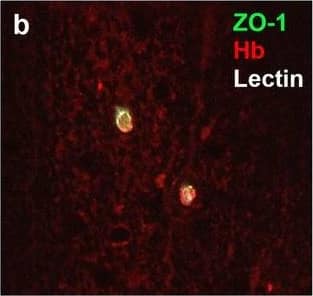
Detection of Human Hemoglobin by Immunohistochemistry Neurovascular unit component expression in leaked versus non-leaked vessels along the spinal cord axis. Immunohistochemical labelling of neurovascular unit markers in ALS spinal cord (a–l); tight junctions claudin-5 (a, g) and ZO-1 (b, h), efflux pump P-glycoprotein (c, i), basement membrane marker collagen IV (d, j), and astrocyte markers aquaporin 4 (e, k) and GFAP (f, l), in spinal cord vessels with or without hemoglobin leakage. Scale bar = 50 µm. Automated quantification of average intensity staining of neurovascular unit markers was carried out in all ALS cases (n = 13) or in a subset of ALS cases with high hemoglobin leakage (n = 5) in leaked and non-leaked areas of the white and gray matter of the spinal cord (m–r). Composite of original images showing anti-hemoglobin immunoreactivity (red) and lectin-positive vessels (green) (m) and overlays of hemoglobin leakage analysis output (white, partly transparent) over anti-hemoglobin (red) (n). Segmentation of vessels inside (magenta) or outside (white) areas of hemoglobin leakage in the white matter (o) or gray matter (p). Dashed lines show boundaries. Scale bar = 1 mm. Perivascular astrocyte endfeet staining (green) around lectin-positive vessels (white) in (q) was isolated using an automated mask of the glia limitans (r). Scale bar = 50 µm. The average intensities of marker staining were measured in leaked and non-leaked vessels of the gray and white matter (s–x). Data shown as mean ± SD (n = 5 or 13) with statistical significance determined with a two-way repeated-measures ANOVA with Sidak’s post-test. ns = not significant Image collected and cropped by CiteAb from the following open publication (https://pubmed.ncbi.nlm.nih.gov/34446086), licensed under a CC-BY license. Not internally tested by R&D Systems.
 View Larger
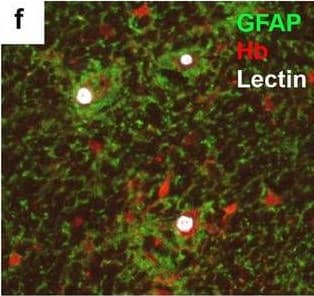
Detection of Human Hemoglobin by Immunohistochemistry Neurovascular unit component expression in leaked versus non-leaked vessels along the spinal cord axis. Immunohistochemical labelling of neurovascular unit markers in ALS spinal cord (a–l); tight junctions claudin-5 (a, g) and ZO-1 (b, h), efflux pump P-glycoprotein (c, i), basement membrane marker collagen IV (d, j), and astrocyte markers aquaporin 4 (e, k) and GFAP (f, l), in spinal cord vessels with or without hemoglobin leakage. Scale bar = 50 µm. Automated quantification of average intensity staining of neurovascular unit markers was carried out in all ALS cases (n = 13) or in a subset of ALS cases with high hemoglobin leakage (n = 5) in leaked and non-leaked areas of the white and gray matter of the spinal cord (m–r). Composite of original images showing anti-hemoglobin immunoreactivity (red) and lectin-positive vessels (green) (m) and overlays of hemoglobin leakage analysis output (white, partly transparent) over anti-hemoglobin (red) (n). Segmentation of vessels inside (magenta) or outside (white) areas of hemoglobin leakage in the white matter (o) or gray matter (p). Dashed lines show boundaries. Scale bar = 1 mm. Perivascular astrocyte endfeet staining (green) around lectin-positive vessels (white) in (q) was isolated using an automated mask of the glia limitans (r). Scale bar = 50 µm. The average intensities of marker staining were measured in leaked and non-leaked vessels of the gray and white matter (s–x). Data shown as mean ± SD (n = 5 or 13) with statistical significance determined with a two-way repeated-measures ANOVA with Sidak’s post-test. ns = not significant Image collected and cropped by CiteAb from the following open publication (https://pubmed.ncbi.nlm.nih.gov/34446086), licensed under a CC-BY license. Not internally tested by R&D Systems.
 View Larger
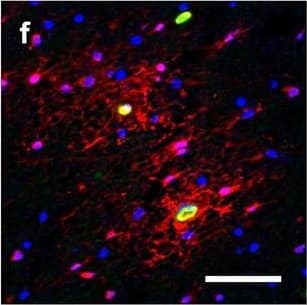
Detection of Human Hemoglobin by Immunohistochemistry Hemoglobin localization in control and ALS spinal cord. Immunohistochemical staining of hemoglobin extravasation in cervical white matter from control (a–c) or ALS (d–f) spinal cord. Hemoglobin immunoreactivity (red) and lectin-positive vessels (green) are shown with a Hoechst nuclear counterstain (blue). Scale bars = 50 µm. Representative images of full spinal cord sections from the cervical level of a control case with no hemoglobin leakage (g), the thoracic level of an ALS case with white matter hemoglobin leakage (h), and the lumbar level of an ALS case with gray matter hemoglobin leakage (i) are shown. Dashed lines show gray matter boundary; scale bar = 1 mm. Occasional hemoglobin staining of SMI-32-positive anterior horn motor neurons was also observed (j–m). White arrowhead indicates a SMI-32-positive hemoglobin-positive motor neuron, where the red arrow indicates an SMI-32-positive hemoglobin-negative motor neuron. Scale bars = 50 µm Image collected and cropped by CiteAb from the following open publication (https://pubmed.ncbi.nlm.nih.gov/34446086), licensed under a CC-BY license. Not internally tested by R&D Systems.
Reconstitution Calculator
Preparation and Storage
- 12 months from date of receipt, -20 to -70 °C as supplied.
- 1 month, 2 to 8 °C under sterile conditions after reconstitution.
- 6 months, -20 to -70 °C under sterile conditions after reconstitution.
Background: Hemoglobin
Hemoglobin is a tetrameric heme-containing protein that is responsible for the transport of oxygen by red blood cells in the circulation. For most of fetal development and adulthood, hemoglobin consists of two alpha chains and two beta chains. Hemoglobin zeta (HBZ) is an approximately 15 kDa alpha chain-like protein that is produced during the first few weeks of embryogenesis until the onset of alpha chain expression. Its expression is prolonged in a0-thalassemia which is characterized by deficient alpha chain production. The Gower-1, Portland-1, and Portland-2 forms of hemoglobin consist of two zeta chains in association with either two epsilon, gamma, or beta chains, respectively. Human Hemoglobin zeta shares 79% amino acid sequence identity with mouse and rat Hemoglobin zeta.
Product Datasheets
Citations for Human Hemoglobin Antibody
R&D Systems personnel manually curate a database that contains references using R&D Systems products. The data collected includes not only links to publications in PubMed, but also provides information about sample types, species, and experimental conditions.
2
Citations: Showing 1 - 2
Filter your results:
Filter by:
-
Blood-spinal cord barrier leakage is independent of motor neuron pathology in ALS
Authors: S Waters, MEV Swanson, BV Dieriks, YB Zhang, NL Grimsey, HC Murray, C Turner, HJ Waldvogel, RLM Faull, J An, R Bowser, MA Curtis, M Dragunow, E Scotter
Acta neuropathologica communications, 2021-08-26;9(1):144.
Species: Human
Sample Types: Whole Tissue
Applications: IHC -
Reductions in brain pericytes are associated with arteriovenous malformation vascular instability
Authors: EA Winkler, H Birk, JK Burkhardt, X Chen, JK Yue, D Guo, WC Rutledge, GF Lasker, C Partow, T Tihan, EF Chang, H Su, H Kim, BP Walcott, MT Lawton
J. Neurosurg., 2018-12-01;0(0):1-11.
Species: Human
Sample Types: Whole Tissue
Applications: IHC-P
FAQs
No product specific FAQs exist for this product, however you may
View all Antibody FAQsReviews for Human Hemoglobin Antibody
There are currently no reviews for this product. Be the first to review Human Hemoglobin Antibody and earn rewards!
Have you used Human Hemoglobin Antibody?
Submit a review and receive an Amazon gift card.
$25/€18/£15/$25CAN/¥75 Yuan/¥2500 Yen for a review with an image
$10/€7/£6/$10 CAD/¥70 Yuan/¥1110 Yen for a review without an image
