
Scientific images may be resized, cropped, or adjusted for brightness or contrast for presentation purposes. These updates are limited to presentation and do not affect the underlying scientific interpretation of the data. Where available, additional source data may be provided upon request.
Key Product Details
Species Reactivity
Validated:
Cited:
Applications
Validated:
Cited:
Label
Antibody Source
Product Specifications
Immunogen
Met1-His118
Accession # Q6IA17
Specificity
Clonality
Host
Isotype
Scientific Data Images for Human SIGIRR Antibody
Detection of SIGIRR by Western Blot
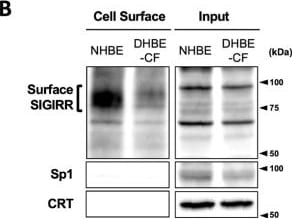
The expression of the cell surface of the SIGIRR is downregulated in CF cells. (A,B) Cell surface expression of the SIGIRR in (A) C38 and IB3-1, (B) NHBE and DHBE-CF (non-CF vs. CF) airway epithelial cells were assessed by biotinylation assay, followed by immunoblotting using anti-SIGIRR, calreticulin (CRT) and Sp1 antibodies. Protein bands in (A) were scanned, and relative band intensities were normalized to the beta -actin band. The graphs represent the average relative band intensity with S.D. from four independent experiments. * p < 0.05; Student’s t-test (n = 3). (C) Flow cytometry for the SIGIRR was performed using C38 and IB3-1 cells. Surface expressions of the SIGIRR were indicated by a fluorescence shift compared to the isotype control antibody (dotted line). Image collected and cropped by CiteAb from the following open publication (https://pubmed.ncbi.nlm.nih.gov/35887095), licensed under a CC-BY license. Not internally tested by R&D Systems.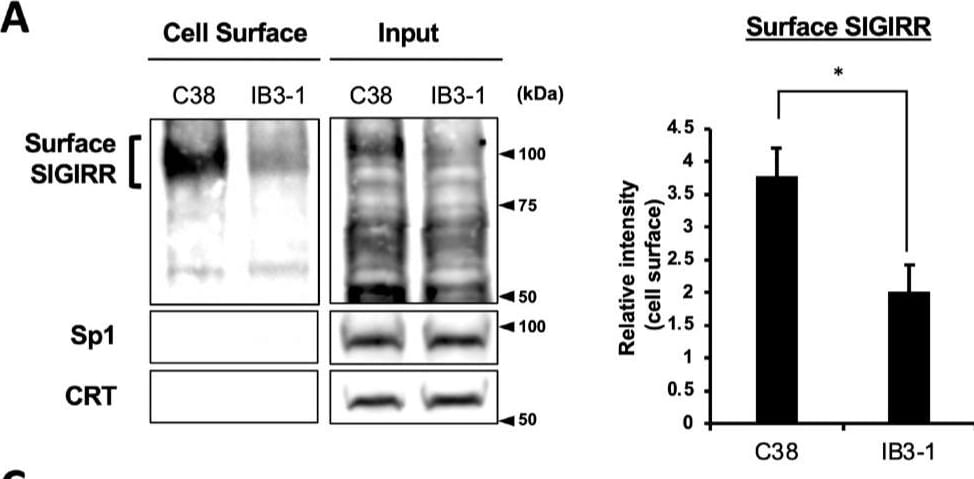
Detection of SIGIRR by Western Blot
The expression of the cell surface of the SIGIRR is downregulated in CF cells. (A,B) Cell surface expression of the SIGIRR in (A) C38 and IB3-1, (B) NHBE and DHBE-CF (non-CF vs. CF) airway epithelial cells were assessed by biotinylation assay, followed by immunoblotting using anti-SIGIRR, calreticulin (CRT) and Sp1 antibodies. Protein bands in (A) were scanned, and relative band intensities were normalized to the beta -actin band. The graphs represent the average relative band intensity with S.D. from four independent experiments. * p < 0.05; Student’s t-test (n = 3). (C) Flow cytometry for the SIGIRR was performed using C38 and IB3-1 cells. Surface expressions of the SIGIRR were indicated by a fluorescence shift compared to the isotype control antibody (dotted line). Image collected and cropped by CiteAb from the following open publication (https://pubmed.ncbi.nlm.nih.gov/35887095), licensed under a CC-BY license. Not internally tested by R&D Systems.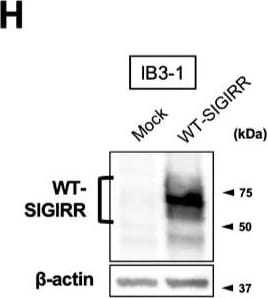
Detection of SIGIRR by Western Blot
Suppression of IL-8 production by IL-37b is dependent on the cell surface-expressed WT-SIGIRR, leading to the attenuation of JNK phosphorylation. (A,B) C38 and IB3-1 cells were stimulated with 1 μg/mL flagellin or 20 μg/mL poly(I:C) 2 h after treatment with the indicated concentrations of a precursor or Val46 IL-37b. After 24 h, released IL-8 in the condition media was measured by ELISA. (C) NHBE and DHBE-CF cells were stimulated with 0.5 μg/mL poly(I:C) 2 h after treatment with 10 ng/mL of a precursor or Val46 IL-37b. After 24 h, released IL-8 in the condition media was measured by ELISA. (D) C38 and IB3-1 cells and (E) NHBE and DHBE-CF cells were stimulated with poly(I:C) (D, 20 μg/mL; E, 1 μg/mL) 2 h after treatment with a 10 ng/mL precursor of IL-37b. After the indicated period of the poly(I:C) treatment, the total cell lysates were subjected to immunoblotting using antibodies against the phospho-active form of MAPKs, IRF3, and I kappa B alpha. (F,G) pcDNA or delta 8-SIGIRR-transfected C38 cells and (H and I) pcDNA or the WT-SIGIRR-transfected IB3-1 cells were stimulated with 20 μg/mL poly(I:C) 2 h after treatment with the indicated concentrations of the precursor of IL-37b. After 24 h, released IL-8 in the condition media was measured by ELISA. Exogenously expressed delta 8 and the WT-SIGIRR were assessed by immunoblotting with the anti-SIGIRR. For the immunoblotting experiments (D–F,H), beta -actin was used as a loading control. (A–C,G,I) Results represent the mean ± S.D. * p < 0.05, ** p < 0.01, *** p < 0.001 versus poly(I:C)-treated cells; ANOVA with Dunnett’s test (n = 3). Image collected and cropped by CiteAb from the following open publication (https://pubmed.ncbi.nlm.nih.gov/35887095), licensed under a CC-BY license. Not internally tested by R&D Systems.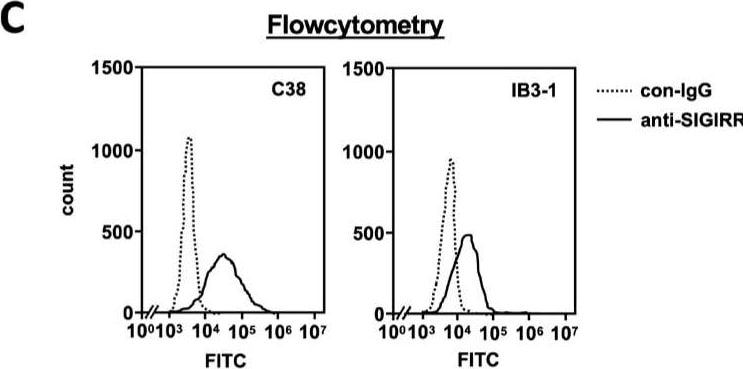
Detection of SIGIRR by Flow Cytometry
The expression of the cell surface of the SIGIRR is downregulated in CF cells. (A,B) Cell surface expression of the SIGIRR in (A) C38 and IB3-1, (B) NHBE and DHBE-CF (non-CF vs. CF) airway epithelial cells were assessed by biotinylation assay, followed by immunoblotting using anti-SIGIRR, calreticulin (CRT) and Sp1 antibodies. Protein bands in (A) were scanned, and relative band intensities were normalized to the beta -actin band. The graphs represent the average relative band intensity with S.D. from four independent experiments. * p < 0.05; Student’s t-test (n = 3). (C) Flow cytometry for the SIGIRR was performed using C38 and IB3-1 cells. Surface expressions of the SIGIRR were indicated by a fluorescence shift compared to the isotype control antibody (dotted line). Image collected and cropped by CiteAb from the following open publication (https://pubmed.ncbi.nlm.nih.gov/35887095), licensed under a CC-BY license. Not internally tested by R&D Systems.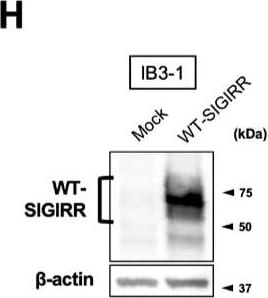
Detection of SIGIRR by Western Blot
Suppression of IL-8 production by IL-37b is dependent on the cell surface-expressed WT-SIGIRR, leading to the attenuation of JNK phosphorylation. (A,B) C38 and IB3-1 cells were stimulated with 1 μg/mL flagellin or 20 μg/mL poly(I:C) 2 h after treatment with the indicated concentrations of a precursor or Val46 IL-37b. After 24 h, released IL-8 in the condition media was measured by ELISA. (C) NHBE and DHBE-CF cells were stimulated with 0.5 μg/mL poly(I:C) 2 h after treatment with 10 ng/mL of a precursor or Val46 IL-37b. After 24 h, released IL-8 in the condition media was measured by ELISA. (D) C38 and IB3-1 cells and (E) NHBE and DHBE-CF cells were stimulated with poly(I:C) (D, 20 μg/mL; E, 1 μg/mL) 2 h after treatment with a 10 ng/mL precursor of IL-37b. After the indicated period of the poly(I:C) treatment, the total cell lysates were subjected to immunoblotting using antibodies against the phospho-active form of MAPKs, IRF3, and I kappa B alpha. (F,G) pcDNA or delta 8-SIGIRR-transfected C38 cells and (H and I) pcDNA or the WT-SIGIRR-transfected IB3-1 cells were stimulated with 20 μg/mL poly(I:C) 2 h after treatment with the indicated concentrations of the precursor of IL-37b. After 24 h, released IL-8 in the condition media was measured by ELISA. Exogenously expressed delta 8 and the WT-SIGIRR were assessed by immunoblotting with the anti-SIGIRR. For the immunoblotting experiments (D–F,H), beta -actin was used as a loading control. (A–C,G,I) Results represent the mean ± S.D. * p < 0.05, ** p < 0.01, *** p < 0.001 versus poly(I:C)-treated cells; ANOVA with Dunnett’s test (n = 3). Image collected and cropped by CiteAb from the following open publication (https://pubmed.ncbi.nlm.nih.gov/35887095), licensed under a CC-BY license. Not internally tested by R&D Systems.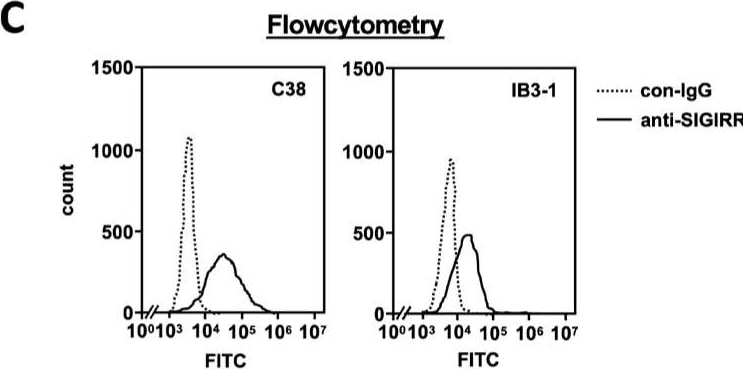
Detection of SIGIRR by Flow Cytometry
The expression of the cell surface of the SIGIRR is downregulated in CF cells. (A,B) Cell surface expression of the SIGIRR in (A) C38 and IB3-1, (B) NHBE and DHBE-CF (non-CF vs. CF) airway epithelial cells were assessed by biotinylation assay, followed by immunoblotting using anti-SIGIRR, calreticulin (CRT) and Sp1 antibodies. Protein bands in (A) were scanned, and relative band intensities were normalized to the beta -actin band. The graphs represent the average relative band intensity with S.D. from four independent experiments. * p < 0.05; Student’s t-test (n = 3). (C) Flow cytometry for the SIGIRR was performed using C38 and IB3-1 cells. Surface expressions of the SIGIRR were indicated by a fluorescence shift compared to the isotype control antibody (dotted line). Image collected and cropped by CiteAb from the following open publication (https://pubmed.ncbi.nlm.nih.gov/35887095), licensed under a CC-BY license. Not internally tested by R&D Systems.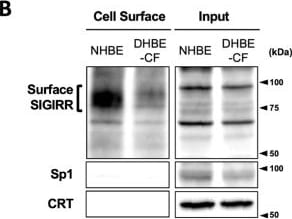
Detection of SIGIRR by Western Blot
The expression of the cell surface of the SIGIRR is downregulated in CF cells. (A,B) Cell surface expression of the SIGIRR in (A) C38 and IB3-1, (B) NHBE and DHBE-CF (non-CF vs. CF) airway epithelial cells were assessed by biotinylation assay, followed by immunoblotting using anti-SIGIRR, calreticulin (CRT) and Sp1 antibodies. Protein bands in (A) were scanned, and relative band intensities were normalized to the beta -actin band. The graphs represent the average relative band intensity with S.D. from four independent experiments. * p < 0.05; Student’s t-test (n = 3). (C) Flow cytometry for the SIGIRR was performed using C38 and IB3-1 cells. Surface expressions of the SIGIRR were indicated by a fluorescence shift compared to the isotype control antibody (dotted line). Image collected and cropped by CiteAb from the following open publication (https://pubmed.ncbi.nlm.nih.gov/35887095), licensed under a CC-BY license. Not internally tested by R&D Systems.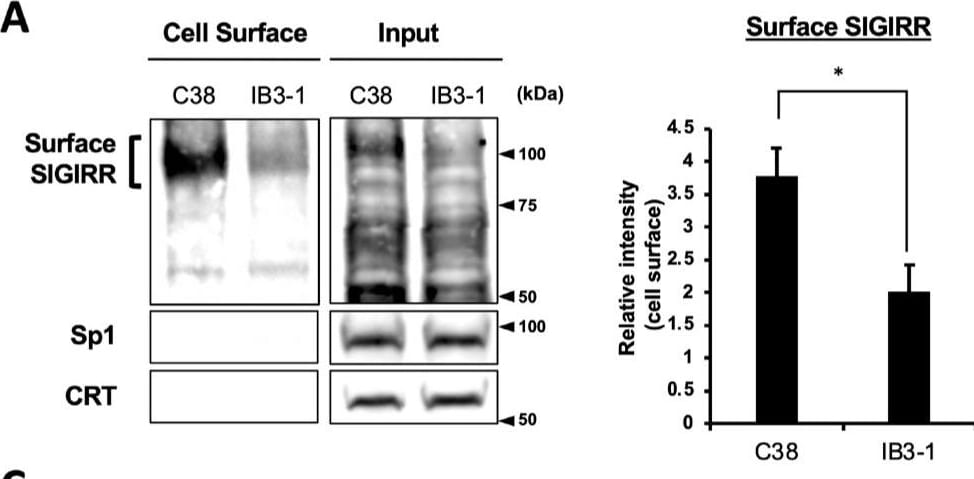
Detection of SIGIRR by Western Blot
The expression of the cell surface of the SIGIRR is downregulated in CF cells. (A,B) Cell surface expression of the SIGIRR in (A) C38 and IB3-1, (B) NHBE and DHBE-CF (non-CF vs. CF) airway epithelial cells were assessed by biotinylation assay, followed by immunoblotting using anti-SIGIRR, calreticulin (CRT) and Sp1 antibodies. Protein bands in (A) were scanned, and relative band intensities were normalized to the beta -actin band. The graphs represent the average relative band intensity with S.D. from four independent experiments. * p < 0.05; Student’s t-test (n = 3). (C) Flow cytometry for the SIGIRR was performed using C38 and IB3-1 cells. Surface expressions of the SIGIRR were indicated by a fluorescence shift compared to the isotype control antibody (dotted line). Image collected and cropped by CiteAb from the following open publication (https://pubmed.ncbi.nlm.nih.gov/35887095), licensed under a CC-BY license. Not internally tested by R&D Systems.Applications for Human SIGIRR Antibody
Western Blot
Sample: Recombinant Human SIGIRR Fc Chimera (Catalog # 990-SG)
Formulation, Preparation, and Storage
Purification
Reconstitution
Reconstitute at 0.2 mg/mL in sterile PBS. For liquid material, refer to CoA for concentration.
Formulation
Shipping
Stability & Storage
- 12 months from date of receipt, -20 to -70 °C as supplied.
- 1 month, 2 to 8 °C under sterile conditions after reconstitution.
- 6 months, -20 to -70 °C under sterile conditions after reconstitution.
Calculators
Background: SIGIRR
References
- Thomassen, E. et al. (1999) Cytokine 11:389.
Long Name
Alternate Names
Gene Symbol
UniProt
Additional SIGIRR Products
Product Documents for Human SIGIRR Antibody
Certificate of Analysis
To download a Certificate of Analysis, please enter a lot or batch number in the search box below.
Note: Certificate of Analysis not available for kit components.
Product Specific Notices for Human SIGIRR Antibody
For research use only
Related Research Areas
Citations for Human SIGIRR Antibody
 Powered by Bioz
Customer Reviews for Human SIGIRR Antibody
There are currently no reviews for this product. Be the first to review Human SIGIRR Antibody and earn rewards!
Have you used Human SIGIRR Antibody?
Submit a review and receive an Amazon gift card!
$25/€18/£15/$25CAN/¥2500 for a review with an image
$10/€7/£6/$10CAN/¥1110 for a review without an image
Submit a review
Protocols
Find general support by application which include: protocols, troubleshooting, illustrated assays, videos and webinars.
- Cellular Response to Hypoxia Protocols
- R&D Systems Quality Control Western Blot Protocol
- Troubleshooting Guide: Western Blot Figures
- Western Blot Conditions
- Western Blot Protocol
- Western Blot Protocol for Cell Lysates
- Western Blot Troubleshooting
- Western Blot Troubleshooting Guide
- View all Protocols, Troubleshooting, Illustrated assays and Webinars
Associated Pathways