TRF-2 Antibody - BSA Free
Novus Biologicals | Catalog # NB110-57130
![Immunocytochemistry/ Immunofluorescence: TRF-2 Antibody - BSA Free [NB110-57130]](https://resources.rndsystems.com/images/products/TRF-2-Antibody-Immunocytochemistry-Immunofluorescence-NB110-57130-img0011.jpg "Immunocytochemistry/ Immunofluorescence: TRF-2 Antibody - BSA Free [NB110-57130]")
Key Product Details
Validated by
Knockout/Knockdown
Species Reactivity
Validated:
Human, Mouse, Rat, Chinese Hamster, Primate
Cited:
Human, Mouse, Rat
Applications
Validated:
Immunohistochemistry, Immunohistochemistry-Paraffin, Western Blot, ELISA, Flow Cytometry, Flow (Intracellular), Immunocytochemistry/ Immunofluorescence, Simple Western, Immunoprecipitation, Chromatin Immunoprecipitation (ChIP), Dot Blot, Knockdown Validated
Cited:
Western Blot, ELISA, Immunocytochemistry/ Immunofluorescence, Immunoprecipitation, Chromatin Immunoprecipitation (ChIP), Chemotaxis, Cytometric Bead Assay Standard, FISH, Proximity Ligation Assay, IF/IHC, Knockdown
Label
Unconjugated
Antibody Source
Polyclonal Rabbit IgG
Format
BSA Free
Loading...
Product Specifications
Immunogen
This TRF-2 Antibody was developed against Baculovirus purified TRF2 protein.
Localization
Nuclear
Marker
Telomeres marker
Clonality
Polyclonal
Host
Rabbit
Isotype
IgG
Theoretical MW
59.6 kDa.
Disclaimer note: The observed molecular weight of the protein may vary from the listed predicted molecular weight due to post translational modifications, post translation cleavages, relative charges, and other experimental factors.
Disclaimer note: The observed molecular weight of the protein may vary from the listed predicted molecular weight due to post translational modifications, post translation cleavages, relative charges, and other experimental factors.
Scientific Data Images for TRF-2 Antibody - BSA Free
Immunocytochemistry/ Immunofluorescence: TRF-2 Antibody - BSA Free [NB110-57130]
Immunocytochemistry/Immunofluorescence: TRF-2 Antibody [NB110-57130] - HeLa cells were fixed for 10 minutes using 10% formalin and then permeabilized for 5 minutes using 1X TBS + 0.5% Triton X-100. The cells were incubated with antibody at a 1:200 dilution overnight at 4 degrees Celsius and detected with DyLight 488 (Green) at a 1:500 dilution. Alpha tubulin was used as a co-stain at a 1:1000 dilution and detected with Dylight 550 (Red). Nuclei were detected with DAPI (Blue) at 2.0 ug/ml in 1X PBS. Cells were imaged using a 40X objective.![Simple Western: TRF-2 AntibodyBSA Free [NB110-57130]](https://resources.rndsystems.com/images/products/TRF-2-Antibody-Simple-Western-NB110-57130-img0010.jpg "Simple Western: TRF-2 AntibodyBSA Free [NB110-57130]")
Simple Western: TRF-2 AntibodyBSA Free [NB110-57130]
Simple Western: TRF-2 Antibody [NB110-57130] - Lane view shows a specific band for TRF2 in 1.0 mg/mL of HeLa lysate. This experiment was performed under reducing conditions using the 12-230 kDa separation system.![Western Blot: TRF-2 AntibodyBSA Free [NB110-57130]](https://resources.rndsystems.com/images/products/TRF-2-Antibody-Western-Blot-NB110-57130-img0008.jpg "Western Blot: TRF-2 AntibodyBSA Free [NB110-57130]")
Western Blot: TRF-2 AntibodyBSA Free [NB110-57130]
Western Blot: TRF-2 Antibody [NB110-57130] - Analysis of HeLa whole cell lysate (A), HeLa nuclear cell lysate (B), k562 cell lysate (C), HepG2 cell lysate (D), NIH/3T3 cell lysate (E), CHO cell lysate (F), PC12 cell lysate (G), and Cos7 cell lysate (H) using antibody at a concentration of 2 ug/mL.![Immunohistochemistry-Paraffin: TRF-2 Antibody - BSA Free [NB110-57130]](https://resources.rndsystems.com/images/products/TRF-2-Antibody-Immunohistochemistry-Paraffin-NB110-57130-img0007.jpg "Immunohistochemistry-Paraffin: TRF-2 Antibody - BSA Free [NB110-57130]")
Immunohistochemistry-Paraffin: TRF-2 Antibody - BSA Free [NB110-57130]
Immunohistochemistry-Paraffin: TRF-2 Antibody [NB110-57130] - Analysis in xenografted human breast cancer tissue using DAB with hematoxylin counterstain.![Immunohistochemistry-Paraffin: TRF-2 Antibody - BSA Free [NB110-57130]](https://resources.rndsystems.com/images/products/TRF-2-Antibody-Immunohistochemistry-Paraffin-NB110-57130-img0013.jpg "Immunohistochemistry-Paraffin: TRF-2 Antibody - BSA Free [NB110-57130]")
Immunohistochemistry-Paraffin: TRF-2 Antibody - BSA Free [NB110-57130]
Immunohistochemistry-Paraffin: TRF-2 Antibody [NB110-57130] - Analysis of FFPE human breast cancer tissue with rabbit polyclonal TRF2 antibody at a dilution of 1:200. The staining was developed with HRP-DAB detection method and the counterstaining was performed using hematoxylin. This TRF2 antibody generated an expected nuclear signal in all the cancer cells and the stromal cells. In the tested section, only a subset of myoepithelial cells showed positivity for this protein.![Immunocytochemistry/ Immunofluorescence: TRF-2 Antibody - BSA Free [NB110-57130]](https://resources.rndsystems.com/images/products/TRF-2-Antibody-Immunocytochemistry-Immunofluorescence-NB110-57130-img0016.jpg "Immunocytochemistry/ Immunofluorescence: TRF-2 Antibody - BSA Free [NB110-57130]")
Immunocytochemistry/ Immunofluorescence: TRF-2 Antibody - BSA Free [NB110-57130]
Immunocytochemistry/Immunofluorescence: TRF-2 Antibody [NB110-57130] - NIH3T3 cells were fixed in 4% paraformaldehyde for 10 minutes and permeabilized in 0.5% Triton X-100 in PBS for 5 minutes. The cells were incubated with anti-TRF-2 Antibody NB110-57130 at 2 ug/ml overnight at 4C and detected with an anti-rabbit Dylight 488 (Green) at a 1:1000 dilution for 60 minutes. Nuclei were counterstained with DAPI (Blue). Cells were imaged using a 100X objective and digitally deconvolved.![Flow Cytometry: TRF-2 Antibody - BSA Free [NB110-57130]](https://resources.rndsystems.com/images/products/TRF-2-Antibody-Flow-Cytometry-NB110-57130-img0017.jpg "Flow Cytometry: TRF-2 Antibody - BSA Free [NB110-57130]")
Flow Cytometry: TRF-2 Antibody - BSA Free [NB110-57130]
Flow Cytometry: TRF-2 Antibody [NB110-57130] - An intracellular stain was performed on HeLa cells with TRF-2 Antibody NB110-57130 (blue) and a matched isotype control NBP2-24891 (orange). Cells were fixed with 4% PFA and then permeabilized with 0.1% saponin. Cells were incubated in an antibody dilution of 1.0 ug/mL for 30 minutes at room temperature, followed by Rabbit IgG (H+L) Cross-Adsorbed Secondary Antibody, Dylight 550 (SA5-10033, Thermo Fisher).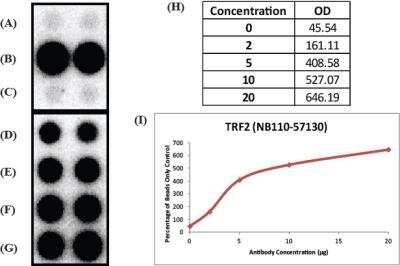
Chromatin Immunoprecipitation: TRF-2 Antibody [NB110-57130] - Analysis in mouse. Titrated TRF2 antibody to determine concentration required for ChIP experiment. ChIP image submitted by a verified customer review.
![Immunocytochemistry/ Immunofluorescence: TRF-2 Antibody - BSA Free [NB110-57130]](https://resources.rndsystems.com/images/products/TRF-2-Antibody-Immunocytochemistry-Immunofluorescence-NB110-57130-img0015.jpg "Immunocytochemistry/ Immunofluorescence: TRF-2 Antibody - BSA Free [NB110-57130]")
![Immunohistochemistry-Paraffin: TRF-2 Antibody - BSA Free [NB110-57130]](https://resources.rndsystems.com/images/products/TRF-2-Antibody-Immunohistochemistry-Paraffin-NB110-57130-img0012.jpg "Immunohistochemistry-Paraffin: TRF-2 Antibody - BSA Free [NB110-57130]")
Immunohistochemistry-Paraffin: TRF-2 Antibody - BSA Free [NB110-57130]
Immunohistochemistry-Paraffin: TRF-2 Antibody [NB110-57130] - Analysis of FFPE human breast cancer tissue with rabbit polyclonal TRF2 antibody at 1:200 dilution. The staining was developed with HRP-DAB detection method and the counterstaining was performed using hematoxylin. This TRF2 antibody generated an expected nuclear signal in all the cancer cells and the stromal cells. In the tested section, only a subset of myoepithelial cells showed positivity for this protein.![Flow Cytometry: TRF-2 Antibody - BSA Free [NB110-57130]](https://resources.rndsystems.com/images/products/TRF-2-Antibody-Flow-Cytometry-NB110-57130-img0014.jpg "Flow Cytometry: TRF-2 Antibody - BSA Free [NB110-57130]")
Flow Cytometry: TRF-2 Antibody - BSA Free [NB110-57130]
Flow Cytometry: TRF-2 Antibody [NB110-57130] - An intracellular stain was performed on HeLa cells with TRF-2 Antibody NB110-57130AF488 (blue) and a matched isotype control (orange). Cells were fixed with 4% PFA and then permeabilized with 0.1% saponin. Cells were incubated in an antibody dilution of 5 ug/mL for 30 minutes at room temperature. Both antibodies were conjugated to Alexa Fluor 488.
Western Blot: TRF-2 Antibody - BSA Free [NB110-57130] -
The DNA damage response at telomeres uncapped through TRF2 depletion does not require BRCA1 or CtIPImmortalized Brca1F/− MEFs were infected with retroviruses expressing the indicated shRNAs and/or Cre recombinase, followed by selection with puromycin for 72 h. Cell extracts were prepared 48 h later & analysed by Western blotting as indicated. SMC1 & tubulin were used as loading controls. *non-specific band.Cells treated as in (A) were fixed 48 h after selection & stained with an anti-53BP1 antibody (green). Telomeres were visualized with a Cy3-conjugated (CCCTAA)3-PNA probe (red). Yellow arrowheads point to 53BP1 foci that co-localize with telomeres.Quantification of TIFs in cells treated as in (B). A minimum of 200 nuclei were scored for each sample. Error bars represent SD of two independent experiments. P-values were calculated using an unpaired two-tailed t-test. *P ≤ 0.05; NS, P > 0.05. Image collected & cropped by CiteAb from the following publication (https://pubmed.ncbi.nlm.nih.gov/25582120), licensed under a CC-BY license. Not internally tested by Novus Biologicals.
Western Blot: TRF-2 Antibody - BSA Free [NB110-57130] -
Western Blot: TRF-2 Antibody - BSA Free [NB110-57130] - Repressive chromatin induced on p21 promoter in TRF2 dependent way. (A–C) Loss of chromatin activation marks H3K4Me, H3K4Me2 in stable TRF2 expressed HT1080 cells (A); increase in LSD1 occupancy in TRF2 over-expressing HT1080 cells. (B) (Full images are shown in Supplementary Figures S6 & S7); Co-immunoprecipitation of TRF2 with LSD1 (immunoprecipitation with anti-TRF2 antibody followed by immunoblotting with anti-LSD1 or anti-TRF2 antibody) (C); (D) Reverse Co-immunoprecipitation of LSD1 with TRF2 (immunoprecipitation with anti-LSD1 antibody followed by immunoblotting with anti-TRF2 antibody); (E) & reduced occupancy of the repressor complex REST, Co-REST & LSD1 on silencing TRF2 on p21 promoter. Image collected & cropped by CiteAb from the following publication (https://www.nature.com/articles/s41598-017-11177-1), licensed under a CC-BY license. Not internally tested by Novus Biologicals.
Chromatin Immunoprecipitation: TRF-2 Antibody - BSA Free [NB110-57130] -
Chromatin Immunoprecipitation: TRF-2 Antibody - BSA Free [NB110-57130] - TRF2 occupancy on G4-motif sites on gene promoters within cells.A, telomeric enrichment was tested for TRF2 ChIP samples performed in HT1080 cells. Telomeric signal was normalized to signal from ALU probe. B, TRF2 occupancy at gene promoter sites in HT1080 cells (endogenous TRF2 & TRF2-overexpressed) quantified using ChIP-qRT PCR. TRF2 ChIP/IgG (mock) enrichment was normalized to 1% input; CTCF promoter (which does not harbor a TRF2 peak) was used as negative control; error bars correspond to S.D., & statistical significance was calculated by paired t test (*, p < 0.05; **, p < 0.01). For the TRF2-overexpressed condition (in red), all p values were <0.01. Image collected & cropped by CiteAb from the following publication (https://pubmed.ncbi.nlm.nih.gov/31575660), licensed under a CC-BY license. Not internally tested by Novus Biologicals.
Western Blot: TRF-2 Antibody - BSA Free [NB110-57130] -
Western Blot: TRF-2 Antibody - BSA Free [NB110-57130] - Repressive chromatin induced on p21 promoter in TRF2 dependent way. (A–C) Loss of chromatin activation marks H3K4Me, H3K4Me2 in stable TRF2 expressed HT1080 cells (A); increase in LSD1 occupancy in TRF2 over-expressing HT1080 cells. (B) (Full images are shown in Supplementary Figures S6 & S7); Co-immunoprecipitation of TRF2 with LSD1 (immunoprecipitation with anti-TRF2 antibody followed by immunoblotting with anti-LSD1 or anti-TRF2 antibody) (C); (D) Reverse Co-immunoprecipitation of LSD1 with TRF2 (immunoprecipitation with anti-LSD1 antibody followed by immunoblotting with anti-TRF2 antibody); (E) & reduced occupancy of the repressor complex REST, Co-REST & LSD1 on silencing TRF2 on p21 promoter. Image collected & cropped by CiteAb from the following publication (https://www.nature.com/articles/s41598-017-11177-1), licensed under a CC-BY license. Not internally tested by Novus Biologicals.
Chromatin Immunoprecipitation: TRF-2 Antibody - BSA Free [NB110-57130] -
Chromatin Immunoprecipitation: TRF-2 Antibody - BSA Free [NB110-57130] - Thousands of extra-telomeric TRF2 binding sites found across the genome.A, extra-telomeric TRF2 peaks found in HT1080 cells following TRF2 ChIP-Seq: 20304 TRF2 peaks were common between two independent experiments. B, distribution of common TRF2 peaks around TSSs. Distance from the TSS is shown in kb. C, replicate consistency plot generated using irreproducible discovery rate analysis; 1956 peaks found at ≤0.01 are marked. D, distribution of 1956 TRF2 peaks with IDR 0.01 (TRF2HC peaks) around the TSS. Distance from the TSS is shown in kb. Image collected & cropped by CiteAb from the following publication (https://pubmed.ncbi.nlm.nih.gov/31575660), licensed under a CC-BY license. Not internally tested by Novus Biologicals.
Western Blot: TRF-2 Antibody - BSA Free [NB110-57130] -
Western Blot: TRF-2 Antibody - BSA Free [NB110-57130] - TRF1HP1 alpha allele-specific protection effects upon si-TRF2-induced telomeric damage. 72 h after transfection, a TRF2 knockdown efficiency with antibody against TRF2 (anti-TRF2) & GAPDH (anti-GAPDH) as loading control. (−) si-non-targeting; (+) si-TRF2. Quantification of TIFs in b si-non-targeting (n = 32–47 nuclei per group) or c si-TRF2. Left *p = 0.0188, right *p = 0.0192, **p = 0.0042, ****p < 0.0001 (n = 31–48 nuclei per group). b, c Significance is assessed by one-way ANOVA & Dunnett’s multiple comparison test with 95% confidence level. Error bars represent s.e.m. Note the similar pattern among TRF1HP1 alpha alleles in c compared to the corresponding allele pattern in Fig. 4b Image collected & cropped by CiteAb from the following publication (https://pubmed.ncbi.nlm.nih.gov/30181605), licensed under a CC-BY license. Not internally tested by Novus Biologicals.
Chromatin Immunoprecipitation: TRF-2 Antibody - BSA Free [NB110-57130] -
Chromatin Immunoprecipitation: TRF-2 Antibody - BSA Free [NB110-57130] - TRF2 peaks harbor G-quadruplex motifs genome-wide.A, schematic representation of a G4 motif; sequence pattern with loop/stem & PG4 motif formed by a tetrad of guanine trimers interspersed with loops that can vary in length. B & C, PG4 motifs & TRF2 peaks significantly overlap. High-confidence TRF2-binding sites (TRF2HC peaks) determined by ChIP-Seq in HT1080 cells were significantly enriched in PG4-motif sequences (B), & conversely, PG4-motif sequences were enriched within TRF2HC peaks (C). Nonoverlapping PG4 motifs were considered for analysis; for control analysis, 100 regions of identical length for each TRF2 peak were taken. *, p < 0.05; **, p < 0.01 (Fisher's exact test). Error bars, S.D. Image collected & cropped by CiteAb from the following publication (https://pubmed.ncbi.nlm.nih.gov/31575660), licensed under a CC-BY license. Not internally tested by Novus Biologicals.
Western Blot: TRF-2 Antibody - BSA Free [NB110-57130] -
Western Blot: TRF-2 Antibody - BSA Free [NB110-57130] - Repressive chromatin induced on p21 promoter in TRF2 dependent way. (A–C) Loss of chromatin activation marks H3K4Me, H3K4Me2 in stable TRF2 expressed HT1080 cells (A); increase in LSD1 occupancy in TRF2 over-expressing HT1080 cells. (B) (Full images are shown in Supplementary Figures S6 & S7); Co-immunoprecipitation of TRF2 with LSD1 (immunoprecipitation with anti-TRF2 antibody followed by immunoblotting with anti-LSD1 or anti-TRF2 antibody) (C); (D) Reverse Co-immunoprecipitation of LSD1 with TRF2 (immunoprecipitation with anti-LSD1 antibody followed by immunoblotting with anti-TRF2 antibody); (E) & reduced occupancy of the repressor complex REST, Co-REST & LSD1 on silencing TRF2 on p21 promoter. Image collected & cropped by CiteAb from the following publication (https://www.nature.com/articles/s41598-017-11177-1), licensed under a CC-BY license. Not internally tested by Novus Biologicals.
Western Blot: TRF-2 Antibody - BSA Free [NB110-57130] -
Western Blot: TRF-2 Antibody - BSA Free [NB110-57130] - TRF2 transcriptionally regulates p21 expression through promoter occupancy. (A) Quantitative ChIP using TRF2 antibody gives enriched binding of TRF2 on p21 promoter in HT1080 & MDA-MB-231 cells, IgG was used as isotypic antibody control; normalized with 10% input (data represented as mean ± SEM, for three replicates). (B,C) TRF2 represses p21 promoter activity. In luciferase assay, si-RNA-mediated silencing or TRF2 over expression resulted in increased (B, *p value < 0.05, Student’s t-test; data represented as mean ± SEM of three replicates) or reduction (C, *p value < 0.05, Student’s t-test; data represented as mean ± SEM of three replicates) in p21 promoter activity in HT1080 & MDA-MB-231 cells, respectively; over expression of TRF2 devoid of DNA binding [deletion of basic (delB), myb (delM) & both basic/myb (delB-delM) domains] resulted in partial or complete rescue of p21 promoter activity in HT1080 & MDA-MB-231 cells (data represented as mean ± SEM, for three replicates) (C). (D,E) HT1080 cells over expressing TRF2 show reduced p21 protein expression, bar graph shows the densitometry analysis of three different immunoblot replicates (*p value < 0.05, Student’s t-test; data represented as mean ± SEM of three replicates). (E) (Full images are shown in Supplementary Figure S5); TRF2 silencing results in increase in p21 protein, bar graph shows the densitometry analysis of three different immunoblots (*p value < 0.05, Student’s t-test; data represented as mean ± SEM of three replicates) (F); & mRNA expression in HT1080 cells (*p value < 0.05, Student’s t-test; data represented as mean ± SEM of three replicates, GAPDH used as internal control for real-time PCR). Image collected & cropped by CiteAb from the following publication (https://www.nature.com/articles/s41598-017-11177-1), licensed under a CC-BY license. Not internally tested by Novus Biologicals.
Chromatin Immunoprecipitation: TRF-2 Antibody - BSA Free [NB110-57130] -
Chromatin Immunoprecipitation: TRF-2 Antibody - BSA Free [NB110-57130] - TRF2 occupancy at gene promoters is sensitive to intracellular G-quadruplex–binding ligand 360A.A, TRF2 occupancy at gene promoter sites was checked by ChIP qRT-PCR in HT1080 cells following overexpression of TRF2 in the presence or absence of 360A. Error bars, S.D. from three independent experiments; CTCF promoter was used as a negative control. B, TRF2 level was checked by Western blotting in the presence of the ligand 360A in both untransfected & TRF2 transient overexpression conditions. Overexpression was also confirmed by probing for DDK tag. GAPDH was used as loading control. C, expression of target genes was analyzed by qRT-PCR in HT1080 cells following overexpression of TRF2 in the presence or absence of 360A. GAPDH expression was used for normalization; error bars, S.D. from three independent experiments. Statistical significance was calculated by paired t test (*, p < 0.05; **, p < 0.01). Image collected & cropped by CiteAb from the following publication (https://pubmed.ncbi.nlm.nih.gov/31575660), licensed under a CC-BY license. Not internally tested by Novus Biologicals.
Western Blot: TRF-2 Antibody - BSA Free [NB110-57130] -
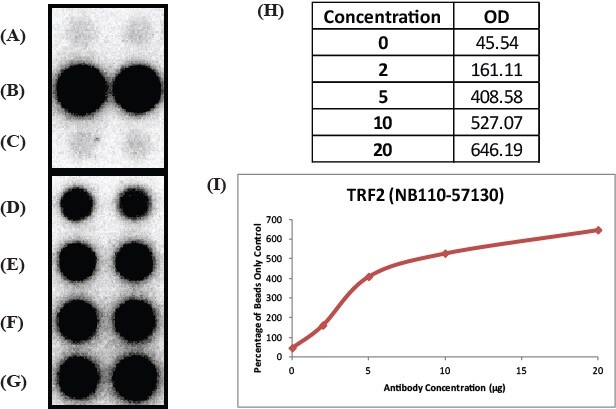
Western Blot: TRF-2 Antibody - BSA Free [NB110-57130] - A. Co-IP analysis of the interaction between DSP & TRF2 in HEK293 cells & MCF-7 cells. B. Co-IP analysis of the interaction between DSP & TRF2 in DSP-EGFP transfected HEK293 cells or DSP△NLS-EGFP transfected HEK293 cells. C. DSP pull down by telomere targeting CASID with the condition of TRF2 knockdown in HEK293 cells. Histone H3 is the loading control. D.TRF1 & TRF2 pull-down assay by telomere targeting CASID with the condition of DSP knockdown in HEK293 cells. E. Left, Dot blot of telomere DNA repeats in chromatin pull down by DSP with the condition of TRF1 or TRF2 knockdown. The dot-blot was performed at least three times & the represented one is shown. Right, the histogram shows the quantitated results of the dot blots. The triple asterisks (***) indicates a p-value less than 0.01. ns. indicates the insignificance difference. Image collected & cropped by CiteAb from the following publication (https://pubmed.ncbi.nlm.nih.gov/31595153), licensed under a CC-BY license. Not internally tested by Novus Biologicals.
Immunocytochemistry/ Immunofluorescence: TRF-2 Antibody - BSA Free [NB110-57130] -
Immunocytochemistry/ Immunofluorescence: TRF-2 Antibody - BSA Free [NB110-57130] - TERRA & telomere transcription in ALT cells.(a) TERRA northern blot hybridizations of RNA from the indicated cell lines (VA13: WI-38 VA13; 1.2.11: HeLa 1.2.11) pre-treated with RNaseA or left untreated. Ethidium bromide stained 18S ribosomal RNA (rRNA) is shown to control for loading. Long TERRA molecules comprised between the wells of the gels (w) & 28S rRNA are indicated. (b) TERRA CpG-island promoter methylation analysis of the indicated cell lines. Genomic DNA was digested with the methylation sensitive restriction enzyme MspI or its methylation insensitive isoschizomer HpaII. DNA was hybridized using a radioactively labelled probe detecting TERRA promoter CpG-island repeats. Nomet: fragments corresponding to unmethylated restriction products. (c) Dot blot hybridization of DNA immunoprecipitated with antibodies against phosphorylated Serines S2 & S5 of RNA polymerase II C-terminal domain. Hybridizations were performed with a telomeric probe. Quantifications are shown at the bottom. (d) Bars & error bars are averages & s.d. from three independent experiments. (e) Examples of TERRA FISH in the indicated cells. TERRA is shown in red, DAPI-stained DNA in blue. Scale bar, 9 μm. (f) IF/FISH experiments in the indicated cell lines. TERRA is in red, TRF2 in green & PML in blue. In the merge panels, arrowheads point to nuclear foci where the three factors co-localize. Scale bar, 9 μm. (g) Information surface at 0.01 μm detail level of three TERRA-containing APBs. TERRA is in red, TRF2 in green & PML in cyan. Images were generated with Three-Dimensional Structured Illumination Microscopy (3D-SIM). Scale bars, 0.4 μm. Image collected & cropped by CiteAb from the following publication (https://pubmed.ncbi.nlm.nih.gov/25330849), licensed under a CC-BY license. Not internally tested by Novus Biologicals.
Western Blot: TRF-2 Antibody - BSA Free [NB110-57130] -
Western Blot: TRF-2 Antibody - BSA Free [NB110-57130] - TRF2 occupancy at gene promoters is sensitive to intracellular G-quadruplex–binding ligand 360A.A, TRF2 occupancy at gene promoter sites was checked by ChIP qRT-PCR in HT1080 cells following overexpression of TRF2 in the presence or absence of 360A. Error bars, S.D. from three independent experiments; CTCF promoter was used as a negative control. B, TRF2 level was checked by Western blotting in the presence of the ligand 360A in both untransfected & TRF2 transient overexpression conditions. Overexpression was also confirmed by probing for DDK tag. GAPDH was used as loading control. C, expression of target genes was analyzed by qRT-PCR in HT1080 cells following overexpression of TRF2 in the presence or absence of 360A. GAPDH expression was used for normalization; error bars, S.D. from three independent experiments. Statistical significance was calculated by paired t test (*, p < 0.05; **, p < 0.01). Image collected & cropped by CiteAb from the following publication (https://pubmed.ncbi.nlm.nih.gov/31575660), licensed under a CC-BY license. Not internally tested by Novus Biologicals.
Western Blot: TRF-2 Antibody - BSA Free [NB110-57130] -
Western Blot: TRF-2 Antibody - BSA Free [NB110-57130] - A. Gene ontology analysis of proteins identified by CASID targeting telomeres. B. Western blot detection of TRF1, POT1, & DSP in the proteins pulled down by CASID with the presence of telo-sgRNA in HEK293 cells. Input represents the initial nuclear extract before the pull-down mediated by CASID. C. left, ChIP assay of telomere binding of TRF2 or DSP in MCF-7 cells & HEK293 cells. The chromatin DNA precipitated by anti-DSP & anti-TRF2 antibodies were analyzed by dot blot using the probes recognizing telomere (Telo-p) or Alu DNA repeats (Alu-p). The detection of Alu DNA repeats serves as negative control. The dot-blot was performed at least three times & the represented one is shown. Right, the histogram shows the quantitated results of the dot blots. The triple asterisks (***) indicates a p-value less than 0.01. D. Fluorescence imaging of DSP-EGFP in MCF-7 cells & U2OS cells. The EGFP signal indicates the localization of DSP-EGFP (green) & the Telo-FISH signal indicates the localization of telomeres (red). The overlapping between DSP-EGFP & Telo-FISH is in yellow as revealed in the enlarged nuclear area. The dCAS9-EGFP construct without telo-sgRNA was used for U2OS transfection & the imaging of EGFP serves as negative control. E. DSP localization in interphase & pro-metaphase nucleus. DSP-EGFP indicates the DSP locations & DAPI indicates the nucleus. Image collected & cropped by CiteAb from the following publication (https://pubmed.ncbi.nlm.nih.gov/31595153), licensed under a CC-BY license. Not internally tested by Novus Biologicals.
Western Blot: TRF-2 Antibody - BSA Free [NB110-57130] -
Western Blot: TRF-2 Antibody - BSA Free [NB110-57130] - TRF2 interacts with lamin A/C.(a) Pull down of endogenous TRF2 in IMR90s. The top panel shows a blot probed for endogenous lamin A/C, & the bottom panel shows a blot with the same samples probed for TRF2. (b) Pull down of endogenously expressed lamin A/C in IMR90s. The top panel shows a blot probed for endogenous TRF2, & the bottom panel shows a blot with the same samples probed for endogenous lamin A/C. (c) Pull down of endogenous lamin A/C in IMR90s exogenously expressing GFP, GFP-TRF2, GFP-TRF delta B delta M or GFP-TRF1. The top panel shows a blot probed for GFP, & the bottom panel shows the same blot probed for lamin A/C. (d) Pull down of endogenous TRF2 in IMR90s exogenously expressing GFP, GFP-LMNA or progerin (GFP-LMNA delta 50). The top panel shows a blot probed for GFP, & the bottom panel shows the same blot probed for TRF2. Asterisks denote IgG bands. Image collected & cropped by CiteAb from the following publication (https://pubmed.ncbi.nlm.nih.gov/25399868), licensed under a CC-BY license. Not internally tested by Novus Biologicals.
Western Blot: TRF-2 Antibody - BSA Free [NB110-57130] -
Western Blot: TRF-2 Antibody - BSA Free [NB110-57130] - Widespread dysregulation of shelterin protein expression in bortezomib-treated HEL & BGC-823 cellsA. & B. mRNA levels of shelterin factors TRF1, TRF2, TPP1, POT1, RAP1 & TIN2 in bortezomib-treated cells. Cells were treated with bortezomib for 24 hours & qPCR was used for quantitative assays. The levels of each target mRNA in bortezomib-treated cells were expressed as percentages of those in untreated cells. (A) HEL cells & (B) BGC-823 cells. C. & D. Immunoblotting assessment of TRF1, TRF2 & POT1 protein expression in bortezomib-treated cells. Same sets of cells above were analyzed for TRF1, TRF2 & POT1 protein levels & shown was representative of three independent experiments. (C) HEL cells & (D) BGC-823 cells. * & **: P < 0.05 & 0.01, respectively. BTZ, bortezomib. Image collected & cropped by CiteAb from the following publication (https://www.oncotarget.com/lookup/doi/10.18632/oncotarget.5752), licensed under a CC-BY license. Not internally tested by Novus Biologicals.
Western Blot: TRF-2 Antibody - BSA Free [NB110-57130] -
Western Blot: TRF-2 Antibody - BSA Free [NB110-57130] - A. Co-IP analysis of the interaction between DSP & TRF2 in HEK293 cells & MCF-7 cells. B. Co-IP analysis of the interaction between DSP & TRF2 in DSP-EGFP transfected HEK293 cells or DSP△NLS-EGFP transfected HEK293 cells. C. DSP pull down by telomere targeting CASID with the condition of TRF2 knockdown in HEK293 cells. Histone H3 is the loading control. D.TRF1 & TRF2 pull-down assay by telomere targeting CASID with the condition of DSP knockdown in HEK293 cells. E. Left, Dot blot of telomere DNA repeats in chromatin pull down by DSP with the condition of TRF1 or TRF2 knockdown. The dot-blot was performed at least three times & the represented one is shown. Right, the histogram shows the quantitated results of the dot blots. The triple asterisks (***) indicates a p-value less than 0.01. ns. indicates the insignificance difference. Image collected & cropped by CiteAb from the following publication (https://pubmed.ncbi.nlm.nih.gov/31595153), licensed under a CC-BY license. Not internally tested by Novus Biologicals.
Western Blot: TRF-2 Antibody - BSA Free [NB110-57130] -
Western Blot: TRF-2 Antibody - BSA Free [NB110-57130] - Telomere deprotection contributes to replication stress lethality. a Western blots of whole cell extracts from HT1080 6TG cells stably transduced with control, TRF2 shRNA (TRF sh-F) or TRF2 over expression (TRF2OE) vectors. b Representative images of cyto-centrifuged chromosome spreads stained with DAPI (blue), gamma -H2AX IF (red) & telomere PNA (green) from control, TRF sh-F or TRF2OE HT1080 6TG cells treated with DMSO or APH. Scale bar represents 10 µm. c, d Quantitation of mitotic telomere DDR foci from Control sh & TRF2 sh-F cells (c) or vector & TRF2OE cells (d) ± DMSO or APH (three biological replicates scoring n = 50 mitotic spreads per replicate compiled in a Tukey box plot, Mann–Whitney test). e Difference in the mean number of mitotic telomeric gamma -H2AX foci between HT1080 6TG TRF2 sh-F or TRF2OE cells & their appropriate vector control. These are a different representation of the same data shown in (c, d) (mean ± s.e.m., n = 3 three biological replications, Student’s t-test). f Mitotic duration to cell death in APH treated control, TRF2 sh-F & or TRF2OE cells (three biological replicates scoring ≥267 mitotic death events per condition are shown in a dot plot, mean ± s.e.m., Mann–Whitney test). g Mitotic outcome of control, TRF2 sh-F & TRF2OE cells treated with APH or DMSO (mean ± s.e.m., n = 3 biological replicates of at least 267 mitoses per condition, Fisher’s Exact Test). For all panels, *p < 0.05, **p < 0.01. Source data are provided as a Source Data file Image collected & cropped by CiteAb from the following publication (https://pubmed.ncbi.nlm.nih.gov/31530811), licensed under a CC-BY license. Not internally tested by Novus Biologicals.
Western Blot: TRF-2 Antibody - BSA Free [NB110-57130] -
Western Blot: TRF-2 Antibody - BSA Free [NB110-57130] - A. Co-IP analysis of the interaction between DSP & TRF2 in HEK293 cells & MCF-7 cells. B. Co-IP analysis of the interaction between DSP & TRF2 in DSP-EGFP transfected HEK293 cells or DSP△NLS-EGFP transfected HEK293 cells. C. DSP pull down by telomere targeting CASID with the condition of TRF2 knockdown in HEK293 cells. Histone H3 is the loading control. D.TRF1 & TRF2 pull-down assay by telomere targeting CASID with the condition of DSP knockdown in HEK293 cells. E. Left, Dot blot of telomere DNA repeats in chromatin pull down by DSP with the condition of TRF1 or TRF2 knockdown. The dot-blot was performed at least three times & the represented one is shown. Right, the histogram shows the quantitated results of the dot blots. The triple asterisks (***) indicates a p-value less than 0.01. ns. indicates the insignificance difference. Image collected & cropped by CiteAb from the following publication (https://pubmed.ncbi.nlm.nih.gov/31595153), licensed under a CC-BY license. Not internally tested by Novus Biologicals.
Western Blot: TRF-2 Antibody - BSA Free [NB110-57130] -
Western Blot: TRF-2 Antibody - BSA Free [NB110-57130] - A. TRF2 or DSP1 pull down by telomere targeting CASID with the condition of MST-312 treatment (left) or hTERT knockdown (right) in MDA-MB-231cells. B. Southern blot of telomere DNA from MDA-MB-231cells treated with MST-312 or with hTERT knockdown. C. Top, Dot blot of telomere DNA repeats from the chromatin pull down by DSP from the cells treated by MST-312 (left) or hTERT knockdown (right). Alu DNA repeats serve as negative control. Bottom, the histogram shows the quantitated results of the dot blots. The triple asterisks (***) indicates a p-value less than 0.01. D. Fluorescence image of DSP-EGFP transfected MDA-MB-231 cells with the conditions of MST-312 treatment or hTERT knockdown. E. Pull down assay of DSP by CASID targeting telomere in WI38 cells with or without ectopically expression of hTERT gene. Image collected & cropped by CiteAb from the following publication (https://pubmed.ncbi.nlm.nih.gov/31595153), licensed under a CC-BY license. Not internally tested by Novus Biologicals.
Western Blot: TRF-2 Antibody - BSA Free [NB110-57130] -
Western Blot: TRF-2 Antibody - BSA Free [NB110-57130] - Attenuation of bortezomib-induced shelterin protein dysregulation by hTERT over-expressionA. & B. Cells expressing ectopic hTERT were treated with bortezomib for 24 hours & mRNA levels of shelterin proteins then analyzed using qPCR. The levels of each target mRNA in bortezomib-treated cells were expressed as percentages of those in untreated cells. (A) HEL-hTERT cells & (B) BGC-823-hTERT cells. C. & D. Immunoblotting assessment of TRF1, TRF2 & POT1 protein expression in bortezomib-treated cells. Same sets of cells above were analyzed for TRF1, TRF2 & POT1 protein levels & shown was representative of three independent experiments. (C) HEL-hTERT cells & (D) BGC-823-hTERT cells.* & **: P < 0.05 & 0.01, respectively. BTZ, bortezomib. Image collected & cropped by CiteAb from the following publication (https://www.oncotarget.com/lookup/doi/10.18632/oncotarget.5752), licensed under a CC-BY license. Not internally tested by Novus Biologicals.
Immunocytochemistry/ Immunofluorescence: TRF-2 Antibody - BSA Free [NB110-57130] -
Immunocytochemistry/ Immunofluorescence: TRF-2 Antibody - BSA Free [NB110-57130] - RNaseH1 depletion leads to RPA activation at ALT telomeres.(a) HeLa & U2OS cells were transfected with the indicated siRNAs & 48 & 72 h later protein extracts were prepared. Western blot analysis was performed using antibodies against RNaseH1, RPA32 phosphorylated at Serine 33 (pSer33), total RPA32 & KAP1 (loading control). The asterisk indicates a cross-reacting band. Cells treated for 6 h with 5 mM hydroxyurea (HU) were used as controls for pSer33 activation. (b) SiRNA transfected cells were subjected to indirect immunofluorescence using antibodies against TRF2 (to visualize telomeres; red) & pSer33 (green). DNA was counterstained with DAPI (blue). Arrows point to examples of pSer33 foci co-localizing with TRF2 (TIFs). Scale bar, 9 μm. Cells treated for 6 h with 5 mM HU were used as controls for pSer33 activation. Image collected & cropped by CiteAb from the following publication (https://pubmed.ncbi.nlm.nih.gov/25330849), licensed under a CC-BY license. Not internally tested by Novus Biologicals.
Western Blot: TRF-2 Antibody - BSA Free [NB110-57130] -
Western Blot: TRF-2 Antibody - BSA Free [NB110-57130] - TRF2 interacts with lamin A/C.(a) Pull down of endogenous TRF2 in IMR90s. The top panel shows a blot probed for endogenous lamin A/C, & the bottom panel shows a blot with the same samples probed for TRF2. (b) Pull down of endogenously expressed lamin A/C in IMR90s. The top panel shows a blot probed for endogenous TRF2, & the bottom panel shows a blot with the same samples probed for endogenous lamin A/C. (c) Pull down of endogenous lamin A/C in IMR90s exogenously expressing GFP, GFP-TRF2, GFP-TRF delta B delta M or GFP-TRF1. The top panel shows a blot probed for GFP, & the bottom panel shows the same blot probed for lamin A/C. (d) Pull down of endogenous TRF2 in IMR90s exogenously expressing GFP, GFP-LMNA or progerin (GFP-LMNA delta 50). The top panel shows a blot probed for GFP, & the bottom panel shows the same blot probed for TRF2. Asterisks denote IgG bands. Image collected & cropped by CiteAb from the following publication (https://pubmed.ncbi.nlm.nih.gov/25399868), licensed under a CC-BY license. Not internally tested by Novus Biologicals.
Western Blot: TRF-2 Antibody - BSA Free [NB110-57130] -
Western Blot: TRF-2 Antibody - BSA Free [NB110-57130] - Widespread dysregulation of shelterin protein expression in bortezomib-treated HEL & BGC-823 cellsA. & B. mRNA levels of shelterin factors TRF1, TRF2, TPP1, POT1, RAP1 & TIN2 in bortezomib-treated cells. Cells were treated with bortezomib for 24 hours & qPCR was used for quantitative assays. The levels of each target mRNA in bortezomib-treated cells were expressed as percentages of those in untreated cells. (A) HEL cells & (B) BGC-823 cells. C. & D. Immunoblotting assessment of TRF1, TRF2 & POT1 protein expression in bortezomib-treated cells. Same sets of cells above were analyzed for TRF1, TRF2 & POT1 protein levels & shown was representative of three independent experiments. (C) HEL cells & (D) BGC-823 cells. * & **: P < 0.05 & 0.01, respectively. BTZ, bortezomib. Image collected & cropped by CiteAb from the following publication (https://www.oncotarget.com/lookup/doi/10.18632/oncotarget.5752), licensed under a CC-BY license. Not internally tested by Novus Biologicals.
Western Blot: TRF-2 Antibody - BSA Free [NB110-57130] -
Western Blot: TRF-2 Antibody - BSA Free [NB110-57130] - TRF2 interacts with lamin A/C.(a) Pull down of endogenous TRF2 in IMR90s. The top panel shows a blot probed for endogenous lamin A/C, & the bottom panel shows a blot with the same samples probed for TRF2. (b) Pull down of endogenously expressed lamin A/C in IMR90s. The top panel shows a blot probed for endogenous TRF2, & the bottom panel shows a blot with the same samples probed for endogenous lamin A/C. (c) Pull down of endogenous lamin A/C in IMR90s exogenously expressing GFP, GFP-TRF2, GFP-TRF delta B delta M or GFP-TRF1. The top panel shows a blot probed for GFP, & the bottom panel shows the same blot probed for lamin A/C. (d) Pull down of endogenous TRF2 in IMR90s exogenously expressing GFP, GFP-LMNA or progerin (GFP-LMNA delta 50). The top panel shows a blot probed for GFP, & the bottom panel shows the same blot probed for TRF2. Asterisks denote IgG bands. Image collected & cropped by CiteAb from the following publication (https://pubmed.ncbi.nlm.nih.gov/25399868), licensed under a CC-BY license. Not internally tested by Novus Biologicals.
Western Blot: TRF-2 Antibody - BSA Free [NB110-57130] -
Western Blot: TRF-2 Antibody - BSA Free [NB110-57130] - TRF2 transcriptionally regulates p21 expression through promoter occupancy. (A) Quantitative ChIP using TRF2 antibody gives enriched binding of TRF2 on p21 promoter in HT1080 & MDA-MB-231 cells, IgG was used as isotypic antibody control; normalized with 10% input (data represented as mean ± SEM, for three replicates). (B,C) TRF2 represses p21 promoter activity. In luciferase assay, si-RNA-mediated silencing or TRF2 over expression resulted in increased (B, *p value < 0.05, Student’s t-test; data represented as mean ± SEM of three replicates) or reduction (C, *p value < 0.05, Student’s t-test; data represented as mean ± SEM of three replicates) in p21 promoter activity in HT1080 & MDA-MB-231 cells, respectively; over expression of TRF2 devoid of DNA binding [deletion of basic (delB), myb (delM) & both basic/myb (delB-delM) domains] resulted in partial or complete rescue of p21 promoter activity in HT1080 & MDA-MB-231 cells (data represented as mean ± SEM, for three replicates) (C). (D,E) HT1080 cells over expressing TRF2 show reduced p21 protein expression, bar graph shows the densitometry analysis of three different immunoblot replicates (*p value < 0.05, Student’s t-test; data represented as mean ± SEM of three replicates). (E) (Full images are shown in Supplementary Figure S5); TRF2 silencing results in increase in p21 protein, bar graph shows the densitometry analysis of three different immunoblots (*p value < 0.05, Student’s t-test; data represented as mean ± SEM of three replicates) (F); & mRNA expression in HT1080 cells (*p value < 0.05, Student’s t-test; data represented as mean ± SEM of three replicates, GAPDH used as internal control for real-time PCR). Image collected & cropped by CiteAb from the following publication (https://www.nature.com/articles/s41598-017-11177-1), licensed under a CC-BY license. Not internally tested by Novus Biologicals.
Western Blot: TRF-2 Antibody - BSA Free [NB110-57130] -
Western Blot: TRF-2 Antibody - BSA Free [NB110-57130] - Attenuation of bortezomib-induced shelterin protein dysregulation by hTERT over-expressionA. & B. Cells expressing ectopic hTERT were treated with bortezomib for 24 hours & mRNA levels of shelterin proteins then analyzed using qPCR. The levels of each target mRNA in bortezomib-treated cells were expressed as percentages of those in untreated cells. (A) HEL-hTERT cells & (B) BGC-823-hTERT cells. C. & D. Immunoblotting assessment of TRF1, TRF2 & POT1 protein expression in bortezomib-treated cells. Same sets of cells above were analyzed for TRF1, TRF2 & POT1 protein levels & shown was representative of three independent experiments. (C) HEL-hTERT cells & (D) BGC-823-hTERT cells.* & **: P < 0.05 & 0.01, respectively. BTZ, bortezomib. Image collected & cropped by CiteAb from the following publication (https://www.oncotarget.com/lookup/doi/10.18632/oncotarget.5752), licensed under a CC-BY license. Not internally tested by Novus Biologicals.Applications for TRF-2 Antibody - BSA Free
Application
Recommended Usage
Chromatin Immunoprecipitation (ChIP)
1:10-1:500
Dot Blot
reported in scientific literature (PMID 31026066)
ELISA
reported in scientific literature (PMID 31575660)
Flow Cytometry
1-5 ug/ml
Immunocytochemistry/ Immunofluorescence
1:50 - 1:200
Immunohistochemistry
1:200
Immunohistochemistry-Paraffin
1:200
Immunoprecipitation
1:10 - 1:500. Use reported in scientific literature
Knockdown Validated
reported in scientific literature (PMID 31026066)
Simple Western
1:25
Western Blot
1:2000 - 1:5000
Application Notes
In Western blot, a band at approx. 56 kDa is seen. In ICC/IF, nuclear staining was observed in HeLa cells. In IHC, nuclear staining was observed in xenografted human breast cancer tissue. Prior to immunostaining paraffin tissues, antigen retrieval with sodium citrate buffer (pH 6.0) is recommended.
In Simple Western only 10 - 15 uL of the recommended dilution is used per data point.
See Simple Western Antibody Database for Simple Western validation: Tested in HeLa lysate 1.0 mg/mL, separated by Size, antibody dilution of 1:25, apparent MW was 66 kDa. Separated by Size-Wes, Sally Sue/Peggy Sue.
The observed molecular weight of the protein may vary from the listed predicted molecular weight due to post translational modifications, post translation cleavages, relative charges, and other experimental factors.
Reviewed Applications
Read 2 reviews rated 5 using NB110-57130 in the following applications:
Flow Cytometry Panel Builder
Bio-Techne Knows Flow Cytometry
Save time and reduce costly mistakes by quickly finding compatible reagents using the Panel Builder Tool.
Advanced Features
- Spectra Viewer - Custom analysis of spectra from multiple fluorochromes
- Spillover Popups - Visualize the spectra of individual fluorochromes
- Antigen Density Selector - Match fluorochrome brightness with antigen density

Formulation, Preparation, and Storage
Purification
Immunogen affinity purified
Formulation
PBS
Format
BSA Free
Preservative
0.02% Sodium Azide
Concentration
1.0 mg/ml
Shipping
The product is shipped with polar packs. Upon receipt, store it immediately at the temperature recommended below.
Stability & Storage
Store at 4C short term. Aliquot and store at -20C long term. Avoid freeze-thaw cycles.
Background: TRF-2
Both TRF2 and TRF1 bind to telomeric double stranded 5'-TTAGGG-3' DNA repeats, then recruit RAP1, TIN2, TPP1, and POT1 for the assembly of the shelterin complex. The telomeric association of TRF2 is greatly increased in the S phase of the cell cycle (2). Loss of TRF2 leads to telomere shortening, the DNA damage response, chromosomal instability, and replicative senescence. Interestingly, the contribution of TRF2 to telomere shortening via a telomerase-independent mechanism has also been reported (3). In conjunction with the exonuclease, Apollo, TRF2 protects telomeres during replication and negatively regulates the accumulation of DNA topoisomerase (TOP1, TOP2A and TOP2B).
TRF2 has been implicated in cancer, shown to be a major oncogene in telomerase-deficient mice. A link to Werner syndrome, a premature aging disease caused by the loss of WRN, has been reported based on TRF2 recruitment of WRN for processing of telomeric DNA (4). TRF2 expression is increased during human embryonic stem cell differentiation and has been shown to interact with Repressor Element-1 Silencing Transcription Factor (REST), protecting it from proteasomal degradation (5).
References
1. Grammatikakis, I., Zhang, P., Mattson, M. P., & Gorospe, M. (2016). The long and the short of TRF2 in neurogenesis. Cell cycle (Georgetown, Tex.), 15(22), 3026-3032. PMID: 27565210
2. Li, F., Kim, H., Ji, Z., Zhang, T., Chen, B., Ge, Y., Hu, Y., Feng, X., Han, X., Xu, H., Zhang, Y., Yu, H., Liu, D., Ma, W., & Songyang, Z. (2018). The BUB3-BUB1 Complex Promotes Telomere DNA Replication. Molecular cell, 70(3), 395-407. PMID: 29727616
3. Ancelin, K., Brunori, M., Bauwens, S., Koering, C. E., Brun, C., Ricoul, M., Pommier, J. P., Sabatier, L., & Gilson, E. (2002). Targeting assay to study the cis functions of human telomeric proteins: evidence for inhibition of telomerase by TRF1 and for activation of telomere degradation by TRF2. Molecular and cellular biology, 22(10), 3474-3487. PMID: 11971978
4. Machwe A, Xiao L, & Orren DK. (2004) TRF2 recruits the Werner syndrome (WRN) exonuclease for processing of telomeric DNA. Oncogene. 23(1):149-56. PMID: 14712220.
5. Diotti, R., & Loayza, D. (2011). Shelterin complex and associated factors at human telomeres. Nucleus (Austin, Tex.), 2(2), 119-135. PMID: 21738835
Long Name
Telomeric Repeat Binding Factor 2
Alternate Names
TERF2, TRBF2, TRF2
Gene Symbol
TERF2
Additional TRF-2 Products
Product Documents for TRF-2 Antibody - BSA Free
Certificate of Analysis
To download a Certificate of Analysis, please enter a lot or batch number in the search box below.
Product Specific Notices for TRF-2 Antibody - BSA Free
This product is for research use only and is not approved for use in humans or in clinical diagnosis. Primary Antibodies are guaranteed for 1 year from date of receipt.
Related Research Areas
Citations for TRF-2 Antibody - BSA Free
 Powered by Bioz
Customer Reviews for TRF-2 Antibody - BSA Free (2)
5 out of 5
2 Customer Ratings
Have you used TRF-2 Antibody - BSA Free?
Submit a review and receive an Amazon gift card!
$25/€18/£15/$25CAN/¥2500 Yen for a review with an image
$10/€7/£6/$10CAN/¥1110 Yen for a review without an image
Submit a review
Customer Images
Showing
1
-
2 of
2 reviews
Showing All
Filter By:
-
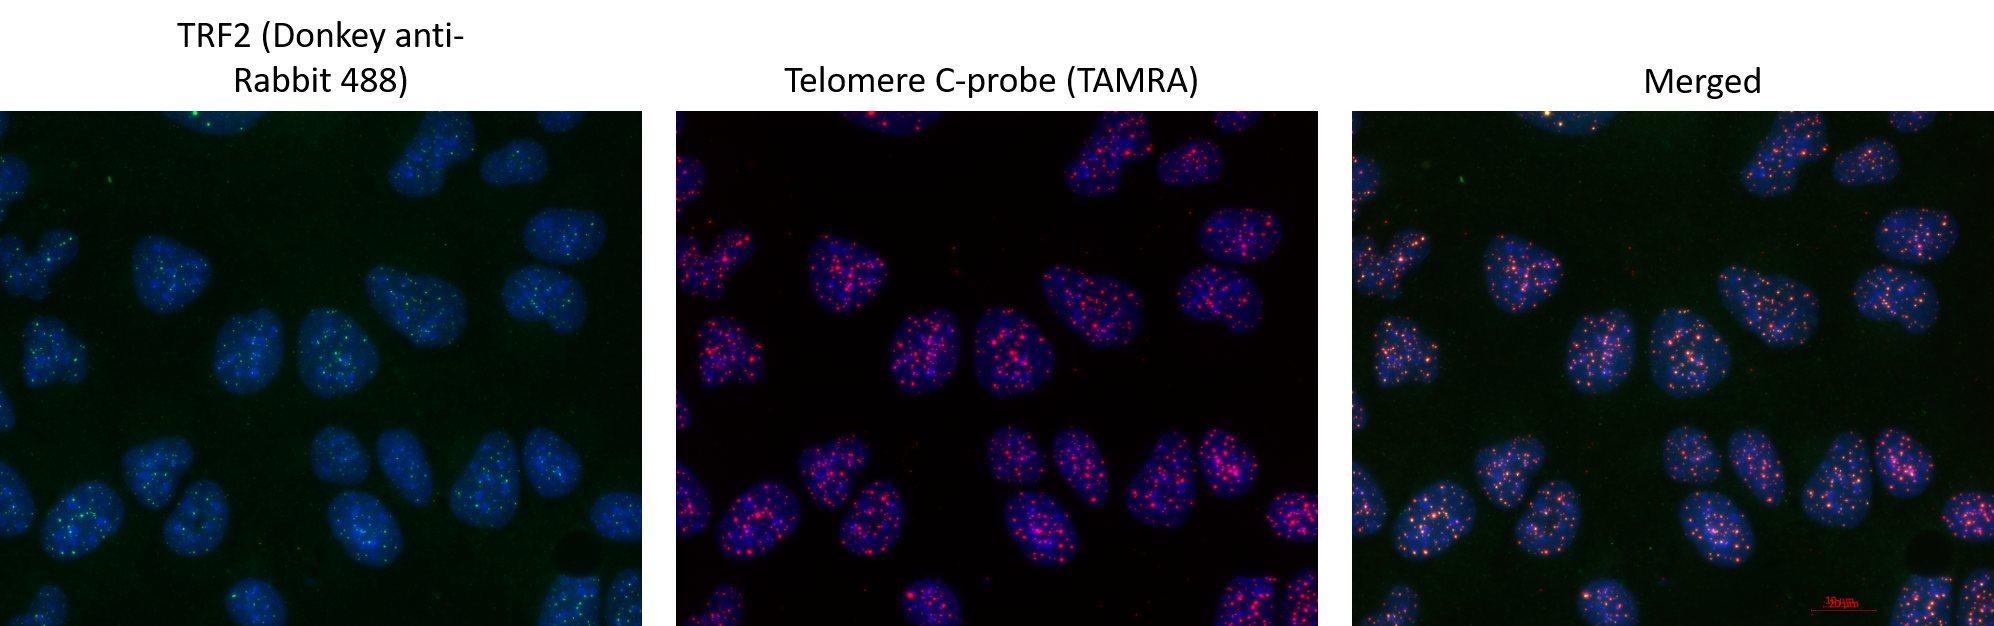
Application: ImmunocytochemistrySample Tested: U2OS cell line and U-2 OS cellsSpecies: HumanVerified Customer | Posted 10/11/2020Immunofluorescence and FISH staining of U-2 OS cells showing strong telomeric colocalisation of TRF2 detected with Donkey anti-rabbit AF488 and telomere with TAMRA-labelled FISH probe.Antibody used at 1:400 dilution in antibody dilution buffer and incubated for 2 hours at room-temperature. Detected with Donkey anti-rabbit AF488 antibody.

-
Application: Chromatin ImmunoprecipitationSample Tested: MouseSpecies: MouseVerified Customer | Posted 12/01/2014Titrated TRF2 antibody
There are no reviews that match your criteria.
Protocols
View specific protocols for TRF-2 Antibody - BSA Free (NB110-57130):
Protocol for Flow Cytometry Intracellular Staining
Sample Preparation.
1. Grow cells to 60-85% confluency. Flow cytometry requires between 2 x 10⁵ and 1 x 10⁶ cells for optimal performance.
2. If cells are adherent, harvest gently by washing once with staining buffer and then scraping. Avoid using trypsin as this can disrupt certain epitopes of interest. If enzymatic harvest is required, use Accutase, Collagenase, or TrypLE Express for a less damaging option.
3. Reserve 100 uL for counting, then transfer cell volume into a 50 mL conical tube and centrifuge for 8 minutes at 400 RCF.
a. Count cells using a hemocytometer and a 1:1 trypan blue exclusion stain to determine cell viability before starting the flow protocol. If cells appear blue, do not proceed.
4. Re-suspend cells to a concentration of 1 x 10⁶ cells/mL in staining buffer (NBP2-26247).
5. Aliquot out 100 uL samples in accordance with your experimental samples.
Tip: When cell surface and intracellular staining are required in the same sample, it is advisable that the cell surface staining be performed first since the fixation and permeabilization steps might reduce the availability of surface antigens.
Intracellular Staining.
Tip: When performing intracellular staining, it is important to use appropriate fixation and permeabilization reagents based upon the target and its subcellular location. Generally, our Intracellular Flow Assay Kit (NBP2-29450) is a good place to start as it contains an optimized combination of reagents for intracellular staining as well as an inhibitor of intracellular protein transport (necessary if staining secreted proteins). Certain targets may require more gentle or transient permeabilization protocols such as the commonly employed methanol or saponin-based methods.
Protocol for Cytoplasmic Targets:
1. Fix the cells by adding 100 uL fixation solution (such as 4% PFA) to each sample for 10-15 minutes.
2. Permeabilize cells by adding 100 uL of a permeabilization buffer to every 1 x 10⁶ cells present in the sample. Mix well and incubate at room temperature for 15 minutes.
a. For cytoplasmic targets, use a gentle permeabilization solution such as 1X PBS + 0.5% Saponin or 1X PBS + 0.5% Tween-20.
b. To maintain the permeabilized state throughout your experiment, use staining buffer + 0.1% of the permeabilization reagent (i.e. 0.1% Tween-20 or 0.1% Saponin).
3. Following the 15 minute incubation, add 2 mL of the staining buffer + 0.1% permeabilizer to each sample.
4. Centrifuge for 1 minute at 400 RCF.
5. Discard supernatant and re-suspend in 100 uL of staining buffer + 0.1% permeabilizer.
6. Add appropriate amount of each antibody (eg. 1 test or 1 ug per sample, as experimentally determined).
7. Mix well and incubate at room temperature for 30 minutes- 1 hour. Gently mix samples every 10-15 minutes.
8. Following the primary/conjugate incubation, add 1-2 mL/sample of staining buffer +0.1% permeabilizer and centrifuge for 1 minute at 400 RCF.
9. Wash twice by re-suspending cells in staining buffer (2 mL for tubes or 200 uL for wells) and centrifuging at 400 RCF for 5 minutes. Discard supernatant.
10. Add appropriate amount of secondary antibody (as experimentally determined) to each sample.
11. Incubate at room temperature in dark for 20 minutes.
12. Add 1-2 mL of staining buffer and centrifuge at 400 RCF for 1 minute and discard supernatant.
13. Wash twice by re-suspending cells in staining buffer (2 mL for tubes or 200 uL for wells) and centrifuging at 400 RCF for 5 minutes. Discard supernatant.
14. Resuspend in an appropriate volume of staining buffer (usually 500 uL per sample) and proceed with analysis on your flow cytometer.
Immunocytochemistry Protocol
Culture cells to appropriate density in 35 mm culture dishes or 6-well plates.
1. Remove culture medium and wash the cells briefly in PBS. Add 10% formalin to the dish and fix at room temperature for 10 minutes.
2. Remove the formalin and wash the cells in PBS.
3. Permeablize the cells with 0.1% Triton X100 or other suitable detergent for 10 min.
4. Remove the permeablization buffer and wash three times for 10 minutes each in PBS. Be sure to not let the specimen dry out.
5. To block nonspecific antibody binding, incubate in 10% normal goat serum from 1 hour to overnight at room temperature.
6. Add primary antibody at appropriate dilution and incubate overnight at 4C.
7. Remove primary antibody and replace with PBS. Wash three times for 10 minutes each.
8. Add secondary antibody at appropriate dilution. Incubate for 1 hour at room temperature.
9. Remove secondary antibody and replace with PBS. Wash three times for 10 minutes each.
10. Counter stain DNA with DAPi if required.
Immunohistochemistry-Paraffin Embedded Sections
Antigen Unmasking:
Bring slides to a boil in 10 mM sodium citrate buffer (pH 6.0) then maintain at a sub-boiling temperature for 10 minutes. Cool slides on bench-top for 30 minutes (keep slides in the sodium citrate buffer at all times).
Staining:
1. Wash sections in deionized water three times for 5 minutes each.
2. Wash sections in PBS for 5 minutes.
3. Block each section with 100-400 ul blocking solution (1% BSA in PBS) for 1 hour at room temperature.
4. Remove blocking solution and add 100-400 ul diluted primary antibody. Incubate overnight at 4 C.
5. Remove antibody solution and wash sections in wash buffer three times for 5 minutes each.
6. Add 100-400 ul HRP polymer conjugated secondary antibody. Incubate 30 minutes at room temperature.
7. Wash sections three times in wash buffer for 5 minutes each.
8. Add 100-400 ul DAB substrate to each section and monitor staining closely.
9. As soon as the sections develop, immerse slides in deionized water.
10. Counterstain sections in hematoxylin.
11. Wash sections in deionized water two times for 5 minutes each.
12. Dehydrate sections.
13. Mount coverslips.
Western Blot Protocol
1. Perform SDS-PAGE on samples to be analyzed, loading 10-25 ug of total protein per lane.
2. Transfer proteins to PVDF membrane according to the instructions provided by the manufacturer of the membrane and transfer apparatus.
3. Stain the membrane with Ponceau S (or similar product) to assess transfer success, and mark molecular weight standards where appropriate.
4. Rinse the blot TBS -0.05% Tween 20 (TBST).
5. Block the membrane in 5% Non-fat milk in TBST (blocking buffer) for at least 1 hour.
6. Wash the membrane in TBST three times for 10 minutes each.
7. Dilute primary antibody in blocking buffer and incubate overnight at 4C with gentle rocking.
8. Wash the membrane in TBST three times for 10 minutes each.
9. Incubate the membrane in diluted HRP conjugated secondary antibody in blocking buffer (as per manufacturer's instructions) for 1 hour at room temperature.
10. Wash the blot in TBST three times for 10 minutes each (this step can be repeated as required to reduce background).
11. Apply the detection reagent of choice in accordance with the manufacturer's instructions.
Find general support by application which include: protocols, troubleshooting, illustrated assays, videos and webinars.
- 7-Amino Actinomycin D (7-AAD) Cell Viability Flow Cytometry Protocol
- Antigen Retrieval Protocol (PIER)
- Antigen Retrieval for Frozen Sections Protocol
- Appropriate Fixation of IHC/ICC Samples
- Cellular Response to Hypoxia Protocols
- ChIP Protocol Video
- Chromatin Immunoprecipitation (ChIP) Protocol
- Chromatin Immunoprecipitation Protocol
- Chromogenic IHC Staining of Formalin-Fixed Paraffin-Embedded (FFPE) Tissue Protocol
- Chromogenic Immunohistochemistry Staining of Frozen Tissue
- ClariTSA™ Fluorophore Kits
- Detection & Visualization of Antibody Binding
- ELISA Sample Preparation & Collection Guide
- ELISA Troubleshooting Guide
- Extracellular Membrane Flow Cytometry Protocol
- Flow Cytometry Protocol for Cell Surface Markers
- Flow Cytometry Protocol for Staining Membrane Associated Proteins
- Flow Cytometry Staining Protocols
- Flow Cytometry Troubleshooting Guide
- Fluorescent IHC Staining of Frozen Tissue Protocol
- Graphic Protocol for Heat-induced Epitope Retrieval
- Graphic Protocol for the Preparation and Fluorescent IHC Staining of Frozen Tissue Sections
- Graphic Protocol for the Preparation and Fluorescent IHC Staining of Paraffin-embedded Tissue Sections
- Graphic Protocol for the Preparation of Gelatin-coated Slides for Histological Tissue Sections
- How to Run an R&D Systems DuoSet ELISA
- How to Run an R&D Systems Quantikine ELISA
- How to Run an R&D Systems Quantikine™ QuicKit™ ELISA
- ICC Cell Smear Protocol for Suspension Cells
- ICC Immunocytochemistry Protocol Videos
- ICC for Adherent Cells
- IHC Sample Preparation (Frozen sections vs Paraffin)
- Immunocytochemistry (ICC) Protocol
- Immunocytochemistry Troubleshooting
- Immunofluorescence of Organoids Embedded in Cultrex Basement Membrane Extract
- Immunofluorescent IHC Staining of Formalin-Fixed Paraffin-Embedded (FFPE) Tissue Protocol
- Immunohistochemistry (IHC) and Immunocytochemistry (ICC) Protocols
- Immunohistochemistry Frozen Troubleshooting
- Immunohistochemistry Paraffin Troubleshooting
- Immunoprecipitation Protocol
- Intracellular Flow Cytometry Protocol Using Alcohol (Methanol)
- Intracellular Flow Cytometry Protocol Using Detergents
- Intracellular Nuclear Staining Flow Cytometry Protocol Using Detergents
- Intracellular Staining Flow Cytometry Protocol Using Alcohol Permeabilization
- Intracellular Staining Flow Cytometry Protocol Using Detergents to Permeabilize Cells
- Preparing Samples for IHC/ICC Experiments
- Preventing Non-Specific Staining (Non-Specific Binding)
- Primary Antibody Selection & Optimization
- Propidium Iodide Cell Viability Flow Cytometry Protocol
- Protocol for Heat-Induced Epitope Retrieval (HIER)
- Protocol for Liperfluo
- Protocol for Making a 4% Formaldehyde Solution in PBS
- Protocol for VisUCyte™ HRP Polymer Detection Reagent
- Protocol for the Characterization of Human Th22 Cells
- Protocol for the Characterization of Human Th9 Cells
- Protocol for the Fluorescent ICC Staining of Cell Smears - Graphic
- Protocol for the Fluorescent ICC Staining of Cultured Cells on Coverslips - Graphic
- Protocol for the Preparation & Fixation of Cells on Coverslips
- Protocol for the Preparation and Chromogenic IHC Staining of Frozen Tissue Sections
- Protocol for the Preparation and Chromogenic IHC Staining of Frozen Tissue Sections - Graphic
- Protocol for the Preparation and Chromogenic IHC Staining of Paraffin-embedded Tissue Sections
- Protocol for the Preparation and Chromogenic IHC Staining of Paraffin-embedded Tissue Sections - Graphic
- Protocol for the Preparation and Fluorescent ICC Staining of Cells on Coverslips
- Protocol for the Preparation and Fluorescent ICC Staining of Non-adherent Cells
- Protocol for the Preparation and Fluorescent ICC Staining of Stem Cells on Coverslips
- Protocol for the Preparation and Fluorescent IHC Staining of Frozen Tissue Sections
- Protocol for the Preparation and Fluorescent IHC Staining of Paraffin-embedded Tissue Sections
- Protocol for the Preparation of Gelatin-coated Slides for Histological Tissue Sections
- Protocol for the Preparation of a Cell Smear for Non-adherent Cell ICC - Graphic
- Protocol: Annexin V and PI Staining by Flow Cytometry
- Protocol: Annexin V and PI Staining for Apoptosis by Flow Cytometry
- Quantikine HS ELISA Kit Assay Principle, Alkaline Phosphatase
- Quantikine HS ELISA Kit Principle, Streptavidin-HRP Polymer
- R&D Systems Quality Control Western Blot Protocol
- Sandwich ELISA (Colorimetric) – Biotin/Streptavidin Detection Protocol
- Sandwich ELISA (Colorimetric) – Direct Detection Protocol
- TUNEL and Active Caspase-3 Detection by IHC/ICC Protocol
- The Importance of IHC/ICC Controls
- Troubleshooting Guide: ELISA
- Troubleshooting Guide: Fluorokine Flow Cytometry Kits
- Troubleshooting Guide: Immunohistochemistry
- Troubleshooting Guide: Western Blot Figures
- Western Blot Conditions
- Western Blot Protocol
- Western Blot Protocol for Cell Lysates
- Western Blot Troubleshooting
- Western Blot Troubleshooting Guide
- View all Protocols, Troubleshooting, Illustrated assays and Webinars
FAQs for TRF-2 Antibody - BSA Free
Showing
1
-
3 of
3 FAQs
Showing All
-
Q: Are the TRF-2 antibodies validated in Simple Western?
A: Yes, we offer a 2 TRF-2 antibodies that have been tested in Simple Western: NB100-56506 and NB110-57130.
-
Q: Does TRF-2 antibodies comes in lyophilized form?
A: we carry 2 TERF2/TRBF2 antibodies in lyophilized form: AF5635, MAB5635.
-
Q: What the theoretical molecular weight for TRF-2 antibodies?
A: The TMW of TRF-2 antibodies is approximately 55 - 56 kDa.
-
Q: Are the TRF-2 antibodies validated in Simple Western?
A: Yes, we offer a 2 TRF-2 antibodies that have been tested in Simple Western: NB100-56506 and NB110-57130.
-
Q: Does TRF-2 antibodies comes in lyophilized form?
A: we carry 2 TERF2/TRBF2 antibodies in lyophilized form: AF5635, MAB5635.
-
Q: What the theoretical molecular weight for TRF-2 antibodies?
A: The TMW of TRF-2 antibodies is approximately 55 - 56 kDa.
Loading...