![Western Blot: ZEB1 Antibody [NBP1-05987]](https://resources.rndsystems.com/images/products/ZEB1-Antibody-Western-Blot-NBP1-05987-img0017.jpg "Western Blot: ZEB1 Antibody [NBP1-05987]")
Key Product Details
Validated by
Species Reactivity
Validated:
Cited:
Applications
Validated:
Cited:
Label
Antibody Source
Product Specifications
Immunogen
Reactivity Notes
Marker
Clonality
Host
Isotype
Scientific Data Images for ZEB1 Antibody
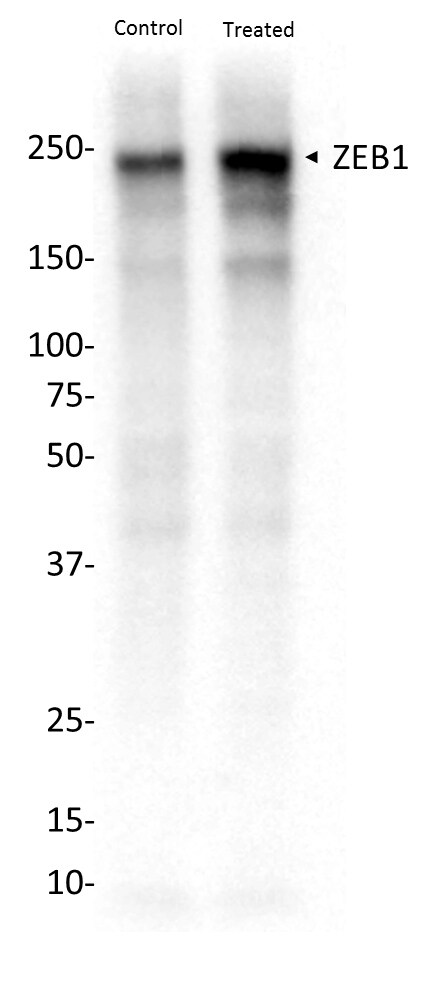
Western Blot: ZEB1 Antibody [NBP1-05987]
Western Blot: ZEB1 Antibody [NBP1-05987] - Samples: Whole cell lysate (15 ug) from HeLa, HEK293T, Jurkat, mouse TCMK-1, and mouse NIH 3T3 cells prepared using NETN lysis buffer. Antibody: Affinity purified rabbit anti-ZEB1 antibody (NBP1-05987) used for WB at 0.1 ug/ml. Detection: Chemiluminescence with an exposure time of 3 minutes.![Immunohistochemistry-Paraffin: ZEB1 Antibody [NBP1-05987]](https://resources.rndsystems.com/images/products/ZEB1-Antibody-Immunohistochemistry-Paraffin-NBP1-05987-img0019.jpg "Immunohistochemistry-Paraffin: ZEB1 Antibody [NBP1-05987]")
Immunohistochemistry-Paraffin: ZEB1 Antibody [NBP1-05987]
Immunohistochemistry-Paraffin: ZEB1 Antibody [NBP1-05987] - Sample: FFPE section of human breast carcinoma. Antibody: Affinity purified rabbit anti-ZEB1 (NBP1-05987) used at a dilution of 1:1000 (0.2 ug/ml). Detection: DAB.![Western Blot: ZEB1 Antibody [NBP1-05987]](https://resources.rndsystems.com/images/products/ZEB1-Antibody-Western-Blot-NBP1-05987-img0003.jpg "Western Blot: ZEB1 Antibody [NBP1-05987]")
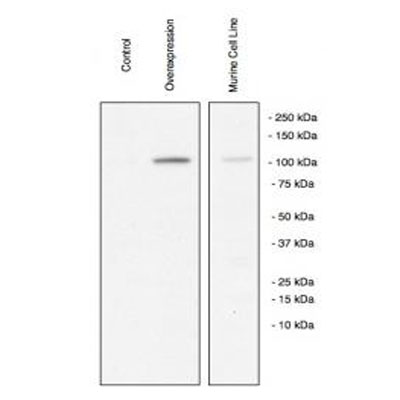
Western Blot: ZEB1 Antibody [NBP1-05987]
Western Blot: ZEB1 Antibody [NBP1-05987] - Analysis of ZEB1 in transfected and native mouse cell lysate. Image courtesy of anonymous customer review.![Immunohistochemistry-Paraffin: ZEB1 Antibody [NBP1-05987]](https://resources.rndsystems.com/images/products/ZEB1-Antibody-Immunohistochemistry-Paraffin-NBP1-05987-img0004.jpg "Immunohistochemistry-Paraffin: ZEB1 Antibody [NBP1-05987]")
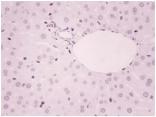
Immunohistochemistry-Paraffin: ZEB1 Antibody [NBP1-05987]
Immunohistochemistry-Paraffin: ZEB1 Antibody [NBP1-05987] - Analysis of ZEB1 in human liver and spleen tissues. Image courtesy of anonymous customer review.![Immunohistochemistry-Paraffin: ZEB1 Antibody [NBP1-05987]](https://resources.rndsystems.com/images/products/ZEB1-Antibody-Immunohistochemistry-Paraffin-NBP1-05987-img0018.jpg "Immunohistochemistry-Paraffin: ZEB1 Antibody [NBP1-05987]")
Immunohistochemistry-Paraffin: ZEB1 Antibody [NBP1-05987]
Immunohistochemistry-Paraffin: ZEB1 Antibody [NBP1-05987] - Sample: FFPE section of human breast carcinoma. Antibody: Affinity purified rabbit anti-ZEB1 (NBP1-05987) used at a dilution of 1:1000 (0.2 ug/ml). Detection: DAB.![Immunoprecipitation: ZEB1 Antibody [NBP1-05987]](https://resources.rndsystems.com/images/products/ZEB1-Antibody-Immunoprecipitation-NBP1-05987-img0013.jpg "Immunoprecipitation: ZEB1 Antibody [NBP1-05987]")
Immunoprecipitation: ZEB1 Antibody [NBP1-05987]
Immunoprecipitation: ZEB1 Antibody [NBP1-05987] - Detection of human ZEB1 by western blot of immunoprecipitates. Samples: Whole cell lysate (1.0 mg per IP reaction; 20% of IP loaded) from HeLa cells prepared using NETN lysis buffer. Antibodies: Affinity purified rabbit anti-ZEB1 antibody NBP1-05987 used for IP at 3 ug per reaction. ZEB1 was also immunoprecipitated by another rabbit anti-ZEB1 antibody. For blotting immunoprecipitated ZEB1, NBP1-05987 was used at 0.4 ug/ml. Detection: Chemiluminescence with an exposure time of 30 seconds.
Immunohistochemistry: ZEB1 Antibody [NBP1-05987] -
Immunohistochemical staining results of EMT regulators in HG‐PanIN: SNAIL, SLUG, TWIST1, and ZEB1. We categorized and defined three grades: grade 0, <10% positive staining; grade 1, 10%‐50% positive; grade 2, 50%< positive
Western Blot: ZEB1 Antibody [NBP1-05987] -
Western Blot: ZEB1 Antibody [NBP1-05987] - Lin28a & ETM-related protein expression changed after the knockdown of Zeb1 in mESCs, mEB, GC1, & P19. Western blotting demonstrated that E-cadherin protein expression increased & that Lin28a & Vimentin protein expression decreased in Zeb1-siRNA transfected mESC (panel a), mEB (panel b), GC1 (panel c), & P19 (panel d) cells. Each experiment was performed in triplicate. Abbreviations: NC, negative control; siRNA, small interfering RNA; & WT, wild-type. Image collected & cropped by CiteAb from the following publication (https://pubmed.ncbi.nlm.nih.gov/35611144), licensed under a CC-BY license. Not internally tested by Novus Biologicals.
Immunohistochemistry: ZEB1 Antibody [NBP1-05987] -
Immunohistochemistry: ZEB1 Antibody [NBP1-05987] - Immunohistochemical staining results of EMT regulators in HG‐PanIN: SNAIL, SLUG, TWIST1, & ZEB1. We categorized & defined three grades: grade 0, <10% positive staining; grade 1, 10%‐50% positive; grade 2, 50%< positive Image collected & cropped by CiteAb from the following publication (https://pubmed.ncbi.nlm.nih.gov/30791220), licensed under a CC-BY license. Not internally tested by Novus Biologicals.
Immunocytochemistry/ Immunofluorescence: ZEB1 Antibody [NBP1-05987] -
Immunocytochemistry/ Immunofluorescence: ZEB1 Antibody [NBP1-05987] - Location of Zeb1 proteins in mEC lines (mESC, mEB, GC1, & P19). Immunofluorescence analysis was used to determine localization of Zeb1 in mESC, mEB, GC1, & P19 using a Zeb1 antibody (red). Cell nuclei were labeled with Hoechst 33342 (blue). The scale for the measurement bar is 50 μm. Image collected & cropped by CiteAb from the following publication (https://pubmed.ncbi.nlm.nih.gov/35611144), licensed under a CC-BY license. Not internally tested by Novus Biologicals.
Western Blot: ZEB1 Antibody [NBP1-05987] -
Western Blot: ZEB1 Antibody [NBP1-05987] - Lin28a & ETM-related protein expression changed after the knockdown of Zeb1 in mESCs, mEB, GC1, & P19. Western blotting demonstrated that E-cadherin protein expression increased & that Lin28a & Vimentin protein expression decreased in Zeb1-siRNA transfected mESC (panel a), mEB (panel b), GC1 (panel c), & P19 (panel d) cells. Each experiment was performed in triplicate. Abbreviations: NC, negative control; siRNA, small interfering RNA; & WT, wild-type. Image collected & cropped by CiteAb from the following publication (https://pubmed.ncbi.nlm.nih.gov/35611144), licensed under a CC-BY license. Not internally tested by Novus Biologicals.
Western Blot: ZEB1 Antibody [NBP1-05987] -
Western Blot: ZEB1 Antibody [NBP1-05987] - Zeb1 expression in mESCs, mEB, GC1, & P19. (a) Zeb1 mRNA expression detected by real-time qPCR in mESC, mEB, GC1, & P19 (P < 0.001, data presented as mean value ± SD). (b) Zeb1 protein expression examined by western blot in mESC, mEB, GC1, & P19. Each experiment was performed in triplicate. Image collected & cropped by CiteAb from the following publication (https://pubmed.ncbi.nlm.nih.gov/35611144), licensed under a CC-BY license. Not internally tested by Novus Biologicals.
Western Blot: ZEB1 Antibody [NBP1-05987] -
Western Blot: ZEB1 Antibody [NBP1-05987] - Lin28a & ETM-related protein expression changed after the knockdown of Zeb1 in mESCs, mEB, GC1, & P19. Western blotting demonstrated that E-cadherin protein expression increased & that Lin28a & Vimentin protein expression decreased in Zeb1-siRNA transfected mESC (panel a), mEB (panel b), GC1 (panel c), & P19 (panel d) cells. Each experiment was performed in triplicate. Abbreviations: NC, negative control; siRNA, small interfering RNA; & WT, wild-type. Image collected & cropped by CiteAb from the following publication (https://pubmed.ncbi.nlm.nih.gov/35611144), licensed under a CC-BY license. Not internally tested by Novus Biologicals.
Immunocytochemistry/ Immunofluorescence: ZEB1 Antibody [NBP1-05987] -
Immunocytochemistry/ Immunofluorescence: ZEB1 Antibody [NBP1-05987] - Correlation of the expression of ZEB1 & IL‐6 & other cytokines in various cancers. (A) Correlation analysis of the expression of ZEB1 & cytokines in breast cancer cell lines using data obtained from the Cancer Cell Line Encyclopedia (CCLE). Breast cancer cell lines were selected for the analysis, & each dot represents a cell line. Affymetrix microarray probe IDs for IL6 & IL8 are shown after the gene symbols on the y‐axis. RMA, robust multiarray average. (B) Representative results obtained from the tissue array analysis in Fig. S3. The top panel shows a case that was positive for both nuclear ZEB1 staining (green) & whole‐cell IL‐6 staining (red); scores = 4. The bottom panel shows a case that was negative for both ZEB1 & IL‐6; scores = 1. The samples were counterstained with DAPI to show cell density in the spot. Original magnification: 20 ×. (C) Kaplan–Meier survival curves of breast & lung cancer patients obtained from a public meta‐analysis database & Kaplan–Meier plotter (Gyorffy et al., 2010, 2013). The probability of overall survival of patients as split by median IL6 & IL8 expression is shown. Red: IL6 & IL8 high expression group; black: IL6 & IL8 low expression group. Image collected & cropped by CiteAb from the following publication (https://pubmed.ncbi.nlm.nih.gov/28618162), licensed under a CC-BY license. Not internally tested by Novus Biologicals.
Western Blot: ZEB1 Antibody [NBP1-05987] -
Western Blot: ZEB1 Antibody [NBP1-05987] - SU5402, FGFR1 inhibitor, affects the EMT transcription factors.(A, B) ERK1/2 phosphorylation (p-ERK1/2) determined by immunoblotting in HSC-4 & OTC-04 treated for 30 min w/ 30 ng/ml FGF2 or 30 ng/ml FGF7 in presence of 10% FBS (A) & in TSU & HOC313 cells treated for 1 h w/ 30 ng/ml FGF2 or 30 μM SU5402 in absence of FBS (B). F2, FGF2; F7, FGF7; SU, SU5402. (C) We have previously reported that, after treatment w/ TGF-beta, NMuMG cells underwent EMT w/ the IIIc-isoform of FGFR1[17]. After NMuMG cells pretreated w/ TGF-beta transfected w/ mouse Fgfr1 siRNA or treated w/ SU5402, the cells further incubated in culture medium (CM) from TSU cells. SU, SU5402; siFR1, siRNA against mouse Fgfr1. (D)FGF2 mRNA levels determined by RT-qPCR analyses. The ratio of FGF2 mRNA to GAPDH mRNA in HSC-4 cells indicated as “1”. Each value represents the mean ± SD of triplicate determinations from a representative experiment. Similar results obtained in at least three independent experiments. (E) ERK1/2 phosphorylation (p-ERK1/2) in TSU & HOC313 cells monitored in presence of indicated concentration of SU5402 for 1 h under serum-free culture conditions, followed by immunoblot analysis. (F, G) Expression of indicated genes in TSU cells under serum-free culture conditions determined by RT-qPCR (F) & immunoblot (G) analyses, following treatment w/ 10 μM SU5402. Each value represents the mean ± SD of triplicate determinations from a representative experiment. Similar results obtained from at least three independent experiments. p values determined by Student’s t-test. **p < 0.01. (H) TSU cells treated w/ 10 μM U0126 in absence of FBS subjected to immunoblotting w/ the indicated antibodies. alpha -tubulin used as a loading control (A, B, C, E, G, & H). Image collected & cropped by CiteAb from the following publication (https://pubmed.ncbi.nlm.nih.gov/31682640), licensed under a CC-BY license. Not internally tested by Novus Biologicals.
Western Blot: ZEB1 Antibody [NBP1-05987] -
Western Blot: ZEB1 Antibody [NBP1-05987] - Vimentin & ZEB1 protein levels are regulated by OVOL1 & OVOL2 in a human SCC cell line. (A) Relative protein expression levels of OVOL1 & OVOL2 in A431 cells treated with control siRNA, OVOL1 siRNA, or OVOL2 siRNA for 48 h. (Left) Representative blot images & (right) relative expression levels calculated from three independent experiments. (B) Relative protein expression levels of vimentin, ZEB1, & E-cadherin in A431 cells treated with control siRNA, OVOL1 siRNA, or OVOL2 siRNA for 72 h. (Upper) representative blot images & (lower) relative protein expression levels calculated from three independent experiments. Mann–Whitney U-test; error bars represent mean ± standard deviation. Protein expressions are relative to those of beta -actin as a reference. The control siRNA value was set to 1. p-values < 0.05 were assumed to indicate a statistically significant difference; * p < 0.05. Image collected & cropped by CiteAb from the following publication (https://pubmed.ncbi.nlm.nih.gov/32106476), licensed under a CC-BY license. Not internally tested by Novus Biologicals.
Western Blot: ZEB1 Antibody [NBP1-05987] -
Western Blot: ZEB1 Antibody [NBP1-05987] - PDGFR-alpha / beta promotes sarcoma CSC migration/invasion & anchorage-independent growth.a Western blot analysis of cell adhesion protein N-cadherin & EMT transcription factors Snail, Slug, & Zeb1 in human sarcoma cell lines grown as monolayers & as spheroids. beta -actin was used as the loading control. b Representative images under light microscopy of migration & invasion assays of human sarcoma cell lines grown as monolayers or as spheroids for 24–48 h. Graphs display the number of migrated or invasive cells per field. c Representative light microscopy images of forrmed colonies in soft agar assay of human sarcoma cell lines grown as monolayers or spheroids for 14–20 days. Graph displays the number colonies per field. d Representative images under light microscopy of migration & invasion assays of human sarcoma cell lines grown as monolayers or as spheroids. Spheroid cells were treated with imatinib or DMSO. e Western blot analysis of N-cadherin & EMT-regulating transcription factors in human sarcoma cell lines grown as spheroids & treated with imatinib or DMSO. Experiments in a & e were performed three times with similar results. Bars represent standard deviation. *p < 0.05 compared to Monolayers Image collected & cropped by CiteAb from the following publication (https://www.nature.com/articles/s41389-018-0059-1), licensed under a CC-BY license. Not internally tested by Novus Biologicals.
Western Blot: ZEB1 Antibody [NBP1-05987] -
Western Blot: ZEB1 Antibody [NBP1-05987] - FGFR1 siRNAs attenuate the malignant phenotypes of cancer cells.(A) mRNA from TSU cells transfected with siRNAs against FGFR1 (siFGFR1) were subjected to conventional RT-PCR to determine the levels of endogenous FGFR1. (B, C, D) After transfection with siFGFR1 in TSU cells, phosphorylation of ERK1/2 (p-ERK1/2) (B), ZEB1 levels (C), & cell morphology (D) were determined. (E) TSU cells transfected with siFGFR1 were subjected to immunofluorescence analyses. Low magnification, 40×; high magnification, 80×. (F, G, H, I) After either treatment with SU5402 or transfection with siFGFR1 in TSU & HOC313 cells, the number of cells & invasive properties were determined under serum-free culture conditions. (J & K) After transfection with siFGFR1c in TSU & HOC313 cells, invasive & migratory properties were determined under serum-free culture conditions in TSU & HOC313 cells, respectively. siNC, non-specific control siRNA. Each value represents the mean ± SD of triplicate determinations from a representative experiment. Similar results were obtained from at least three independent experiments. p values were determined by Student’s t-test. *p < 0.01. Image collected & cropped by CiteAb from the following publication (https://pubmed.ncbi.nlm.nih.gov/31682640), licensed under a CC-BY license. Not internally tested by Novus Biologicals.
Western Blot: ZEB1 Antibody [NBP1-05987] -
Western Blot: ZEB1 Antibody [NBP1-05987] - PDGFR-alpha / beta promotes sarcoma CSC migration/invasion & anchorage-independent growth.a Western blot analysis of cell adhesion protein N-cadherin & EMT transcription factors Snail, Slug, & Zeb1 in human sarcoma cell lines grown as monolayers & as spheroids. beta -actin was used as the loading control. b Representative images under light microscopy of migration & invasion assays of human sarcoma cell lines grown as monolayers or as spheroids for 24–48 h. Graphs display the number of migrated or invasive cells per field. c Representative light microscopy images of forrmed colonies in soft agar assay of human sarcoma cell lines grown as monolayers or spheroids for 14–20 days. Graph displays the number colonies per field. d Representative images under light microscopy of migration & invasion assays of human sarcoma cell lines grown as monolayers or as spheroids. Spheroid cells were treated with imatinib or DMSO. e Western blot analysis of N-cadherin & EMT-regulating transcription factors in human sarcoma cell lines grown as spheroids & treated with imatinib or DMSO. Experiments in a & e were performed three times with similar results. Bars represent standard deviation. *p < 0.05 compared to Monolayers Image collected & cropped by CiteAb from the following publication (https://www.nature.com/articles/s41389-018-0059-1), licensed under a CC-BY license. Not internally tested by Novus Biologicals.
Western Blot: ZEB1 Antibody [NBP1-05987] -
Western Blot: ZEB1 Antibody [NBP1-05987] - Nav1.4 protein levels are decreased in muscles from mouse models of SMA. (A) Immunoblot analysis using muscle lysate from P2, P5, P9, & P21 wild type mice. Nav1.4 protein levels increase during postnatal muscle development & form the predominant sodium channel expressed in mature skeletal muscle. GAPDH served as a loading control (N = 3). (B) Representative immunoblot with quantification, showing a decrease in levels of sodium channel Nav1.4 & Nav1.5 in P5 Smn-/-;SMN2 hindlimb muscle compared with controls (N = 3). (C) Quantification of immunoblot analyses in P21 Smn2B/- & control hindlimb muscles revealed a decrease in Nav1.4 levels. Early in postnatal muscle development, the Nav1.5 sodium channel isoform is the most predominant. In P21 Smn2B/- mice, the protein levels of Nav1.5 are higher than in controls (N = 3). (D) The protein level of the Nav1.4 positive regulator, NF1, is not altered in muscles from P21 Smn2B/- mice. Similarly, no change was detected in the protein levels of the Nav1.4 repressor ZEB. (E) Expression of sodium channel Nav1.4 in control sham & denervated samples 1 & 7 days post-denervation was assessed by immunoblot (N = 3). A decrease in the levels of Nav1.4 in muscle was noted at 7 days post-denervation. *, P < 0.05; **, P < 0.01. Image collected & cropped by CiteAb from the following publication (https://pubmed.ncbi.nlm.nih.gov/24119341), licensed under a CC-BY license. Not internally tested by Novus Biologicals.Applications for ZEB1 Antibody
Chromatin Immunoprecipitation (ChIP)
Gel Super Shift Assays
Immunocytochemistry/ Immunofluorescence
Immunohistochemistry
Immunohistochemistry-Paraffin
Immunoprecipitation
Knockdown Validated
Microarray
Simple Western
Single Cell Western
Western Blot
See Simple Western Antibody Database for Simple Western validation: Tested in Jurkat lysate 0.5 mg/mL, separated by Size, antibody dilution of 1:50, apparent MW was 170 kDa. Separated by Size-Wes, Sally Sue/Peggy Sue. IHC-P-Epitope retrieval with citrate buffer pH6.0 is recommended for FFPE tissue sections.
Reviewed Applications
Read 6 reviews rated 4.8 using NBP1-05987 in the following applications:
Formulation, Preparation, and Storage
Purification
Formulation
Preservative
Concentration
Shipping
Stability & Storage
Background: ZEB1
Long Name
Alternate Names
Gene Symbol
UniProt
Additional ZEB1 Products
Product Documents for ZEB1 Antibody
Certificate of Analysis
To download a Certificate of Analysis, please enter a lot or batch number in the search box below.
Product Specific Notices for ZEB1 Antibody
This product is for research use only and is not approved for use in humans or in clinical diagnosis. Primary Antibodies are guaranteed for 1 year from date of receipt.
Citations for ZEB1 Antibody
 Powered by Bioz
Customer Reviews for ZEB1 Antibody (6)
Have you used ZEB1 Antibody?
Submit a review and receive an Amazon gift card!
$25/€18/£15/$25CAN/¥2500 Yen for a review with an image
$10/€7/£6/$10CAN/¥1110 Yen for a review without an image
Submit a review
Customer Images
-
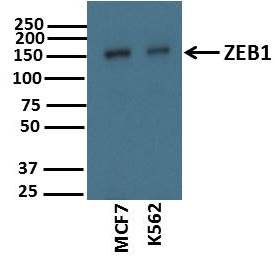
Application: Western BlotSample Tested: Human cancer cell linesSpecies: HumanVerified Customer | Posted 11/12/2017Sample: Whole cell lysates of of two cancer cell lines (10ug) Blocking: 5% nonfat dry milk reconstituted in TBS-T for 1 hour at room temperature Primary Antibody diluted (1:2000) in 5% nonfat dry milk reconstituted in TBS-T overnight at 4deg C Secondary Antibody: Goat Anti-Rabbit IgG H&L (HRP) (ab97051) at 1/10000 dilution in TBS-T

-
Application: Western BlotSample Tested: kidney and Mouse kidneySpecies: MouseVerified Customer | Posted 05/23/2017Performed on whole kidney in mouse with a 1:1000 primary and a 1:5000 secondary dilution.
-
Application: ImmunohistochemistrySample Tested: mouse liver, Mouse Pancreas and Mouse SpleenSpecies: MouseVerified Customer | Posted 04/18/2017
-
Application: Western BlotSample Tested: HumanSpecies: HumanVerified Customer | Posted 11/11/2011
-
Application: Immunohistochemistry-ParaffinSample Tested: liver and spleenSpecies: MouseVerified Customer | Posted 05/09/2011
-
Application: Western BlotSample Tested: Murine Cell Line, Sample Amount: 50ugSpecies: MouseVerified Customer | Posted 05/28/2010
There are no reviews that match your criteria.
Protocols
Find general support by application which include: protocols, troubleshooting, illustrated assays, videos and webinars.
- Antigen Retrieval Protocol (PIER)
- Antigen Retrieval for Frozen Sections Protocol
- Appropriate Fixation of IHC/ICC Samples
- Cellular Response to Hypoxia Protocols
- ChIP Protocol Video
- Chromatin Immunoprecipitation (ChIP) Protocol
- Chromatin Immunoprecipitation Protocol
- Chromogenic IHC Staining of Formalin-Fixed Paraffin-Embedded (FFPE) Tissue Protocol
- Chromogenic Immunohistochemistry Staining of Frozen Tissue
- ClariTSA™ Fluorophore Kits
- Detection & Visualization of Antibody Binding
- Fluorescent IHC Staining of Frozen Tissue Protocol
- Graphic Protocol for Heat-induced Epitope Retrieval
- Graphic Protocol for the Preparation and Fluorescent IHC Staining of Frozen Tissue Sections
- Graphic Protocol for the Preparation and Fluorescent IHC Staining of Paraffin-embedded Tissue Sections
- Graphic Protocol for the Preparation of Gelatin-coated Slides for Histological Tissue Sections
- ICC Cell Smear Protocol for Suspension Cells
- ICC Immunocytochemistry Protocol Videos
- ICC for Adherent Cells
- IHC Sample Preparation (Frozen sections vs Paraffin)
- Immunocytochemistry (ICC) Protocol
- Immunocytochemistry Troubleshooting
- Immunofluorescence of Organoids Embedded in Cultrex Basement Membrane Extract
- Immunofluorescent IHC Staining of Formalin-Fixed Paraffin-Embedded (FFPE) Tissue Protocol
- Immunohistochemistry (IHC) and Immunocytochemistry (ICC) Protocols
- Immunohistochemistry Frozen Troubleshooting
- Immunohistochemistry Paraffin Troubleshooting
- Immunoprecipitation Protocol
- Preparing Samples for IHC/ICC Experiments
- Preventing Non-Specific Staining (Non-Specific Binding)
- Primary Antibody Selection & Optimization
- Protocol for Heat-Induced Epitope Retrieval (HIER)
- Protocol for Making a 4% Formaldehyde Solution in PBS
- Protocol for VisUCyte™ HRP Polymer Detection Reagent
- Protocol for the Fluorescent ICC Staining of Cell Smears - Graphic
- Protocol for the Fluorescent ICC Staining of Cultured Cells on Coverslips - Graphic
- Protocol for the Preparation & Fixation of Cells on Coverslips
- Protocol for the Preparation and Chromogenic IHC Staining of Frozen Tissue Sections
- Protocol for the Preparation and Chromogenic IHC Staining of Frozen Tissue Sections - Graphic
- Protocol for the Preparation and Chromogenic IHC Staining of Paraffin-embedded Tissue Sections
- Protocol for the Preparation and Chromogenic IHC Staining of Paraffin-embedded Tissue Sections - Graphic
- Protocol for the Preparation and Fluorescent ICC Staining of Cells on Coverslips
- Protocol for the Preparation and Fluorescent ICC Staining of Non-adherent Cells
- Protocol for the Preparation and Fluorescent ICC Staining of Stem Cells on Coverslips
- Protocol for the Preparation and Fluorescent IHC Staining of Frozen Tissue Sections
- Protocol for the Preparation and Fluorescent IHC Staining of Paraffin-embedded Tissue Sections
- Protocol for the Preparation of Gelatin-coated Slides for Histological Tissue Sections
- Protocol for the Preparation of a Cell Smear for Non-adherent Cell ICC - Graphic
- R&D Systems Quality Control Western Blot Protocol
- TUNEL and Active Caspase-3 Detection by IHC/ICC Protocol
- The Importance of IHC/ICC Controls
- Troubleshooting Guide: Immunohistochemistry
- Troubleshooting Guide: Western Blot Figures
- Western Blot Conditions
- Western Blot Protocol
- Western Blot Protocol for Cell Lysates
- Western Blot Troubleshooting
- Western Blot Troubleshooting Guide
- View all Protocols, Troubleshooting, Illustrated assays and Webinars
FAQs for ZEB1 Antibody
-
Q: In looking at the Zeb1 antibodies on your website, the molecular weights of Zeb1 detected by several antibodies are different. Why is this?
A: ZEB1 is a rather large protein and undergoes a lot of post translational modifications such as phosphorylation and glycosylation (please see: UniProt P37275). The reason band patterns are different in the images may be due to sample type and how highly modified the ZEB1 protein is that the antibody is detecting. The more post translational modifications the higher you will detect the protein.
-
Q: We have an inquiry regarding the molecular weight of NBP1-05987, Anti-ZEB1. In the datasheet and customer review, the band sizes are very different (upper images: greater than 171kDa, under image (customer review): about 100kDa). If you have any idea why such difference occurred, could you let us know?
A:
ZEB1 protein is 1,117 amino acids long and its expected molecular weight is 122.5 kDa. However, because it can undergo multiple types of potential post-translational modifications (including Isopeptide bond, Phosphoprotein, Ubl conjugation, see: Q64318 http://www.uniprot.org/uniprot/Q64318), its observed molecular weight is always different than the predicted one. In our validation studies we observed specific bands in human and mouse cells at approximately 171kDa and almost all of the commercially available antibodies detect the target bands in this range (or at approximately 200kD). This product has been cited in the Journal of Biological Chemistry by Kizuka et al 2011 and they found our antibody to detect the target band at approximately 170kD (Please refer to Supplementary Figure # 3; JBC September 9, 2011 vol. 286 no. 36 31875-31884).
-
Q: In looking at the Zeb1 antibodies on your website, the molecular weights of Zeb1 detected by several antibodies are different. Why is this?
A: ZEB1 is a rather large protein and undergoes a lot of post translational modifications such as phosphorylation and glycosylation (please see: UniProt P37275). The reason band patterns are different in the images may be due to sample type and how highly modified the ZEB1 protein is that the antibody is detecting. The more post translational modifications the higher you will detect the protein.
-
Q: We have an inquiry regarding the molecular weight of NBP1-05987, Anti-ZEB1. In the datasheet and customer review, the band sizes are very different (upper images: greater than 171kDa, under image (customer review): about 100kDa). If you have any idea why such difference occurred, could you let us know?
A:
ZEB1 protein is 1,117 amino acids long and its expected molecular weight is 122.5 kDa. However, because it can undergo multiple types of potential post-translational modifications (including Isopeptide bond, Phosphoprotein, Ubl conjugation, see: Q64318 http://www.uniprot.org/uniprot/Q64318), its observed molecular weight is always different than the predicted one. In our validation studies we observed specific bands in human and mouse cells at approximately 171kDa and almost all of the commercially available antibodies detect the target bands in this range (or at approximately 200kD). This product has been cited in the Journal of Biological Chemistry by Kizuka et al 2011 and they found our antibody to detect the target band at approximately 170kD (Please refer to Supplementary Figure # 3; JBC September 9, 2011 vol. 286 no. 36 31875-31884).