

Scientific images may be resized, cropped, or adjusted for brightness or contrast for presentation purposes. These updates are limited to presentation and do not affect the underlying scientific interpretation of the data. Where available, additional source data may be provided upon request.
Key Product Details
Validated by
Species Reactivity
Validated:
Cited:
Applications
Validated:
Cited:
Label
Antibody Source
Product Specifications
Immunogen
Leu85-Ala177
Accession # Q13887
Specificity
Clonality
Host
Isotype
Scientific Data Images for KLF5 Antibody
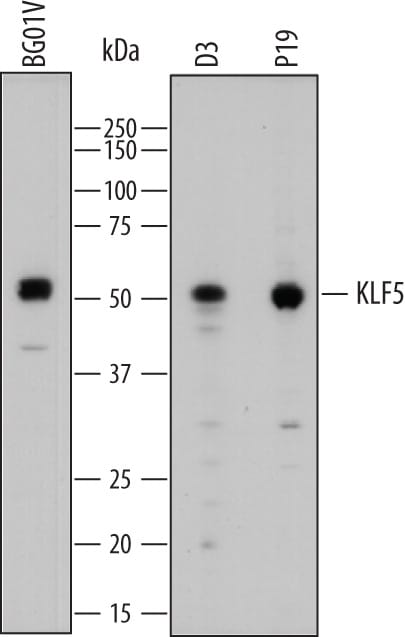
Detection of Human and Mouse KLF5 by Western Blot.
Western blot shows lysates of BG01V human embryonic stem cells, D3 mouse embryonic stem cell line, and P19 mouse embryonal carcinoma cell line. PVDF membrane was probed with 1 µg/mL of Goat Anti-Human KLF5 Antigen Affinity-purified Polyclonal Antibody (Catalog # AF3758) followed by HRP-conjugated Anti-Goat IgG Secondary Antibody (HAF109). A specific band was detected for KLF5 at approximately 50-55 kDa (as indicated). This experiment was conducted under reducing conditions and using Immunoblot Buffer Group 1.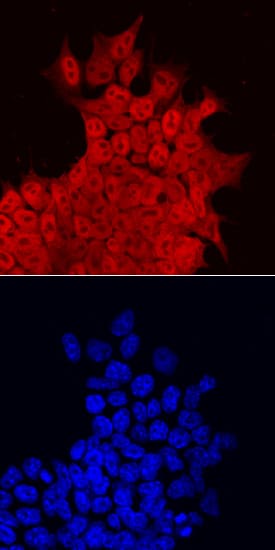
KLF5 in D3 Mouse Stem Cells.
KLF5 was detected in immersion fixed D3 mouse embryonic stem cell line using Goat Anti-Human KLF5 Antigen Affinity-purified Polyclonal Antibody (Catalog # AF3758) at 10 µg/mL for 3 hours at room temperature. Cells were stained using the NorthernLights™ 557-conjugated Anti-Goat IgG Secondary Antibody (red, upper panel; NL001) and counterstained with DAPI (blue, lower panel). Specific staining was localized to nuclei and cytoplasm. View our protocol for Fluorescent ICC Staining of Cells on Coverslips.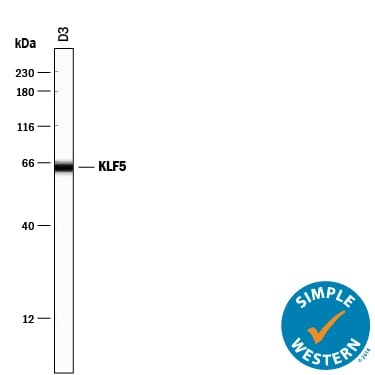
Detection of Mouse KLF5 by Simple WesternTM.
Simple Western lane view shows lysates of D3 mouse embryonic stem cell line, loaded at 0.2 mg/mL. A specific band was detected for KLF5 at approximately 64 kDa (as indicated) using 10 µg/mL of Goat Anti-Human/Mouse KLF5 Antigen Affinity-purified Polyclonal Antibody (Catalog # AF3758) followed by 1:50 dilution of HRP-conjugated Anti-Goat IgG Secondary Antibody (HAF109). This experiment was conducted under reducing conditions and using the 12-230 kDa separation system.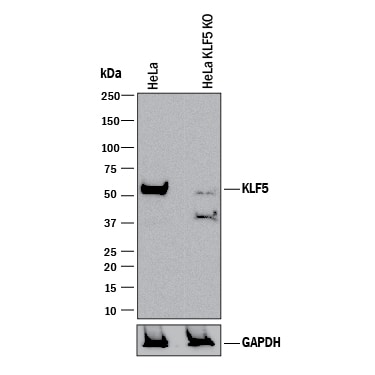
Western Blot Shows Human KLF5 Specificity by Using Knockout Cell Line.
Western blot shows lysates of HeLa human cervical epithelial carcinoma parental cell line and KLF5 knockout HeLa cell line (KO). PVDF membrane was probed with 1 µg/mL of Goat Anti-Human/Mouse KLF5 Antigen Affinity-purified Polyclonal Antibody (Catalog # AF3758) followed by HRP-conjugated Anti-Goat IgG Secondary Antibody (HAF017). A specific band was detected for KLF5 at approximately 53 kDa (as indicated) in the parental HeLa cell line, but is not detectable in knockout HeLa cell line. GAPDH (AF5718) is shown as a loading control. This experiment was conducted under reducing conditions and using Immunoblot Buffer Group 1.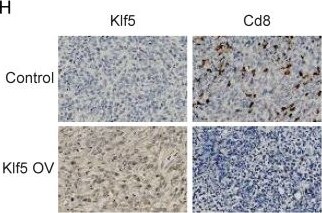
Detection of b7ehr43hcaggvlqdjz3n.jpg by Immunohistochemistry
KLF5-mediated tumor growth partially depends on CD8+ T lymphocytes. (A, D and G) Tumor growth curves of mice inoculated with 5 × 10⁵ PyMT/ PyMT-cre (Klf5 KO)-induced tumor cells (A), 3 × 10⁵ con or Klf5 knockdown (KD) EMT6 (D), or 4 × 10⁶ con or Klf5 overexpression (OV) 67NR (G). (B-C, E-F and H-I) The levels of Klf5 and Cd8 were quantified by ImageJ after staining with specific antibodies in paraffin-embedded tissues obtained from murine tumors. Representative images of Klf5 and Cd8 (B, E and H). The level of Cd8+cells was quantified in (C, F and I). Scale bar equals 50 μm. (J) Tumor growth curves of BALB/c mice inoculated with con or Klf5 KD EMT6 cells (3 × 10⁵) treated with isotype control or depleting anti-Cd8 antibodies. n ≥ 8 for mice in each group. Tumor growth curves (mean ± SEM) and Cd8 expression (mean ± SD) were plotted (*p < 0.05 or ns, not statistically significant vs. control; two-way ANOVA or Student's t test). Image collected and cropped by CiteAb from the following open publication (https://pubmed.ncbi.nlm.nih.gov/36923542), licensed under a CC-BY license. Not internally tested by R&D Systems.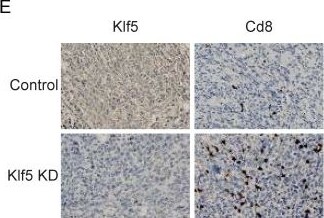
Detection of KLF5 by Immunohistochemistry
KLF5-mediated tumor growth partially depends on CD8+ T lymphocytes. (A, D and G) Tumor growth curves of mice inoculated with 5 × 10⁵ PyMT/ PyMT-cre (Klf5 KO)-induced tumor cells (A), 3 × 10⁵ con or Klf5 knockdown (KD) EMT6 (D), or 4 × 10⁶ con or Klf5 overexpression (OV) 67NR (G). (B-C, E-F and H-I) The levels of Klf5 and Cd8 were quantified by ImageJ after staining with specific antibodies in paraffin-embedded tissues obtained from murine tumors. Representative images of Klf5 and Cd8 (B, E and H). The level of Cd8+cells was quantified in (C, F and I). Scale bar equals 50 μm. (J) Tumor growth curves of BALB/c mice inoculated with con or Klf5 KD EMT6 cells (3 × 10⁵) treated with isotype control or depleting anti-Cd8 antibodies. n ≥ 8 for mice in each group. Tumor growth curves (mean ± SEM) and Cd8 expression (mean ± SD) were plotted (*p < 0.05 or ns, not statistically significant vs. control; two-way ANOVA or Student's t test). Image collected and cropped by CiteAb from the following open publication (https://pubmed.ncbi.nlm.nih.gov/36923542), licensed under a CC-BY license. Not internally tested by R&D Systems.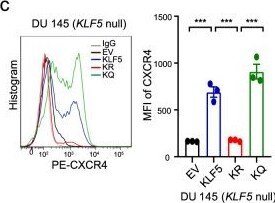
Detection of KLF5 by Flow Cytometry
Acetylation of KLF5 activates the transcription of CXCR4 in PCa cells.a–d Expression of CXCR4, as detected by real-time qPCR (a, b) and flow cytometry (c, d), in DU 145 cells (a, c) and PC-3 cells (b, d) expressing different forms of KLF5 in in vitro 2-dimentiomal cultures. MFI mean fluorescent intensity. Experiments were performed in duplicate for real-time qPCR (a, b) and in triplicate for flow cytometry (c, d). See more details of panels c and d in Supplementary Fig. 8a. e IHC staining of CXCR4 in tumor-bearing bone samples. Rates of CXCR4-positive cells are shown at the right. BM bone marrow region, T tumor region. Scale bar, 50 μm. n = 3, 5, 4, and 5 tumors for EV, KLF5, KR, and KQ groups respectively. f, g A region in the CXCR4 promoter, indicated by a red box, is specifically bound by KLF5KQ (KQ) but not by KLF5KR (KR), as demonstrated by ChIP-Seq analysis (f) and validated by ChIP-PCR with two different pairs of primers targeting the region (g). ChIP-PCR was performed in triplicate using in vitro two-dimentiomal cultures. h KQ is more potent than KR in the activation of CXCR4 promoter, as revealed by promoter-luciferase reporter assay of different CXCR4 promoter regions. Black ellipse, putative KLF5 binding motifs (KB) predicted by the oPROF web-based software. +1, transcription start site. Promoter-luciferase reporter assay was performed in triplicate. In panels c–e, data are shown in mean ± S.E.M. *p < 0.05; **p < 0.01; ***p < 0.001 (two-tailed Student’s t test). Source data are provided as a Source Data file. Image collected and cropped by CiteAb from the following open publication (https://pubmed.ncbi.nlm.nih.gov/33731701), licensed under a CC-BY license. Not internally tested by R&D Systems.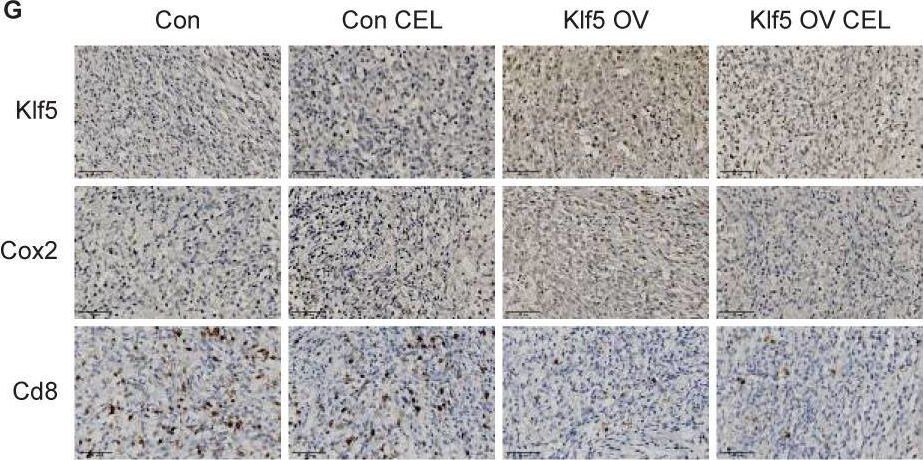
Detection of KLF5 by Immunohistochemistry
Inhibition of the Klf5/Cox2 axis increases the number and functionality of antineoplastic T lymphocytes in tumors. (A-B) Mice inoculated with control or Klf5-overexpression 67NR cells were treated every day with COX2 inhibitor (CEL) (total 6 times) when tumors were approximately 20 mm2 in mean area. (C-E) Tumor size and weight distributions at Day 11 are shown. (F) Pge2 levels were evaluated in Klf5-overexpression versus control 67NR tumors receiving daily CEL (30 mg/kg) treatment for 6 days (n = 3). (G-J) The Klf5, Cox2 and Cd8 levels were quantified by ImageJ after staining with specific antibodies in paraffin-embedded tissues obtained from Klf5- overexpression versus control 67NR tumors. Representative images of Klf5, Cox2 and Cd8 (G). Klf5 expression was quantified in (H). Cox2 expression was quantified in (I). The level of Cd8+cells was quantified in (J). (K) Schematic of the experimental setup. Cytofluorometric analysis of tumor-infiltrating lymphocytes (TIL): Cd4+Foxp3+Cd25+ regulatory T cells (Treg) (L), Cd3+Cd8+ cytotoxic T lymphocytes (M), Cd8+Cxcr6+ T lymphocytes (N), and quantification of Icos, Ifn gamma and Pd1 expression among both Cd4+ and Cd8+ T cells (O-T). Scale bar equals 50 μm. The data are represented as means ± SD. n ≥ 3 for mice in each group. (*p < 0.05; **, p <0.01; ***, p <0.001 significant vs. control; one-way or two-way ANOVA). Image collected and cropped by CiteAb from the following open publication (https://pubmed.ncbi.nlm.nih.gov/36923542), licensed under a CC-BY license. Not internally tested by R&D Systems.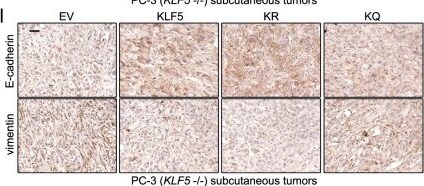
Detection of KLF5 by Immunohistochemistry
KLF5 is essential for subcutaneous tumor growth, but KLF5KQ is weaker while KLF5KR is stronger than KLF5 in their tumorigenic activities.a Deletion of KLF5 inhibited sphere formation in PC-3 cells. +/+, KLF5 wildtype; −/−, KLF5 null. Numbers of spheres in four different wells were analyzed. b–d Expression of wild-type KLF5 (KLF5), KLF5KR (KR), or KLF5KQ (KQ) rescued sphere formation but with different efficiencies, as indicated by representative images (b), numbers (c), and sizes (d) of spheres. EV empty vector. Scale bars in a and b, 500 μm. Three different wells were analyzed for sphere numbers in c, and four randomly selected spheres were used for analyzing size in d for each condition. e–h Subcutaneous tumor growth of DU 145 (e, f) and PC-3 (g, h) cells with different forms of KLF5, as indicated by tumor volumes at different times (e, g) and tumor weights at excision (f, h). Each group had eight tumors. i–k Detection of Ki67 and cleaved caspase 3 by IHC staining (i) and quantitative analyses of Ki67 (j) and cleaved caspase 3 (c-caspase-3) (k) positive rates in tumor xenografts of PC-3 cells. n = 3 tumors for each group. l–n IHC staining (l) and quantification of average staining intensities (m, n) of epithelial markers E-cadherin and mesenchymal marker vimentin in PC-3 tumor xenografts. n = 6 tumors for EV, KLF5, and KR groups and n = 5 tumors for the KQ group. IHC staining intensities were quantified with the Fiji software. Scale bars in i and l, 50 μm. In panels c, d, f, h, j, k, m, n, data are shown in mean ± S.E.M. NS not significant; *p < 0.05; **p < 0.01; ***p < 0.001 (two-tailed Student’s t test). In panels e and g, ***p < 0.001 (two-way ANOVA tests). Source data are provided as a Source Data file. Image collected and cropped by CiteAb from the following open publication (https://pubmed.ncbi.nlm.nih.gov/33731701), licensed under a CC-BY license. Not internally tested by R&D Systems.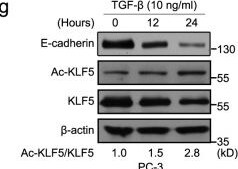
Detection of KLF5 by Western Blot
TGF-beta enriched in the bone induces acetylation of KLF5 at K369.a, b IHC staining of Ac-KLF5 and KLF5 in subcutaneous and tibial tumors of PC-3 cells (a) and DU 145 cells (b) from mice treated with the SD-208 TGF-beta inhibitor (50 mg/kg/day). Scale bars, 50 μm. c–f Statistical analysis of the IHC images in a and b by calculating the percentages of Ac-KLF5 (c, e) or KLF5 (d, f) positive cells in subcutaneous and tibial tumors of PC-3 (c, d) or DU 145 (e, f) cells, as counted by Fiji software. For each condition in c–f, three tumors from three mice were used, and n = 18 different images from the three tumors were analyzed, except for Ac-KLF5 in subcutaneous PC-3 and DU 145 tumors and tibial DU 145 tumors, where n = 12 different images were used. Scatter bars in black indicate subcutaneous tumors and those in brown indicate tibial tumors. g–i Detection of indicated proteins by western blotting in whole cell lysates of TGF-beta treated PC-3 (g), DU 145 (h), and C4-2B (i) cells in in vitro two-dimentional culture. The ratio of Ac-KLF5 to total KLF5 is indicated below the blots. Western blotting assays were repeated at least twice and consistent results were achieved as shown in Supplementary Fig. 1j. In panels c–f, data are shown in mean ± S.E.M. *p < 0.05; **p < 0.01; ***p < 0.001; NS not significant (two-tailed Student’s t test). Source data are provided as a Source Data file. Image collected and cropped by CiteAb from the following open publication (https://pubmed.ncbi.nlm.nih.gov/33731701), licensed under a CC-BY license. Not internally tested by R&D Systems.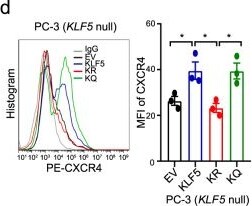
Detection of KLF5 by Flow Cytometry
Acetylation of KLF5 activates the transcription of CXCR4 in PCa cells.a–d Expression of CXCR4, as detected by real-time qPCR (a, b) and flow cytometry (c, d), in DU 145 cells (a, c) and PC-3 cells (b, d) expressing different forms of KLF5 in in vitro 2-dimentiomal cultures. MFI mean fluorescent intensity. Experiments were performed in duplicate for real-time qPCR (a, b) and in triplicate for flow cytometry (c, d). See more details of panels c and d in Supplementary Fig. 8a. e IHC staining of CXCR4 in tumor-bearing bone samples. Rates of CXCR4-positive cells are shown at the right. BM bone marrow region, T tumor region. Scale bar, 50 μm. n = 3, 5, 4, and 5 tumors for EV, KLF5, KR, and KQ groups respectively. f, g A region in the CXCR4 promoter, indicated by a red box, is specifically bound by KLF5KQ (KQ) but not by KLF5KR (KR), as demonstrated by ChIP-Seq analysis (f) and validated by ChIP-PCR with two different pairs of primers targeting the region (g). ChIP-PCR was performed in triplicate using in vitro two-dimentiomal cultures. h KQ is more potent than KR in the activation of CXCR4 promoter, as revealed by promoter-luciferase reporter assay of different CXCR4 promoter regions. Black ellipse, putative KLF5 binding motifs (KB) predicted by the oPROF web-based software. +1, transcription start site. Promoter-luciferase reporter assay was performed in triplicate. In panels c–e, data are shown in mean ± S.E.M. *p < 0.05; **p < 0.01; ***p < 0.001 (two-tailed Student’s t test). Source data are provided as a Source Data file. Image collected and cropped by CiteAb from the following open publication (https://pubmed.ncbi.nlm.nih.gov/33731701), licensed under a CC-BY license. Not internally tested by R&D Systems.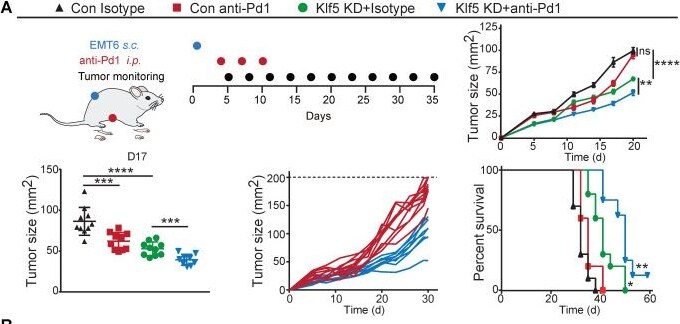
Detection of KLF5 by Flow Cytometry
Blocking the Klf5/Cox2 axis potentiates the antitumorigenic effects of anti-PD1 blockade. (A) Mice inoculated with control or Klf5-deficient EMT6 cells were treated every three days with anti-Pd1 blocker (total 3 times) when tumors were approximately 20 mm2 in mean area. Growth curves (mean ± SEM), tumor size distributions at Day 17, individual tumor growth curves and survival curves are shown. (B) Mice inoculated with control EMT6 cells were continuously treated for three or two days with FZU00,004 for two weeks with or without an anti-Pd1 blocker when tumors were approximately 20 mm2 in mean area. Growth curves (mean ± SEM), tumor size distributions at Day 17, individual tumor growth curves of mice and survival curves are shown. (C) Mice inoculated with control EMT6 cells were continuously treated with CEL for two weeks with or without an anti-Pd1 blocker when tumors were approximately 20 mm2 in mean area. Growth curves (mean ± SEM), tumor size distributions at Day 20, individual tumor growth curves and survival curves are shown. n ≥ 8 for mice in each group. (*p < 0.05; **, p <0.01; ***, p <0.001; ****, p <0.0001 or ns, not statistically significant vs. control; two-way ANOVA). The generation of immunological memory was assessed in cured animals by rechallenge with EMT6 and CT26. A fresh mouse (n = 1) was synchronously challenged with EMT6 and CT26 as a control. Image collected and cropped by CiteAb from the following open publication (https://pubmed.ncbi.nlm.nih.gov/36923542), licensed under a CC-BY license. Not internally tested by R&D Systems.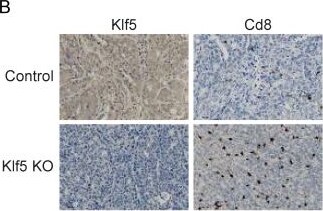
Detection of KLF5 by Immunohistochemistry
KLF5-mediated tumor growth partially depends on CD8+ T lymphocytes. (A, D and G) Tumor growth curves of mice inoculated with 5 × 10⁵ PyMT/ PyMT-cre (Klf5 KO)-induced tumor cells (A), 3 × 10⁵ con or Klf5 knockdown (KD) EMT6 (D), or 4 × 10⁶ con or Klf5 overexpression (OV) 67NR (G). (B-C, E-F and H-I) The levels of Klf5 and Cd8 were quantified by ImageJ after staining with specific antibodies in paraffin-embedded tissues obtained from murine tumors. Representative images of Klf5 and Cd8 (B, E and H). The level of Cd8+cells was quantified in (C, F and I). Scale bar equals 50 μm. (J) Tumor growth curves of BALB/c mice inoculated with con or Klf5 KD EMT6 cells (3 × 10⁵) treated with isotype control or depleting anti-Cd8 antibodies. n ≥ 8 for mice in each group. Tumor growth curves (mean ± SEM) and Cd8 expression (mean ± SD) were plotted (*p < 0.05 or ns, not statistically significant vs. control; two-way ANOVA or Student's t test). Image collected and cropped by CiteAb from the following open publication (https://pubmed.ncbi.nlm.nih.gov/36923542), licensed under a CC-BY license. Not internally tested by R&D Systems.Applications for KLF5 Antibody
Immunocytochemistry
Sample: Immersion fixed BG01V human embryonic stem cells and D3 mouse embryonic stem cells
Knockout Validated
Simple Western
Sample: D3 mouse embryonic stem cell line
Western Blot
Sample: BG01V human embryonic stem cells, D3 mouse embryonic stem cell line, and P19 mouse embryonal carcinoma cell line
Formulation, Preparation, and Storage
Purification
Reconstitution
Reconstitute at 0.2 mg/mL in sterile PBS. For liquid material, refer to CoA for concentration.
Formulation
Shipping
Stability & Storage
- 12 months from date of receipt, -20 to -70 °C as supplied.
- 1 month, 2 to 8 °C under sterile conditions after reconstitution.
- 6 months, -20 to -70 °C under sterile conditions after reconstitution.
Calculators
Background: KLF5
Long Name
Alternate Names
Entrez Gene IDs
Gene Symbol
UniProt
Additional KLF5 Products
Product Documents for KLF5 Antibody
Certificate of Analysis
To download a Certificate of Analysis, please enter a lot or batch number in the search box below.
Note: Certificate of Analysis not available for kit components.
Product Specific Notices for KLF5 Antibody
For research use only
Citations for KLF5 Antibody
 Powered by Bioz
Customer Reviews for KLF5 Antibody
There are currently no reviews for this product. Be the first to review KLF5 Antibody and earn rewards!
Have you used KLF5 Antibody?
Submit a review and receive an Amazon gift card!
$25/€18/£15/$25CAN/¥2500 for a review with an image
$10/€7/£6/$10CAN/¥1110 for a review without an image
Submit a review
Protocols
Find general support by application which include: protocols, troubleshooting, illustrated assays, videos and webinars.
- Appropriate Fixation of IHC/ICC Samples
- Cellular Response to Hypoxia Protocols
- ClariTSA™ Fluorophore Kits
- Detection & Visualization of Antibody Binding
- ICC Cell Smear Protocol for Suspension Cells
- ICC Immunocytochemistry Protocol Videos
- ICC for Adherent Cells
- Immunocytochemistry (ICC) Protocol
- Immunocytochemistry Troubleshooting
- Immunofluorescence of Organoids Embedded in Cultrex Basement Membrane Extract
- Immunohistochemistry (IHC) and Immunocytochemistry (ICC) Protocols
- Preparing Samples for IHC/ICC Experiments
- Preventing Non-Specific Staining (Non-Specific Binding)
- Primary Antibody Selection & Optimization
- Protocol for VisUCyte™ HRP Polymer Detection Reagent
- Protocol for the Fluorescent ICC Staining of Cell Smears - Graphic
- Protocol for the Fluorescent ICC Staining of Cultured Cells on Coverslips - Graphic
- Protocol for the Preparation and Fluorescent ICC Staining of Cells on Coverslips
- Protocol for the Preparation and Fluorescent ICC Staining of Non-adherent Cells
- Protocol for the Preparation and Fluorescent ICC Staining of Stem Cells on Coverslips
- Protocol for the Preparation of a Cell Smear for Non-adherent Cell ICC - Graphic
- R&D Systems Quality Control Western Blot Protocol
- TUNEL and Active Caspase-3 Detection by IHC/ICC Protocol
- The Importance of IHC/ICC Controls
- Troubleshooting Guide: Western Blot Figures
- Western Blot Conditions
- Western Blot Protocol
- Western Blot Protocol for Cell Lysates
- Western Blot Troubleshooting
- Western Blot Troubleshooting Guide
- View all Protocols, Troubleshooting, Illustrated assays and Webinars
Associated Pathways
