The urokinase-type plasminogen activator (uPA) is one of two activators that converts the extracellular zymogen plasminogen to plasmin, a serine protease that is involved in a variety of normal and pathological processes that require cell migration and/or tissue destruction. uPA is synthesized and released from cells as a single‑chain (sc) pro-enzyme with limited enzymatic activity and is converted to an active two-chain (tc) disulfide-linked active enzyme by plasmin and other specific proteinases. Both the scuPA and tcuPA bind with high-affinity to the cell surface via the glycosyl phosphatidylinositol-linked receptor uPAR which serves to localize the uPA proteolytic activity. The enzymatic activity of scuPA has also been shown to be enhanced by binding to uPAR. Independent of their proteolytic activity, the uPA/uPAR interaction also initiates signal transduction responses resulting in activation of protein tyrosine kinases, gene expression, cell adhesion, and chemotaxis. uPAR can interact with integrins to suppress normal integrin adhesive function and promote adhesion to vitronectin through a high affinity vitronectin binding site on uPAR. Mouse uPAR-1/Fc cDNA encodes a 327 amino acid (aa) residue precursor protein with a 23 aa residue signal peptide, seven potential N-linked glycosylation sites and a C-terminal GPI-anchor site. An alternate spliced variant of uPAR encoding a secreted soluble form of uPAR also exists. Human and mouse uPAR share approximately 60% aa sequence identity and the receptor-ligand interaction is highly species-specific. Human uPA binds rmuPAR at a lower affinity compared to rhuPAR.

Key Product Details
Validated by
Knockout/Knockdown, Biological Validation
Species Reactivity
Validated:
Mouse
Cited:
Mouse, Bovine, Transgenic Mouse
Applications
Validated:
Immunohistochemistry, Western Blot, Blockade of Receptor-ligand Interaction, Flow Cytometry, CyTOF-ready
Cited:
Immunohistochemistry, Immunohistochemistry-Frozen, Western Blot, Neutralization, Flow Cytometry, Immunocytochemistry, Immunoprecipitation, ELISA Development (Detection), In vivo assay
Label
Unconjugated
Antibody Source
Polyclonal Goat IgG
Loading...
Product Specifications
Immunogen
Mouse myeloma cell line NS0-derived recombinant mouse uPAR isoform 1
Leu24-Thr297
Accession # Q545X5
Leu24-Thr297
Accession # Q545X5
Specificity
Detects mouse uPAR in direct ELISAs and Western blots.
Clonality
Polyclonal
Host
Goat
Isotype
IgG
Endotoxin Level
<0.10 EU per 1 μg of the antibody by the LAL method.
Scientific Data Images for Mouse uPAR Antibody
uPAR in Mouse Kidney.
uPAR was detected in perfusion fixed frozen sections of mouse kidney using Goat Anti-Mouse uPAR Antigen Affinity-purified Polyclonal Antibody (Catalog # AF534) at 3 µg/mL overnight at 4 °C. Tissue was stained using the Anti-Goat HRP-DAB Cell & Tissue Staining Kit (brown; CTS008) and counterstained with hematoxylin (blue). Specific staining was localized to plasma membrane in epithelial cells. View our protocol for Chromogenic IHC Staining of Frozen Tissue Sections.
Detection of uPAR in Raw264.7 cells by Flow Cytometry.
Raw264.7 cells were stained with Goat Anti-Mouse uPAR Antigen Affinity-purified Polyclonal Antibody (Catalog # AF534, filled histogram) or isotype control antibody (Catalog # AB-108-C, open histogram), followed by Phycoerythrin-conjugated Anti-Goat IgG Secondary Antibody (Catalog # F0107). View our protocol for Staining Membrane-associated Proteins.
Detection of Mouse uPAR by Flow Cytometry
Expression of murine Plaur in AT84 cells.In vitro characterization of AT84 cells stably transfected with either empty vector (EV) or a vector containing cDNA encoding murine uPAR (Plaur). A: Western blot analysis of whole cell lysates using a polyclonal anti-murine uPAR antibody (AF534). A total of 7.5 ng of recombinant murine uPAR (rmuPAR) was loaded as a positive control. Re-probing for beta -actin was used as a loading control. B: Western blot analysis of cellular membrane fractions using a polyclonal anti-murine uPAR antibody (AF534). Total protein was measured per sample and 53.5 µg of protein was loaded per lane. A and B: Images were cropped, as no additional bands were detectable. C: FACS analysis of non-permeabilized cells using a polyclonal anti-murine uPAR antibody (AF534). Alexa Fluor 488 anti-goat secondary antibody (A11055) was used as the secondary antibody. The quantified mean Alexa 488 fluorescence signal per cell line is presented in the panel to the right. D and E: Relative Plaur mRNA (uPAR) (D) or Plau mRNA (uPA) (E) expression levels as analysed using RT-qPCR. All expression levels were normalized to the expression of the reference genes Trfc and beta -actin. Error bars represent the standard error of mean (+SEM) and N = 3. One-way ANOVA; *p<0.05. F: Plasminogen-gelatin (upper panel) and gelatin (lower panel) zymography analysis of conditioned medium of cells cultured for 24 hours in SFM. HMW-uPA and mPLM (mouse plasmin) were loaded as positive controls. The images were cropped to size. G: Relative Plasminogen mRNA (Plg) expression levels as analysed using RT-qPCR. Error bars represent standard error of mean (+SEM) and N = 3. Image collected and cropped by CiteAb from the following open publication (https://pubmed.ncbi.nlm.nih.gov/25157856), licensed under a CC-BY license. Not internally tested by R&D Systems.
Detection of Mouse uPAR by Western Blot
Leiomyoma conditioned medium induced uPAR expression.Analysis of uPAR expression induced by the LCM or purified ECM proteins in cultured uPAR knock-down cells. All Western blots were performed on whole cell lysates, and uPAR was detected using the polyclonal anti-murine uPAR antibody (AF534). A: Cells were either cultured in LCM (LM) or serum free medium (SF) for 24 hours. Cells were harvested with sample buffer and re-probing for beta -actin was used as a loading control. B: uPAR1-NT cells were seeded on different ECM protein substrates, incubated for 24 hours and harvested using RIPA buffer. 7.5 µg of total protein was loaded per lane. Equal loading was verified by re-probing for beta -actin. The poloxamer pluronic was used as a no-adhesion control. Col I = Collagen I, Vn = Vitronectin, Fn = Fibronectin, Lm = Laminin, ECL = Entactin, Collagen, Laminin, and FBS = Foetal Bovine Serum. C: Cells cultured in LCM (LM) or serum free medium (SF) for 24 hours were harvested using sample buffer and deglycosylated by PNGase F treatment (+) as indicated. Re-probing for beta -actin was used as a loading control. The three bands detected by the anti-uPAR antibody are labelled 1, 2, and 3, respectively. Image collected and cropped by CiteAb from the following open publication (https://pubmed.ncbi.nlm.nih.gov/25157856), licensed under a CC-BY license. Not internally tested by R&D Systems.
Detection of Mouse uPAR by Immunohistochemistry
Tumour microenvironment induced uPAR protein expression in tongue tumours.Tumour growth pattern and uPAR protein levels in tongue tumours generated from the EV1, EV2, uPAR1 and uPAR2 cells. A–B: Representative images depicting the tumour growth pattern at the tumour-stroma interface in hematoxylin/eosin stained EV1 (A) and uPAR1 (B) tumours. Images were recorded at 10x magnification. C–D: Representative images depicting the IHC uPAR staining of the EV1 (C) or uPAR1 tumours (D). Images were recorded at 4x magnification. E–H: The images show high power magnification (20x magnifications) of the EV1 (E), uPAR1 (F), EV2 (G) and uPAR2 (H) tumours IHC stained for uPAR protein. Positive uPAR staining is seen as brown colour, and counterstaining was done with haematoxylin. I: The average staining index (SI) of the uPAR staining in the tumours. Maximum obtainable score is 9. The error bars shows the +SEM. N = number of tumours; EV1, N = 8/10; EV2, N = 5/10; uPAR1, N = 4/10; uPAR2 N = 9/10. One-way ANOVA; **p<0.01, *p<0.05. T = Tumours, S = Stroma. Image collected and cropped by CiteAb from the following open publication (https://pubmed.ncbi.nlm.nih.gov/25157856), licensed under a CC-BY license. Not internally tested by R&D Systems.
Detection of Mouse uPAR by Immunohistochemistry
Leiomyoma stroma is a strong inducer of uPAR expression.Representative images of low- (EV1-sh3) and high- (uPAR1-NT) uPAR-expressing cells invading the ex vivo leiomyoma tissue. Cells were incubated for 7 and 14 days, as indicated. The tissue was IHC stained for uPAR. Positive uPAR staining is seen as brown colour, counterstained with haematoxylin. Images were recorded at 10x magnification. Image collected and cropped by CiteAb from the following open publication (https://pubmed.ncbi.nlm.nih.gov/25157856), licensed under a CC-BY license. Not internally tested by R&D Systems.
Detection of Mouse uPAR by Immunohistochemistry
Tumour microenvironment induced uPAR protein expression in tongue tumours.Tumour growth pattern and uPAR protein levels in tongue tumours generated from the EV1, EV2, uPAR1 and uPAR2 cells. A–B: Representative images depicting the tumour growth pattern at the tumour-stroma interface in hematoxylin/eosin stained EV1 (A) and uPAR1 (B) tumours. Images were recorded at 10x magnification. C–D: Representative images depicting the IHC uPAR staining of the EV1 (C) or uPAR1 tumours (D). Images were recorded at 4x magnification. E–H: The images show high power magnification (20x magnifications) of the EV1 (E), uPAR1 (F), EV2 (G) and uPAR2 (H) tumours IHC stained for uPAR protein. Positive uPAR staining is seen as brown colour, and counterstaining was done with haematoxylin. I: The average staining index (SI) of the uPAR staining in the tumours. Maximum obtainable score is 9. The error bars shows the +SEM. N = number of tumours; EV1, N = 8/10; EV2, N = 5/10; uPAR1, N = 4/10; uPAR2 N = 9/10. One-way ANOVA; **p<0.01, *p<0.05. T = Tumours, S = Stroma. Image collected and cropped by CiteAb from the following open publication (https://pubmed.ncbi.nlm.nih.gov/25157856), licensed under a CC-BY license. Not internally tested by R&D Systems.
Detection of Mouse uPAR by Immunohistochemistry
Tumour microenvironment induced uPAR protein expression in tongue tumours.Tumour growth pattern and uPAR protein levels in tongue tumours generated from the EV1, EV2, uPAR1 and uPAR2 cells. A–B: Representative images depicting the tumour growth pattern at the tumour-stroma interface in hematoxylin/eosin stained EV1 (A) and uPAR1 (B) tumours. Images were recorded at 10x magnification. C–D: Representative images depicting the IHC uPAR staining of the EV1 (C) or uPAR1 tumours (D). Images were recorded at 4x magnification. E–H: The images show high power magnification (20x magnifications) of the EV1 (E), uPAR1 (F), EV2 (G) and uPAR2 (H) tumours IHC stained for uPAR protein. Positive uPAR staining is seen as brown colour, and counterstaining was done with haematoxylin. I: The average staining index (SI) of the uPAR staining in the tumours. Maximum obtainable score is 9. The error bars shows the +SEM. N = number of tumours; EV1, N = 8/10; EV2, N = 5/10; uPAR1, N = 4/10; uPAR2 N = 9/10. One-way ANOVA; **p<0.01, *p<0.05. T = Tumours, S = Stroma. Image collected and cropped by CiteAb from the following open publication (https://pubmed.ncbi.nlm.nih.gov/25157856), licensed under a CC-BY license. Not internally tested by R&D Systems.
Detection of Mouse uPAR by Western Blot
TGF-beta 1 reduces uPAR cleavage through induced PAI-1 expression. a, f-h. Western blot analysis of whole cell lysates of cultured and stimulated AT84-uPAR cells. Where indicated, cell lysates were either treated with PNGase F (+) or samples received the same treatment except that PNGase F was omitted (−). Glycosylated uPAR is indicated as uPARglc. d-e. Western blot analysis of conditioned medium from equally seeded amounts of AT84-EV and AT84-uPAR cells. a. Cells cultured in FBSM with or without 2 ng/ml active human TGF-beta 1 for 24 h. b-c. Total RNA from treated (TGF-beta 1) or untreated (Ctrl) cells was isolated and the relative expression of uPAR mRNA (B) or uPA mRNA (C) was analysed using RT-qPCR. The error bars show the +SD. N = 3. d. Cells cultured in SFM or FBSM and stimulated with 2 ng/ml TGF-beta 1 for 24 h as indicated and PAI-1 protein levels were analysed. Controls received either no additives (−) or the TGF-beta 1 buffer (0). Positive control: recombinant mouse PAI-1 (rmPAI-1). e. AT84-uPAR cells cultured in either SFM or in FBSM. Cells were either unstimulated (−) or stimulated (+) with 2 ng/ml TGF-beta 1 and/or 10 μM of the TGF-beta 1-inhibitor SB431542 as indicated. f. AT84-uPAR cells were cultured for 24 h in FBSM and stimulated with 2 ng/ml TGF-beta 1 as indicated. g. Deglycosylated whole cell lysates from AT84-uPAR cells cultured in SFM stimulated with 2 ng/ml TGF-beta 1 +/− the inhibitor SB431542 as indicated were analysed for uPAR protein levels. h. Cells were cultured for 24- or 48 h in SFM, FBSM or TMEM. Cells were treated with 2 ng/ml TGF-beta 1 in 10% FBS as indicated. The LRP1 protein is indicated. Arrowhead shows an unknown band. Image collected and cropped by CiteAb from the following open publication (https://bmccancer.biomedcentral.com/articles/10.1186/s12885-017-3349-7), licensed under a CC-BY license. Not internally tested by R&D Systems.
Detection of Mouse uPAR by Immunohistochemistry
Tumour microenvironment induced uPAR protein expression in tongue tumours.Tumour growth pattern and uPAR protein levels in tongue tumours generated from the EV1, EV2, uPAR1 and uPAR2 cells. A–B: Representative images depicting the tumour growth pattern at the tumour-stroma interface in hematoxylin/eosin stained EV1 (A) and uPAR1 (B) tumours. Images were recorded at 10x magnification. C–D: Representative images depicting the IHC uPAR staining of the EV1 (C) or uPAR1 tumours (D). Images were recorded at 4x magnification. E–H: The images show high power magnification (20x magnifications) of the EV1 (E), uPAR1 (F), EV2 (G) and uPAR2 (H) tumours IHC stained for uPAR protein. Positive uPAR staining is seen as brown colour, and counterstaining was done with haematoxylin. I: The average staining index (SI) of the uPAR staining in the tumours. Maximum obtainable score is 9. The error bars shows the +SEM. N = number of tumours; EV1, N = 8/10; EV2, N = 5/10; uPAR1, N = 4/10; uPAR2 N = 9/10. One-way ANOVA; **p<0.01, *p<0.05. T = Tumours, S = Stroma. Image collected and cropped by CiteAb from the following open publication (https://pubmed.ncbi.nlm.nih.gov/25157856), licensed under a CC-BY license. Not internally tested by R&D Systems.
Detection of Mouse uPAR by Western Blot
Leiomyoma conditioned medium induced uPAR expression.Analysis of uPAR expression induced by the LCM or purified ECM proteins in cultured uPAR knock-down cells. All Western blots were performed on whole cell lysates, and uPAR was detected using the polyclonal anti-murine uPAR antibody (AF534). A: Cells were either cultured in LCM (LM) or serum free medium (SF) for 24 hours. Cells were harvested with sample buffer and re-probing for beta -actin was used as a loading control. B: uPAR1-NT cells were seeded on different ECM protein substrates, incubated for 24 hours and harvested using RIPA buffer. 7.5 µg of total protein was loaded per lane. Equal loading was verified by re-probing for beta -actin. The poloxamer pluronic was used as a no-adhesion control. Col I = Collagen I, Vn = Vitronectin, Fn = Fibronectin, Lm = Laminin, ECL = Entactin, Collagen, Laminin, and FBS = Foetal Bovine Serum. C: Cells cultured in LCM (LM) or serum free medium (SF) for 24 hours were harvested using sample buffer and deglycosylated by PNGase F treatment (+) as indicated. Re-probing for beta -actin was used as a loading control. The three bands detected by the anti-uPAR antibody are labelled 1, 2, and 3, respectively. Image collected and cropped by CiteAb from the following open publication (https://pubmed.ncbi.nlm.nih.gov/25157856), licensed under a CC-BY license. Not internally tested by R&D Systems.
Detection of Mouse uPAR by Western Blot
Expression of murine Plaur in AT84 cells.In vitro characterization of AT84 cells stably transfected with either empty vector (EV) or a vector containing cDNA encoding murine uPAR (Plaur). A: Western blot analysis of whole cell lysates using a polyclonal anti-murine uPAR antibody (AF534). A total of 7.5 ng of recombinant murine uPAR (rmuPAR) was loaded as a positive control. Re-probing for beta -actin was used as a loading control. B: Western blot analysis of cellular membrane fractions using a polyclonal anti-murine uPAR antibody (AF534). Total protein was measured per sample and 53.5 µg of protein was loaded per lane. A and B: Images were cropped, as no additional bands were detectable. C: FACS analysis of non-permeabilized cells using a polyclonal anti-murine uPAR antibody (AF534). Alexa Fluor 488 anti-goat secondary antibody (A11055) was used as the secondary antibody. The quantified mean Alexa 488 fluorescence signal per cell line is presented in the panel to the right. D and E: Relative Plaur mRNA (uPAR) (D) or Plau mRNA (uPA) (E) expression levels as analysed using RT-qPCR. All expression levels were normalized to the expression of the reference genes Trfc and beta -actin. Error bars represent the standard error of mean (+SEM) and N = 3. One-way ANOVA; *p<0.05. F: Plasminogen-gelatin (upper panel) and gelatin (lower panel) zymography analysis of conditioned medium of cells cultured for 24 hours in SFM. HMW-uPA and mPLM (mouse plasmin) were loaded as positive controls. The images were cropped to size. G: Relative Plasminogen mRNA (Plg) expression levels as analysed using RT-qPCR. Error bars represent standard error of mean (+SEM) and N = 3. Image collected and cropped by CiteAb from the following open publication (https://pubmed.ncbi.nlm.nih.gov/25157856), licensed under a CC-BY license. Not internally tested by R&D Systems.
Detection of Mouse uPAR by Immunohistochemistry
Tumour microenvironment induced uPAR protein expression in tongue tumours.Tumour growth pattern and uPAR protein levels in tongue tumours generated from the EV1, EV2, uPAR1 and uPAR2 cells. A–B: Representative images depicting the tumour growth pattern at the tumour-stroma interface in hematoxylin/eosin stained EV1 (A) and uPAR1 (B) tumours. Images were recorded at 10x magnification. C–D: Representative images depicting the IHC uPAR staining of the EV1 (C) or uPAR1 tumours (D). Images were recorded at 4x magnification. E–H: The images show high power magnification (20x magnifications) of the EV1 (E), uPAR1 (F), EV2 (G) and uPAR2 (H) tumours IHC stained for uPAR protein. Positive uPAR staining is seen as brown colour, and counterstaining was done with haematoxylin. I: The average staining index (SI) of the uPAR staining in the tumours. Maximum obtainable score is 9. The error bars shows the +SEM. N = number of tumours; EV1, N = 8/10; EV2, N = 5/10; uPAR1, N = 4/10; uPAR2 N = 9/10. One-way ANOVA; **p<0.01, *p<0.05. T = Tumours, S = Stroma. Image collected and cropped by CiteAb from the following open publication (https://pubmed.ncbi.nlm.nih.gov/25157856), licensed under a CC-BY license. Not internally tested by R&D Systems.
Detection of Mouse uPAR by Western Blot
Soluble uPAR shed from mouse OSCC cells induce migration. a-b. Western blot analysis of uPAR protein levels in concentrated conditioned medium from AT84-EV and AT84-uPAR cells. a. Conditioned medium from cells cultured in SFM or SFM containing 10 nM plasminogen (plg) as indicated. The conditioned medium was concentrated from 2 ml to 110 μl for both samples, and deglycosylated using PNGase F. b. Conditioned medium from cells cultured in SFM or in FBSM was concentrated from 2 ml to 350 μl for each sample. A whole cell lysate sample of AT84-uPAR cells was used as a positive control. The two indicated FBSM samples are replicates. Glycosylated suPAR is indicated as suPARglc. c. Non-concentrated conditioned medium from AT84-EV (EV medium) and AT84-uPAR cells (uPAR-medium) was used as an attractant for the AT84-EV cells in a real-time cell migration analysis using the xCELLigence system. N = 3, where each experiment had two technical replicates, and the error bars represent the standard error of mean (±SEM) based on three separate experiments. Image collected and cropped by CiteAb from the following open publication (https://bmccancer.biomedcentral.com/articles/10.1186/s12885-017-3349-7), licensed under a CC-BY license. Not internally tested by R&D Systems.
Detection of Mouse uPAR by Immunohistochemistry
In vivo tongue tumours of EV1 and uPAR1 knock-down cells.IHC uPAR staining and growth pattern of tongue tumours generated from the EV1 and uPAR1 cells containing either shRNA targeting uPAR (EV1-sh and uPAR1-sh), or non-targeting shRNA (uPAR1-NT). A–C: IHC uPAR staining of EV1-sh (A), uPAR1-NT (B) and uPAR1-sh (C) tumours, respectively. Images were recorded at 20x magnifications. D: Representative image depicting the tumour growth pattern at the tumour-stroma interface in hematoxylin/eosin stained EV1-sh. E: The average SI of the uPAR staining in the tumours, with the maximum obtainable score of 9. The error bars shows the +SEM. N = number of tumours; EV1, N = 8/10; EV1-sh, N = 11/16; uPAR1, N = 4/10; uPAR1-NT, N = 3/8; uPAR1-sh, N = 4/16. One-way ANOVA; **p<0.01, *p<0.05. T = Tumour, S = Stroma. Image collected and cropped by CiteAb from the following open publication (https://pubmed.ncbi.nlm.nih.gov/25157856), licensed under a CC-BY license. Not internally tested by R&D Systems.
Detection of Mouse uPAR by Western Blot
Knock-down of uPAR expression in AT84 cells.shRNA knock-down of Plaur in AT84 cells. A: Flow chart showing the generation of the single cell clones. B: Western blot analysis of whole cell lysates from the single cell clones stably transfected with either shRNA-constructs (shRNA 3 = sh3, shRNA 4 = sh4 or shRNA 5 = sh5) targeting Plaur or constructs containing non-target shRNA (NT) or the empty vector (EV). uPAR was detected using a polyclonal anti-murine uPAR antibody (AF534). Re-probing for beta -actin was used as a loading control. Images were cropped, as no additional bands were detected in the blot. Image collected and cropped by CiteAb from the following open publication (https://pubmed.ncbi.nlm.nih.gov/25157856), licensed under a CC-BY license. Not internally tested by R&D Systems.
Detection of Mouse uPAR by Western Blot
TGF-beta 1 reduces uPAR cleavage through induced PAI-1 expression. a, f-h. Western blot analysis of whole cell lysates of cultured and stimulated AT84-uPAR cells. Where indicated, cell lysates were either treated with PNGase F (+) or samples received the same treatment except that PNGase F was omitted (−). Glycosylated uPAR is indicated as uPARglc. d-e. Western blot analysis of conditioned medium from equally seeded amounts of AT84-EV and AT84-uPAR cells. a. Cells cultured in FBSM with or without 2 ng/ml active human TGF-beta 1 for 24 h. b-c. Total RNA from treated (TGF-beta 1) or untreated (Ctrl) cells was isolated and the relative expression of uPAR mRNA (B) or uPA mRNA (C) was analysed using RT-qPCR. The error bars show the +SD. N = 3. d. Cells cultured in SFM or FBSM and stimulated with 2 ng/ml TGF-beta 1 for 24 h as indicated and PAI-1 protein levels were analysed. Controls received either no additives (−) or the TGF-beta 1 buffer (0). Positive control: recombinant mouse PAI-1 (rmPAI-1). e. AT84-uPAR cells cultured in either SFM or in FBSM. Cells were either unstimulated (−) or stimulated (+) with 2 ng/ml TGF-beta 1 and/or 10 μM of the TGF-beta 1-inhibitor SB431542 as indicated. f. AT84-uPAR cells were cultured for 24 h in FBSM and stimulated with 2 ng/ml TGF-beta 1 as indicated. g. Deglycosylated whole cell lysates from AT84-uPAR cells cultured in SFM stimulated with 2 ng/ml TGF-beta 1 +/− the inhibitor SB431542 as indicated were analysed for uPAR protein levels. h. Cells were cultured for 24- or 48 h in SFM, FBSM or TMEM. Cells were treated with 2 ng/ml TGF-beta 1 in 10% FBS as indicated. The LRP1 protein is indicated. Arrowhead shows an unknown band. Image collected and cropped by CiteAb from the following open publication (https://bmccancer.biomedcentral.com/articles/10.1186/s12885-017-3349-7), licensed under a CC-BY license. Not internally tested by R&D Systems.
Detection of Mouse uPAR by Western Blot
Soluble uPAR shed from mouse OSCC cells induce migration. a-b. Western blot analysis of uPAR protein levels in concentrated conditioned medium from AT84-EV and AT84-uPAR cells. a. Conditioned medium from cells cultured in SFM or SFM containing 10 nM plasminogen (plg) as indicated. The conditioned medium was concentrated from 2 ml to 110 μl for both samples, and deglycosylated using PNGase F. b. Conditioned medium from cells cultured in SFM or in FBSM was concentrated from 2 ml to 350 μl for each sample. A whole cell lysate sample of AT84-uPAR cells was used as a positive control. The two indicated FBSM samples are replicates. Glycosylated suPAR is indicated as suPARglc. c. Non-concentrated conditioned medium from AT84-EV (EV medium) and AT84-uPAR cells (uPAR-medium) was used as an attractant for the AT84-EV cells in a real-time cell migration analysis using the xCELLigence system. N = 3, where each experiment had two technical replicates, and the error bars represent the standard error of mean (±SEM) based on three separate experiments. Image collected and cropped by CiteAb from the following open publication (https://bmccancer.biomedcentral.com/articles/10.1186/s12885-017-3349-7), licensed under a CC-BY license. Not internally tested by R&D Systems.
Detection of Mouse uPAR by Western Blot
Expression of murine Plaur in AT84 cells.In vitro characterization of AT84 cells stably transfected with either empty vector (EV) or a vector containing cDNA encoding murine uPAR (Plaur). A: Western blot analysis of whole cell lysates using a polyclonal anti-murine uPAR antibody (AF534). A total of 7.5 ng of recombinant murine uPAR (rmuPAR) was loaded as a positive control. Re-probing for beta -actin was used as a loading control. B: Western blot analysis of cellular membrane fractions using a polyclonal anti-murine uPAR antibody (AF534). Total protein was measured per sample and 53.5 µg of protein was loaded per lane. A and B: Images were cropped, as no additional bands were detectable. C: FACS analysis of non-permeabilized cells using a polyclonal anti-murine uPAR antibody (AF534). Alexa Fluor 488 anti-goat secondary antibody (A11055) was used as the secondary antibody. The quantified mean Alexa 488 fluorescence signal per cell line is presented in the panel to the right. D and E: Relative Plaur mRNA (uPAR) (D) or Plau mRNA (uPA) (E) expression levels as analysed using RT-qPCR. All expression levels were normalized to the expression of the reference genes Trfc and beta -actin. Error bars represent the standard error of mean (+SEM) and N = 3. One-way ANOVA; *p<0.05. F: Plasminogen-gelatin (upper panel) and gelatin (lower panel) zymography analysis of conditioned medium of cells cultured for 24 hours in SFM. HMW-uPA and mPLM (mouse plasmin) were loaded as positive controls. The images were cropped to size. G: Relative Plasminogen mRNA (Plg) expression levels as analysed using RT-qPCR. Error bars represent standard error of mean (+SEM) and N = 3. Image collected and cropped by CiteAb from the following open publication (https://pubmed.ncbi.nlm.nih.gov/25157856), licensed under a CC-BY license. Not internally tested by R&D Systems.
Detection of Mouse uPAR by Western Blot
Leiomyoma conditioned medium induced uPAR expression.Analysis of uPAR expression induced by the LCM or purified ECM proteins in cultured uPAR knock-down cells. All Western blots were performed on whole cell lysates, and uPAR was detected using the polyclonal anti-murine uPAR antibody (AF534). A: Cells were either cultured in LCM (LM) or serum free medium (SF) for 24 hours. Cells were harvested with sample buffer and re-probing for beta -actin was used as a loading control. B: uPAR1-NT cells were seeded on different ECM protein substrates, incubated for 24 hours and harvested using RIPA buffer. 7.5 µg of total protein was loaded per lane. Equal loading was verified by re-probing for beta -actin. The poloxamer pluronic was used as a no-adhesion control. Col I = Collagen I, Vn = Vitronectin, Fn = Fibronectin, Lm = Laminin, ECL = Entactin, Collagen, Laminin, and FBS = Foetal Bovine Serum. C: Cells cultured in LCM (LM) or serum free medium (SF) for 24 hours were harvested using sample buffer and deglycosylated by PNGase F treatment (+) as indicated. Re-probing for beta -actin was used as a loading control. The three bands detected by the anti-uPAR antibody are labelled 1, 2, and 3, respectively. Image collected and cropped by CiteAb from the following open publication (https://pubmed.ncbi.nlm.nih.gov/25157856), licensed under a CC-BY license. Not internally tested by R&D Systems.
Detection of Mouse uPAR by Immunohistochemistry
In vivo tongue tumours of EV1 and uPAR1 knock-down cells.IHC uPAR staining and growth pattern of tongue tumours generated from the EV1 and uPAR1 cells containing either shRNA targeting uPAR (EV1-sh and uPAR1-sh), or non-targeting shRNA (uPAR1-NT). A–C: IHC uPAR staining of EV1-sh (A), uPAR1-NT (B) and uPAR1-sh (C) tumours, respectively. Images were recorded at 20x magnifications. D: Representative image depicting the tumour growth pattern at the tumour-stroma interface in hematoxylin/eosin stained EV1-sh. E: The average SI of the uPAR staining in the tumours, with the maximum obtainable score of 9. The error bars shows the +SEM. N = number of tumours; EV1, N = 8/10; EV1-sh, N = 11/16; uPAR1, N = 4/10; uPAR1-NT, N = 3/8; uPAR1-sh, N = 4/16. One-way ANOVA; **p<0.01, *p<0.05. T = Tumour, S = Stroma. Image collected and cropped by CiteAb from the following open publication (https://pubmed.ncbi.nlm.nih.gov/25157856), licensed under a CC-BY license. Not internally tested by R&D Systems.
Detection of Mouse uPAR by Western Blot
Expression of murine Plaur in AT84 cells.In vitro characterization of AT84 cells stably transfected with either empty vector (EV) or a vector containing cDNA encoding murine uPAR (Plaur). A: Western blot analysis of whole cell lysates using a polyclonal anti-murine uPAR antibody (AF534). A total of 7.5 ng of recombinant murine uPAR (rmuPAR) was loaded as a positive control. Re-probing for beta -actin was used as a loading control. B: Western blot analysis of cellular membrane fractions using a polyclonal anti-murine uPAR antibody (AF534). Total protein was measured per sample and 53.5 µg of protein was loaded per lane. A and B: Images were cropped, as no additional bands were detectable. C: FACS analysis of non-permeabilized cells using a polyclonal anti-murine uPAR antibody (AF534). Alexa Fluor 488 anti-goat secondary antibody (A11055) was used as the secondary antibody. The quantified mean Alexa 488 fluorescence signal per cell line is presented in the panel to the right. D and E: Relative Plaur mRNA (uPAR) (D) or Plau mRNA (uPA) (E) expression levels as analysed using RT-qPCR. All expression levels were normalized to the expression of the reference genes Trfc and beta -actin. Error bars represent the standard error of mean (+SEM) and N = 3. One-way ANOVA; *p<0.05. F: Plasminogen-gelatin (upper panel) and gelatin (lower panel) zymography analysis of conditioned medium of cells cultured for 24 hours in SFM. HMW-uPA and mPLM (mouse plasmin) were loaded as positive controls. The images were cropped to size. G: Relative Plasminogen mRNA (Plg) expression levels as analysed using RT-qPCR. Error bars represent standard error of mean (+SEM) and N = 3. Image collected and cropped by CiteAb from the following open publication (https://pubmed.ncbi.nlm.nih.gov/25157856), licensed under a CC-BY license. Not internally tested by R&D Systems.
Detection of Mouse Mouse uPAR Antibody by Western Blot
Soluble uPAR shed from mouse OSCC cells induce migration. a-b. Western blot analysis of uPAR protein levels in concentrated conditioned medium from AT84-EV and AT84-uPAR cells. a. Conditioned medium from cells cultured in SFM or SFM containing 10 nM plasminogen (plg) as indicated. The conditioned medium was concentrated from 2 ml to 110 μl for both samples, and deglycosylated using PNGase F. b. Conditioned medium from cells cultured in SFM or in FBSM was concentrated from 2 ml to 350 μl for each sample. A whole cell lysate sample of AT84-uPAR cells was used as a positive control. The two indicated FBSM samples are replicates. Glycosylated suPAR is indicated as suPARglc. c. Non-concentrated conditioned medium from AT84-EV (EV medium) and AT84-uPAR cells (uPAR-medium) was used as an attractant for the AT84-EV cells in a real-time cell migration analysis using the xCELLigence system. N = 3, where each experiment had two technical replicates, and the error bars represent the standard error of mean (±SEM) based on three separate experiments Image collected and cropped by CiteAb from the following publication (https://pubmed.ncbi.nlm.nih.gov/28526008), licensed under a CC-BY license. Not internally tested by R&D Systems.Applications for Mouse uPAR Antibody
Application
Recommended Usage
Blockade of Receptor-ligand Interaction
In a functional ELISA, 0.8-4 µg/mL of this antibody will block 50% of the binding of 50 ng/mL of Recombinant Human u-Plasminogen Activator/Urokinase (Catalog # 1310-SE) to immobilized Recombinant Mouse uPAR Fc Chimera (Catalog # 531-PA) coated at 5 µg/mL (100 µL/well). At 25 μg/mL, this antibody will block >90% of the binding.
CyTOF-ready
Ready to be labeled using established conjugation methods. No BSA or other carrier proteins that could interfere with conjugation.
Flow Cytometry
0.25 µg/106 cells
Sample: RAW 264.7 mouse monocyte/macrophage cell line
Sample: RAW 264.7 mouse monocyte/macrophage cell line
Immunohistochemistry
5-15 µg/mL
Sample: Perfusion fixed frozen sections of mouse kidney
Sample: Perfusion fixed frozen sections of mouse kidney
Western Blot
0.1 µg/mL
Sample: Recombinant Mouse uPAR Fc Chimera (Catalog # 531-PA)
Sample: Recombinant Mouse uPAR Fc Chimera (Catalog # 531-PA)
Reviewed Applications
Read 1 review rated 5 using AF534 in the following applications:
Flow Cytometry Panel Builder
Bio-Techne Knows Flow Cytometry
Save time and reduce costly mistakes by quickly finding compatible reagents using the Panel Builder Tool.
Advanced Features
- Spectra Viewer - Custom analysis of spectra from multiple fluorochromes
- Spillover Popups - Visualize the spectra of individual fluorochromes
- Antigen Density Selector - Match fluorochrome brightness with antigen density

Formulation, Preparation, and Storage
Purification
Antigen Affinity-purified
Reconstitution
Reconstitute at 0.2 mg/mL in sterile PBS. For liquid material, refer to CoA for concentration.
Loading...
Formulation
Lyophilized from a 0.2 μm filtered solution in PBS with Trehalose. *Small pack size (SP) is supplied either lyophilized or as a 0.2 µm filtered solution in PBS.
Shipping
Lyophilized product is shipped at ambient temperature. Liquid small pack size (-SP) is shipped with polar packs. Upon receipt, store immediately at the temperature recommended below.
Stability & Storage
Use a manual defrost freezer and avoid repeated freeze-thaw cycles.
- 12 months from date of receipt, -20 to -70 °C as supplied.
- 1 month, 2 to 8 °C under sterile conditions after reconstitution.
- 6 months, -20 to -70 °C under sterile conditions after reconstitution.
Calculators
Background: uPAR
References
- Dear, A.E. and R.L. Medcalf (1998) Eur. J. Biochemistry 252:185.
Long Name
Urokinase-type Plasminogen Activator Receptor
Alternate Names
PLAUR
Gene Symbol
PLAUR
UniProt
Additional uPAR Products
Product Documents for Mouse uPAR Antibody
Certificate of Analysis
To download a Certificate of Analysis, please enter a lot or batch number in the search box below.
Note: Certificate of Analysis not available for kit components.
Product Specific Notices for Mouse uPAR Antibody
For research use only
Citations for Mouse uPAR Antibody
 Powered by Bioz
Customer Reviews for Mouse uPAR Antibody (1)
5 out of 5
1 Customer Rating
Have you used Mouse uPAR Antibody?
Submit a review and receive an Amazon gift card!
$25/€18/£15/$25CAN/¥2500 Yen for a review with an image
$10/€7/£6/$10CAN/¥1110 Yen for a review without an image
Submit a review
Customer Images
Showing
1
-
1 的
1 review
Showing All
Filter By:
-
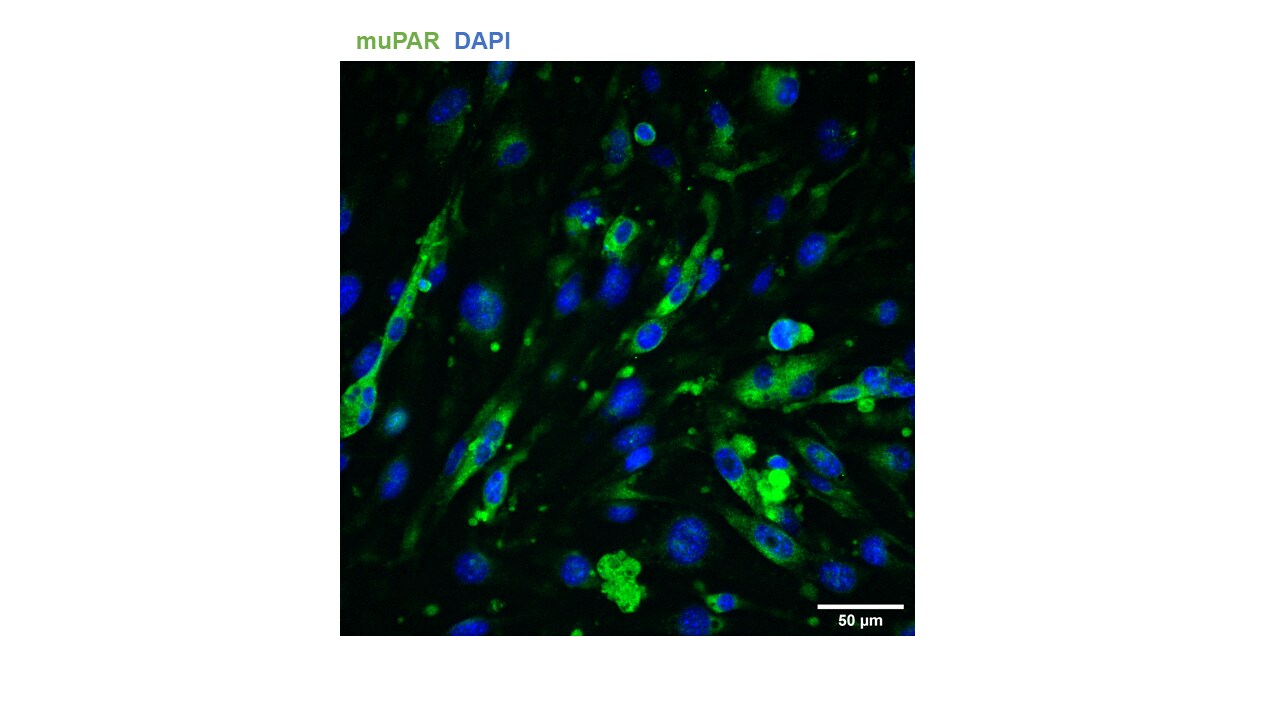
Application: Immunocytochemistry/ImmunofluorescenceSample Tested: bEnd.3 mouse endothelioma cell lineSpecies: MouseVerified Customer | Posted 01/13/2022No permeabilization with triton X-100 1% BSA, 30 min, RT Primary Ab: 1 ug/mL, 1h, RT Secondary Ab: AlexaFluor 448 donkey anti-goat IgG (H+L), 1:800, 30 min, RT

There are no reviews that match your criteria.
Protocols
Find general support by application which include: protocols, troubleshooting, illustrated assays, videos and webinars.
- 7-Amino Actinomycin D (7-AAD) Cell Viability Flow Cytometry Protocol
- Antigen Retrieval Protocol (PIER)
- Antigen Retrieval for Frozen Sections Protocol
- Appropriate Fixation of IHC/ICC Samples
- Cellular Response to Hypoxia Protocols
- Chromogenic IHC Staining of Formalin-Fixed Paraffin-Embedded (FFPE) Tissue Protocol
- Chromogenic Immunohistochemistry Staining of Frozen Tissue
- ClariTSA™ Fluorophore Kits
- Detection & Visualization of Antibody Binding
- Extracellular Membrane Flow Cytometry Protocol
- Flow Cytometry Protocol for Cell Surface Markers
- Flow Cytometry Protocol for Staining Membrane Associated Proteins
- Flow Cytometry Staining Protocols
- Flow Cytometry Troubleshooting Guide
- Fluorescent IHC Staining of Frozen Tissue Protocol
- Graphic Protocol for Heat-induced Epitope Retrieval
- Graphic Protocol for the Preparation and Fluorescent IHC Staining of Frozen Tissue Sections
- Graphic Protocol for the Preparation and Fluorescent IHC Staining of Paraffin-embedded Tissue Sections
- Graphic Protocol for the Preparation of Gelatin-coated Slides for Histological Tissue Sections
- IHC Sample Preparation (Frozen sections vs Paraffin)
- Immunofluorescent IHC Staining of Formalin-Fixed Paraffin-Embedded (FFPE) Tissue Protocol
- Immunohistochemistry (IHC) and Immunocytochemistry (ICC) Protocols
- Immunohistochemistry Frozen Troubleshooting
- Immunohistochemistry Paraffin Troubleshooting
- Intracellular Flow Cytometry Protocol Using Alcohol (Methanol)
- Intracellular Flow Cytometry Protocol Using Detergents
- Intracellular Nuclear Staining Flow Cytometry Protocol Using Detergents
- Intracellular Staining Flow Cytometry Protocol Using Alcohol Permeabilization
- Intracellular Staining Flow Cytometry Protocol Using Detergents to Permeabilize Cells
- Preparing Samples for IHC/ICC Experiments
- Preventing Non-Specific Staining (Non-Specific Binding)
- Primary Antibody Selection & Optimization
- Propidium Iodide Cell Viability Flow Cytometry Protocol
- Protocol for Heat-Induced Epitope Retrieval (HIER)
- Protocol for Liperfluo
- Protocol for Making a 4% Formaldehyde Solution in PBS
- Protocol for VisUCyte™ HRP Polymer Detection Reagent
- Protocol for the Characterization of Human Th22 Cells
- Protocol for the Characterization of Human Th9 Cells
- Protocol for the Preparation & Fixation of Cells on Coverslips
- Protocol for the Preparation and Chromogenic IHC Staining of Frozen Tissue Sections
- Protocol for the Preparation and Chromogenic IHC Staining of Frozen Tissue Sections - Graphic
- Protocol for the Preparation and Chromogenic IHC Staining of Paraffin-embedded Tissue Sections
- Protocol for the Preparation and Chromogenic IHC Staining of Paraffin-embedded Tissue Sections - Graphic
- Protocol for the Preparation and Fluorescent IHC Staining of Frozen Tissue Sections
- Protocol for the Preparation and Fluorescent IHC Staining of Paraffin-embedded Tissue Sections
- Protocol for the Preparation of Gelatin-coated Slides for Histological Tissue Sections
- Protocol: Annexin V and PI Staining by Flow Cytometry
- Protocol: Annexin V and PI Staining for Apoptosis by Flow Cytometry
- R&D Systems Quality Control Western Blot Protocol
- TUNEL and Active Caspase-3 Detection by IHC/ICC Protocol
- The Importance of IHC/ICC Controls
- Troubleshooting Guide: Fluorokine Flow Cytometry Kits
- Troubleshooting Guide: Immunohistochemistry
- Troubleshooting Guide: Western Blot Figures
- Western Blot Conditions
- Western Blot Protocol
- Western Blot Protocol for Cell Lysates
- Western Blot Troubleshooting
- Western Blot Troubleshooting Guide
- View all Protocols, Troubleshooting, Illustrated assays and Webinars
Loading...