ATG5 Antibody - BSA Free
Novus Biologicals | Catalog # NB110-53818
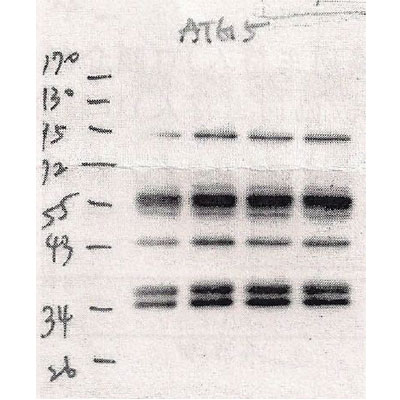
![Western Blot: ATG5 AntibodyBSA Free [NB110-53818]](https://resources.rndsystems.com/images/products/ATG5-Antibody---BSA-Free-Western-Blot-NB110-53818-img0021.jpg "Western Blot: ATG5 AntibodyBSA Free [NB110-53818]")
Key Product Details
Validated by
Knockout/Knockdown, Biological Validation
Species Reactivity
Validated:
Human, Mouse, Rat, Porcine, Alligator, Bovine, Drosophila, Fish, Guinea Pig, Primate, Xenopus, Zebrafish
Cited:
Human, Mouse, Rat, Porcine, Alligator, Bovine, Drosophilia, Fish - Danio rerio (Zebrafish), Guinea Pig, Insect - Drosophila, Primate
Applications
Validated:
Knockout Validated, Immunohistochemistry, Immunohistochemistry-Paraffin, Western Blot, Immunoblotting, ELISA, Flow Cytometry, Immunocytochemistry/ Immunofluorescence, Simple Western, Immunoprecipitation, Radioimmunoassay, Proximity Ligation Assay, Electron Microscopy, Knockdown Validated
Cited:
Knockout Validated, Immunohistochemistry-Paraffin, Immunohistochemistry-Frozen, Western Blot, ELISA, Flow Cytometry, Immunocytochemistry/ Immunofluorescence, Simple Western, Immunoprecipitation, Radioimmunoassay, Proximity Ligation Assay, IF/IHC, Electron Microscopy
Label
Unconjugated
Antibody Source
Polyclonal Rabbit IgG
Format
BSA Free
Loading...
Product Specifications
Immunogen
This ATG5 Antibody was made to a synthetic peptide of an N-terminal region of the human ATG5 protein (within residues 1-50) [Swiss-Prot Q9H1Y0].
Reactivity Notes
Drosophila reactivity reported in scientific literature (PMID:33221768) Fish reactivity reported in scientific literature (PMID: 26183773). Guinea Pig reactivity reported in scientific literature (PMID: 30766882). Use in Alligator reported in scientific literature (PMID:32061056).
Localization
Cytoplasm. Co-localizes with non-muscle actin.
Specificity
This is selective for the full-length and calpain cleaved isoform proteins. The short isoform is missing amino acids 1-79. The calpain cleaved form of ATG5 is missing amino acids 195-275.
Clonality
Polyclonal
Host
Rabbit
Isotype
IgG
Theoretical MW
32 kDa.
Disclaimer note: The observed molecular weight of the protein may vary from the listed predicted molecular weight due to post translational modifications, post translation cleavages, relative charges, and other experimental factors.
Disclaimer note: The observed molecular weight of the protein may vary from the listed predicted molecular weight due to post translational modifications, post translation cleavages, relative charges, and other experimental factors.
Scientific Data Images for ATG5 Antibody - BSA Free
Western Blot: ATG5 AntibodyBSA Free [NB110-53818]
ATG5-Antibody---BSA-Free-Western-Blot-NB110-53818-img0021.jpg![Immunocytochemistry/ Immunofluorescence: ATG5 Antibody - BSA Free [NB110-53818]](https://resources.rndsystems.com/images/products/ATG5-Antibody---BSA-Free-Immunocytochemistry-Immunofluorescence-NB110-53818-img0020.jpg "Immunocytochemistry/ Immunofluorescence: ATG5 Antibody - BSA Free [NB110-53818]")
![Immunohistochemistry: ATG5 Antibody - BSA Free [NB110-53818]](https://resources.rndsystems.com/images/products/ATG5-Antibody---BSA-Free-Immunohistochemistry-NB110-53818-img0010.jpg "Immunohistochemistry: ATG5 Antibody - BSA Free [NB110-53818]")
Immunohistochemistry: ATG5 Antibody - BSA Free [NB110-53818]
Immunohistochemistry: ATG5 Antibody - BSA Free [NB110-53818] - Immunohistochemistry analysis of human liver hepatocytes at 2.5 ug/mL. 40X magnification.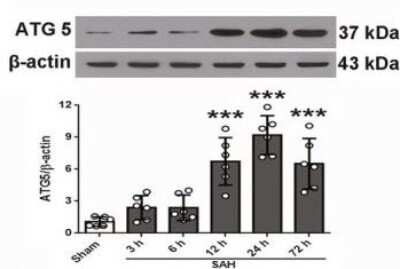
ATG5 Antibody - BSA Free-Western Blot-NB110-53818-img0023.jpg
![Western Blot: ATG5 AntibodyBSA Free [NB110-53818]](https://resources.rndsystems.com/images/products/ATG5-Antibody---BSA-Free-Western-Blot-NB110-53818-img0009.jpg "Western Blot: ATG5 AntibodyBSA Free [NB110-53818]")
Western Blot: ATG5 AntibodyBSA Free [NB110-53818]
Western Blot: ATG5 Antibody - BSA Free [NB110-53818] - Western blot analysis in mouse wildtype ES cell lysate (Lane 1) using NB110-53818. Lane 2 is a mouse ATG5 KO ES cell lysate (negative control). Atg5-/- ES cells from Dr. Noboru Mizushima [Mizushima, N. et al. J. Cell Biol. 152 (2001)] Photo courtesy of Dr. Beth Levine, UT Southwestern Medical Center.![Western Blot: ATG5 AntibodyBSA Free [NB110-53818]](https://resources.rndsystems.com/images/products/ATG5-Antibody---BSA-Free-Western-Blot-NB110-53818-img0014.jpg "Western Blot: ATG5 AntibodyBSA Free [NB110-53818]")
Western Blot: ATG5 AntibodyBSA Free [NB110-53818]
Western Blot: ATG5 Antibody - BSA Free [NB110-53818] - Western blot analysis of total protein from Human HeLa and A431 and Mouse MEF cells. Lysates were separated on a 7.5% gel by SDS-PAGE, transferred to PVDF membrane and blocked in 5% non-fat milk in TBST. The membrane was probed with 2.0 ug/mL anti-ATG5 in 1% non-fat milk in TBST and detected with an anti-rabbit HRP secondary antibody using chemiluminescence.![Western Blot: ATG5 AntibodyBSA Free [NB110-53818]](https://resources.rndsystems.com/images/products/ATG5-Antibody---BSA-Free-Western-Blot-NB110-53818-img0017.jpg "Western Blot: ATG5 AntibodyBSA Free [NB110-53818]")
![Immunocytochemistry/ Immunofluorescence: ATG5 Antibody - BSA Free [NB110-53818]](https://resources.rndsystems.com/images/products/ATG5-Antibody---BSA-Free-Immunocytochemistry-Immunofluorescence-NB110-53818-img0004.jpg "Immunocytochemistry/ Immunofluorescence: ATG5 Antibody - BSA Free [NB110-53818]")
Immunocytochemistry/ Immunofluorescence: ATG5 Antibody - BSA Free [NB110-53818]
Immunocytochemistry/Immunofluorescence: ATG5 Antibody - BSA Free [NB110-53818] - ICC/IF analysis of SY5Y cells at 1:250. Incubated overnight at 4 degrees. Photo courtesy of an anonymous collaborator.![Immunohistochemistry: ATG5 Antibody - BSA Free [NB110-53818]](https://resources.rndsystems.com/images/products/ATG5-Antibody---BSA-Free-Immunohistochemistry-NB110-53818-img0011.jpg "Immunohistochemistry: ATG5 Antibody - BSA Free [NB110-53818]")
Immunohistochemistry: ATG5 Antibody - BSA Free [NB110-53818]
Immunohistochemistry: ATG5 Antibody - BSA Free [NB110-53818] - Immunohistochemistry analysis of mouse intestine using DAB with hematoxylin counterstain.![Immunohistochemistry-Paraffin: ATG5 Antibody - BSA Free [NB110-53818]](https://resources.rndsystems.com/images/products/ATG5-Antibody---BSA-Free-Immunohistochemistry-Paraffin-NB110-53818-img0012.jpg "Immunohistochemistry-Paraffin: ATG5 Antibody - BSA Free [NB110-53818]")
Immunohistochemistry-Paraffin: ATG5 Antibody - BSA Free [NB110-53818]
Immunohistochemistry-Paraffin: ATG5 Antibody - BSA Free [NB110-53818] - Immunohistochemistry analysis of mouse knee. IHC-P image submitted by a verified customer review.![Simple Western: ATG5 AntibodyBSA Free [NB110-53818]](https://resources.rndsystems.com/images/products/ATG5-Antibody---BSA-Free-Simple-Western-NB110-53818-img0013.jpg "Simple Western: ATG5 AntibodyBSA Free [NB110-53818]")
Simple Western: ATG5 AntibodyBSA Free [NB110-53818]
Simple Western: ATG5 Antibody - BSA Free [NB110-53818] - Simple Western lane view shows a specific band for ATG5 in 0.5 mg/mL of HeLa lysate. This experiment was performed under reducing conditions using the 12-230 kDa separation system.![Knockdown Validated: ATG5 Antibody - BSA Free [NB110-53818]](https://resources.rndsystems.com/images/products/ATG5-Antibody---BSA-Free-Knockdown-Validated-NB110-53818-img0022.jpg "Western Blot: ATG5 Antibody - BSA Free [NB110-53818]")
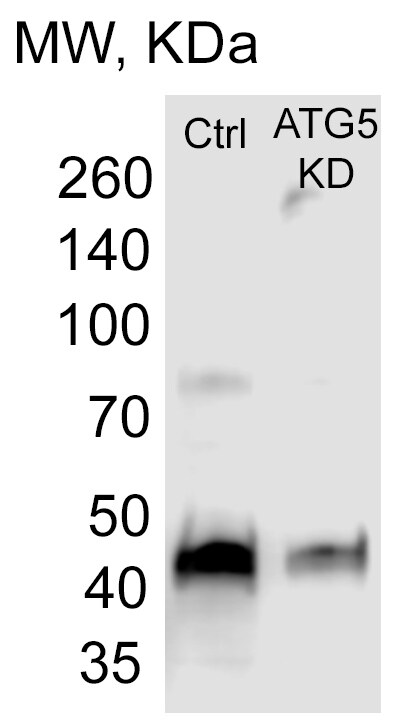
Western Blot: ATG5 Antibody - BSA Free [NB110-53818]
Western Blot: ATG5 Antibody - BSA Free [NB110-53818] - Knockdown of autophagy-related gene 5 (ATG5) inhibits trehalose-induced autophagy in normal human primary airway epithelial cells. Normal human tracheobronchial epithelial cells were transfected with Naito1 chimera RNAi (control siRNA) or ATG5 chimera siRNA (ATG5 siRNA). Twenty-four hours after siRNA transfection, cells were treated with medium or trehalose (TRE, 100 mM) for 48 h. ATG5 protein as examined by Western blot analysis with GAPDH protein used as loading control. The representative Western blot picture was shown from 2 independent experiments with each being performed in triplicate wells.
Western Blot: ATG5 Antibody - BSA Free [NB110-53818] -
Western Blot: ATG5 Antibody - BSA Free [NB110-53818] - Western Blot of the lysate of DU145 cells - control and ATG5 KD. Image from verified customer review.
Immunohistochemistry: ATG5 Antibody - BSA Free [NB110-53818] -
(A) ATG5 expression in ESCC tissue was analyzed by IHC and scored as 0, 1+, 2+, and 3+. (B) Expression level of ATG5 in adjacent non-cancerous (normal) and early-stage ESCC tissues by IHC. (C-D) Kaplan–Meier estimates of OS (C) and PFS (D) by the expression levels of ATG5 (low and high) of adjacent normal tissue from early-stage ESCC patients. MST: median survival time. Low, expression score 0 or 1+; High, expression score 2+ or 3+.
Simple Western: ATG5 Antibody - BSA Free [NB110-53818] -
Simple Western: ATG5 Antibody - BSA Free [NB110-53818] - Dose-responses of Mn on cell viability and autophagy flux. (A) Stable HeLa cells overexpressing mRFP-GFP-LC3, and immortalized rat dopaminergic neuronal cells N27 were exposed to MnCl2 (62.5 uM to 2mM) for 24h, or (B) 48h. Cell viability was evaluated using Calcein AM dye. Data represent mean +- SEM, n = 3 independent experiments with 4 replicates per experiment. (C) Schematic diagram illustrating the autophagy flux pathway and the construct used to create the mRFP-GFP-LC3 stable HeLa reporter cells. With this cell model, autophagosomes appear yellow due to the colocalization of RFP and GFP signals. Red signal indicates the flux is functional because the green signal is quenched by the acidic environment of the lysosomes, which fuse with autophagosomes. These stable cells were treated with vehicle control or Mn (15.6-250 uM) for 24h. (D) Representative images of cells treated with different doses of Mn were captured using confocal microscopy. (E) Green and red vesicles per cell were quantified using Fiji. Green vesicles represent autophagosomes. The number of autolysosomes was calculated by subtracting the number of green from the red puncta per cell. Scale bar = 20um. (F) Stable HeLa cells were treated with MnCl2 (125 uM), chloroquine (CQ) or both. (G) The number of autophagosomes and autolysosomes were quantified. The combination of Mn with CQ did not significantly alter the numbers of autophagosome (P = 0.9941) and autolysosome(P > 0.9999), as compared to CQ (50 uM) only, a dose that did not completely inhibit autophagy. Data represent mean +- SEM. (H) N27 cells were treated with 62.5 or 125 uM of MnCl2 for 24h, then incubated with LysoSensor Yellow/Blue. The ratio of acidic (yellow) vs. neutral (blue) pH of lysosomes were quantified using a plate reader. (I) N27 cells were treated with Mn 125 uM, CQ50 uM or both for 24h, followed by immunoblotting for Atg5, a marker for autophagosomes, using Jess (Protei
Western Blot: ATG5 Antibody - BSA Free [NB110-53818] -
ATG5 & ATG7 enhanced autophagy & inhibited ER stress in chondrocyte. a Western blotting analysis of LC3, P62, ATG5, ATG7 & ATG5-ATG12 expression after infected with Ad-ATG5, Ad-ATG7 & Ad-ATG5 + Ad-ATG7 in the C28I2 cells. beta -actin is served as an internal control. b Qualitative analysis of ATG5, ATG7, ATG5-ATG12, LC3 & P62. The values were normalized to beta -actin. c C28I2 cells were double stained with LC3 (red) & DAPI (blue) & visualized by confocal microscopy (400X) after treated with Rapamycine, Ad-ATG5, Ad-ATG7 & Ad-ATG5 + Ad-ATG7 24 h. *P < 0.05, **P < 0.01 compared with the controls. Values are means ± SD n = 3). d Qualitative analysis of LC3 fluorescence intensity of chondrocytes. The values were normalized to the NC group. e Western blotting analysis of PERK, p-PERK & Nrf2 expression after infected with Ad-ATG5, Ad-ATG7 & Ad-ATG5 + Ad-ATG7 in the C28I2 cells. beta -actin is served as an internal control. f Qualitative analysis of PERK, p-PERK & Nrf2 were normalized to beta -actin. (1:NC, 2:Ad-GFP, 3:Ad-ATG5, 4:RAPA, 5:Ad-ATG7, 6:Ad-ATG5 + RAPA, 7:Ad-ATG5 + Ad-ATG7). Rapamycin (25 μM) used as a positive control Image collected & cropped by CiteAb from the following publication (https://pubmed.ncbi.nlm.nih.gov/31060556), licensed under a CC-BY license. Not internally tested by Novus Biologicals.
Western Blot: ATG5 Antibody - BSA Free [NB110-53818] -
Western Blot: ATG5 Antibody - BSA Free [NB110-53818] - RIP2 is not essential for MAPK pathways in the early ontogenesis. (A) Immunoblot analysis of phospho-p44/42 MAPK, p44/42 MAPK, & p38 MAPK in larvae homogenate from WT & NOD1-1IS−/− zebrafish at 7 days post-fertilization (dpf). (B) Immunoblot analysis of phospho-p44/42 MAPK, p44/42 MAPK, & p38 MAPK in larvae homogenate from WT & RIP2−/− zebrafish at 7 dpf. (C) Immunoblot analysis of Atg5, p62, & LC3b in larvae homogenate from WT & NOD1-1IS−/− zebrafish at 7 dpf. (D) Immunoblot analysis of Atg5, p62, & LC3b in larvae homogenate from WT & RIP2−/− zebrafish at 7 dpf. Western blotting results were quantified using Quantity One software. Data represent the average of two independent experiments. *p < 0.05, **p < 0.01. Image collected & cropped by CiteAb from the following publication (https://pubmed.ncbi.nlm.nih.gov/29692779), licensed under a CC-BY license. Not internally tested by Novus Biologicals.
Western Blot: ATG5 Antibody - BSA Free [NB110-53818] -
Western Blot: ATG5 Antibody - BSA Free [NB110-53818] - Baclofen reversed the changes of protein markers characteristic for autophagy in hippocampal CA1 area under chronic cerebral hypoperfusion.(a–c) Five weeks after induction of hypoperfusion, p-mTOR was significantly decreased, & LC3-II, Beclin 1, atg5 & atg7 were significantly increased, & baclofen could reverse the changes of these proteins expression. Treatment with baclofen at 12.5 mg/kg & 25 mg/kg in sham-operated rats did not change the expression of LC3-II, mTOR, p-mTOR, Beclin 1, atg5 & atg7 compared with sham-operated rats (n = 4 in each group). Blots shown have been cropped to fit space requirements & run under the same experimental conditions. *P < 0.05 & **P < 0.01 vs sham-operated rats; ##P < 0.01 vs 2VO rats. Image collected & cropped by CiteAb from the following publication (https://www.nature.com/articles/srep14474), licensed under a CC-BY license. Not internally tested by Novus Biologicals.
Western Blot: ATG5 Antibody - BSA Free [NB110-53818] -
Western Blot: ATG5 Antibody - BSA Free [NB110-53818] - Knockdown of autophagy-related gene 5 (ATG5) inhibits trehalose-induced autophagy in normal human primary airway epithelial cells.Normal human tracheobronchial epithelial cells were transfected with Naito1 chimera RNAi (control siRNA) or ATG5 chimera siRNA (ATG5 siRNA). Twenty-four hours after siRNA transfection, cells were treated with medium or trehalose (TRE, 100 mM) for 48 h. ATG5 protein (A) & LC3 I & LC3 II proteins (B) were examined by Western blot analysis with GAPDH protein used as loading control. The representative Western blot picture was shown from 2 independent experiments with each being performed in triplicate wells. Image collected & cropped by CiteAb from the following publication (https://dx.plos.org/10.1371/journal.pone.0124524), licensed under a CC-BY license. Not internally tested by Novus Biologicals.
Immunohistochemistry: ATG5 Antibody - BSA Free [NB110-53818] -
Immunohistochemistry: ATG5 Antibody - BSA Free [NB110-53818] - (A) ATG5 expression in ESCC tissue was analyzed by IHC & scored as 0, 1+, 2+, & 3+. (B) Expression level of ATG5 in adjacent non-cancerous (normal) & early-stage ESCC tissues by IHC. (C-D) Kaplan–Meier estimates of OS (C) & PFS (D) by the expression levels of ATG5 (low & high) of adjacent normal tissue from early-stage ESCC patients. MST: median survival time. Low, expression score 0 or 1+; High, expression score 2+ or 3+. Image collected & cropped by CiteAb from the following publication (https://www.oncotarget.com/lookup/doi/10.18632/oncotarget.20793), licensed under a CC-BY license. Not internally tested by Novus Biologicals.
Western Blot: ATG5 Antibody - BSA Free [NB110-53818] -
Western Blot: ATG5 Antibody - BSA Free [NB110-53818] - Autophagy level was promoted by downregulation of the Hh signaling pathway in zebrafish larvae. (A–C) Larvae were exposed to 10 µM cyA & 0.1% DMSO at 3 dpf for 3 days. (D–H) Embryos were injected with SHHMO, Gli2MO & Gli2Mis at the 1–4 cell stage; at 6 dpf, larvae were collected for assays. GAPDH served as a loading control. The means & s.d. were derived from triple duplicates. *P<0.05, **P<0.01, ***P<0.001 versus the WT groups or DMSO control groups (one-way ANOVA). The data were from three independent experiments. (A,D) SHH protein was detected by western blot assay. (B,E,G) Transcriptional level of autophagy-related genes was tested by qPCR assays. (C,F,H) Autophagy-related proteins LC3B II, ATG5 & P62 level were determined by western blot. Image collected & cropped by CiteAb from the following publication (https://pubmed.ncbi.nlm.nih.gov/30992325), licensed under a CC-BY license. Not internally tested by Novus Biologicals.
Western Blot: ATG5 Antibody - BSA Free [NB110-53818] -
Western Blot: ATG5 Antibody - BSA Free [NB110-53818] - RIP2 is not essential for MAPK pathways in the early ontogenesis. (A) Immunoblot analysis of phospho-p44/42 MAPK, p44/42 MAPK, & p38 MAPK in larvae homogenate from WT & NOD1-1IS−/− zebrafish at 7 days post-fertilization (dpf). (B) Immunoblot analysis of phospho-p44/42 MAPK, p44/42 MAPK, & p38 MAPK in larvae homogenate from WT & RIP2−/− zebrafish at 7 dpf. (C) Immunoblot analysis of Atg5, p62, & LC3b in larvae homogenate from WT & NOD1-1IS−/− zebrafish at 7 dpf. (D) Immunoblot analysis of Atg5, p62, & LC3b in larvae homogenate from WT & RIP2−/− zebrafish at 7 dpf. Western blotting results were quantified using Quantity One software. Data represent the average of two independent experiments. *p < 0.05, **p < 0.01. Image collected & cropped by CiteAb from the following publication (https://pubmed.ncbi.nlm.nih.gov/29692779), licensed under a CC-BY license. Not internally tested by Novus Biologicals.
Western Blot: ATG5 Antibody - BSA Free [NB110-53818] -
Western Blot: ATG5 Antibody - BSA Free [NB110-53818] - Autophagy level was promoted by downregulation of the Hh signaling pathway in zebrafish larvae. (A–C) Larvae were exposed to 10 µM cyA & 0.1% DMSO at 3 dpf for 3 days. (D–H) Embryos were injected with SHHMO, Gli2MO & Gli2Mis at the 1–4 cell stage; at 6 dpf, larvae were collected for assays. GAPDH served as a loading control. The means & s.d. were derived from triple duplicates. *P<0.05, **P<0.01, ***P<0.001 versus the WT groups or DMSO control groups (one-way ANOVA). The data were from three independent experiments. (A,D) SHH protein was detected by western blot assay. (B,E,G) Transcriptional level of autophagy-related genes was tested by qPCR assays. (C,F,H) Autophagy-related proteins LC3B II, ATG5 & P62 level were determined by western blot. Image collected & cropped by CiteAb from the following publication (https://pubmed.ncbi.nlm.nih.gov/30992325), licensed under a CC-BY license. Not internally tested by Novus Biologicals.
Western Blot: ATG5 Antibody - BSA Free [NB110-53818] -
Western Blot: ATG5 Antibody - BSA Free [NB110-53818] - Autophagy-related gene 5 (ATG5) protein interacts with retinoic acid-inducible gene I (RIG-I) & IFN-beta promoter stimulator 1 (IPS-1) in normal human primary airway epithelial cells.Normal human tracheobronchial epithelial cells were treated with medium or trehalose (TRE, 100 mM) for 48 h & then infected with HRV-16 (104 TCID50/well) for 2 h. After removing the free viruses, cells were incubated with medium or trehalose for additional 6 h. Pre-cleared cell lysates were incubated with a mouse anti-human ATG5 antibody, & immunoprecipitated proteins were separated on 10% SDS—PAGE for immunoblotting of RIG-I, IPS-1 & ATG5. The representative Western blot picture was shown from 2 independent experiments with each being performed in triplicate wells. Image collected & cropped by CiteAb from the following publication (https://dx.plos.org/10.1371/journal.pone.0124524), licensed under a CC-BY license. Not internally tested by Novus Biologicals.
Western Blot: ATG5 Antibody - BSA Free [NB110-53818] -
Western Blot: ATG5 Antibody - BSA Free [NB110-53818] - Atg16 is an effector of GTP-Rab26.(A) Co-Immunoprecipitation of FLAG-tagged Rab26 variants expressed in HeLa cells with endogenous Atg16L1 protein. Immunoprecipitation was carried out following lysis in detergent-containing buffer & clearance by centrifugation to remove cell debris. Note that only the GTP-preferring QL variant of Rab26 showed significant binding to Atg16L1 (arrow). (B) GST pulldown of purified recombinantly expressed GST-Rab26 variants with a pre-formed complex of His-tagged versions of Atg5 & the N-terminal domain of Atg16L1 (Atg16NT). Note that Atg16NT selectively interacted with the GTP-preferring QL-variant of Rab26.DOI:http://dx.doi.org/10.7554/eLife.05597.015Analyses of Rab26 & ATG16L1 interaction by analytical gel filtration.To analyze complexes formed between Atg16L1 & Rab26 or Rab33, samples containing either Rab protein were pre-incubated with Atg16NT/Atg5 & loaded on a Superdex 200 10/30 GL column. As controls, Rab26, Rab33, or Atg16NT/Atg5 alone were separately loaded & analyzed. Eluted fractions were collected, analyzed by SDS-PAGE & protein bands visualized using Coomassie staining. (A) The elution profiles for various samples analyzed. (B–F) Representative fractions were separated on SDS PAGE gels & stained with Coomassie to visualize the protein bands. (B) Co-migration of Rab26QL with Atg16NT/Atg5 was not detected when pre-incubated samples of these proteins were tested. (C) Complexes of Rab33QL with Atg16NT/Atg5 can be observed to co-migrated (fractions 5–7, arrows). (D–F) Control runs were performed using only Rab26QL, Rab33QL or Atg16NT/Atg5.DOI:http://dx.doi.org/10.7554/eLife.05597.016 Image collected & cropped by CiteAb from the following publication (https://elifesciences.org/articles/05597), licensed under a CC-BY license. Not internally tested by Novus Biologicals.
Western Blot: ATG5 Antibody - BSA Free [NB110-53818] -
Western Blot: ATG5 Antibody - BSA Free [NB110-53818] - Expression of ER stress associated protein & autophagy related protein in the C28I2 chondrocyte infected with Ad-ATG5 or Ad-ATG7. a The ATG5 & ATG7 mRNA level were analysed by RT-PCR in C28I2 cells. b Analysis of ATG5 & ATG7 mRNA level with Q-PCR in C28I2 cells. Ad-ATG5(a), Ad-ATG7(b). c The ATG5 protein expression was analysed by western blotting in the Ad-ATG5 infected C28I2 cells. The level of ATG5 was normalized to beta -actin. d The ATG7 protein expression was analysed by western blotting in the Ad-ATG7 infected C28I2 cells. The level of ATG7 was normalized to beta -actin. e The expression levels of LC3, P62, PERK, p-PERK, Nrf2 proteins after infected with Ad-ATG5 in C28I2 cells for 24 h by western blotting. The levels of related proteins were normalized to beta -actin. f The expression levels of LC3, P62, PERK, p-PERK, Nrf2 proteins after infected with Ad-ATG7 in C28I2 cells for 24 h by western blotting. The levels of related proteins were normalized to beta -actin. *P < 0.05, **P < 0.01, ***P < 0.001 compared with the controls. Values are means±SD n = 3). (1:NC, 2: Ad-GFP, 3:Ad-ATG5(a) & Ad-ATG7(b), 4:NC, 5:Ad-GFP, 6:Ad-ATG5, 7:Ad-ATG7) Image collected & cropped by CiteAb from the following publication (https://pubmed.ncbi.nlm.nih.gov/31060556), licensed under a CC-BY license. Not internally tested by Novus Biologicals.
Immunocytochemistry/ Immunofluorescence: ATG5 Antibody - BSA Free [NB110-53818] -
Immunocytochemistry/ Immunofluorescence: ATG5 Antibody - BSA Free [NB110-53818] - ERK2 utilizes kinase-docking domains to interact with ATG5–ATG12 & LC3-II.(a) Mutations in FRS on ERK2 decrease colocalization of ERK2 with ATG5–ATG12, LC3 & WIPI1. Immunofluorescence (IF) showing colocalization (depicted as white pixels by ‘colocalization finder application’) of WT-ERK2-HA, FRS ERK2 mutants (L198A-, L232A-, L198A/L232A-, Y261A-ERK2-HA) or common docking (CD) mutant (D319N-ERK2-HA) with ATG5–ATG12 (panels 1–6), LC3 (panels 7–12) or WIPI1 (panels 13–18) in EGF-treated NIH/3T3 cells. ERK2 is stained in red, & autophagy proteins are stained in green. Scale bar, 10 μm. The bars represent mean±s.e.m. **P<0.01, ****P<0.0001 compared with WT-ERK2-transfected cells; Student’s t-test, 50 cells analysed from n=2. (b) Mutations in FRS on ERK2 decrease colocalization of ERK2 with nuclear ATG5–ATG12 or LC3. IF showing colocalization (white pixels) of WT-ERK2-HA (red), FRS ERK2 mutants (L198A-, L232A-, L198A/L232A-, Y261A-ERK2-HA) or common docking (CD) mutant (D319N-ERK2-HA) with ATG5–ATG12 (panels 1–6) or LC3-II (panels 7–12) in EGF-treated NIH/3T3 cells. Scale bar, 5 μm. The bars represent mean±s.e.m. **P<0.01, ***P<0.001, ****P<0.0001 compared with WT-ERK2-transfected cells; Student’s t-test, 50 cells analysed from n=2. Arrows depict colocalization. (c) ATG5–ATG12 conjugation is required for ERK phosphorylation. Immunoblots for P-ERK, total ERK & beta -actin in NIH/3T3 cells transfected with WT ATG5 or the conjugation-defective ATG5 K130R mutant & treated with EGF (10 min). The bars represent mean±s.e.m. *P<0.05 compared with WT ATG5-transfected cells; Student’s t-test, n=3. Image collected & cropped by CiteAb from the following publication (https://www.nature.com/articles/ncomms3799), licensed under a CC-BY license. Not internally tested by Novus Biologicals.
Immunocytochemistry/ Immunofluorescence: ATG5 Antibody - BSA Free [NB110-53818] -
Immunocytochemistry/ Immunofluorescence: ATG5 Antibody - BSA Free [NB110-53818] - Components of the ERK signalling cascade associate with APh.(a) EGF enhances colocalization of phosphorylated (P)-bRAF, P-MEK & P-ERK with LC3. Immunofluorescence (IF) showing colocalization of P-bRAF (green), P-MEK (green) & P-ERK (green) with LC3 (red) in NIH/3T3 cells in presence or absence of EGF (10 min as shown in scheme). The bars represent mean±s.e.m. **P<0.01, ***P<0.001; Student’s t-test, 60 cells analysed from two experiments. Scale bars, 10 μm. (b) P-ERK colocalizes with pre-autophagosomal & autophagosomal structures. IF depicting colocalization of P-ERK (green or red) with LC3 (red), ATG5–ATG12 (red), ATG16 (green), vps34 (red), WIPI1 (red), WIPI2 (red) & P-ULK1 (red) in EGF-treated NIH/3T3 cells. Scale bars, 10 μm. The bars represent mean±s.e.m. 50 cells analysed from two experiments. (c) Growth factors in serum maintain P-ERK/LC3 colocalization. IF depicting colocalization of P-ERK (green) with LC3 (red) in 2 h serum-fed NIH/3T3 cells. (a–c) Native merged images or images with colocalization highlighted in white pixels are shown. Nuclei are blue (DAPI). Scale bar, 10 μm. Image collected & cropped by CiteAb from the following publication (https://www.nature.com/articles/ncomms3799), licensed under a CC-BY license. Not internally tested by Novus Biologicals.
Western Blot: ATG5 Antibody - BSA Free [NB110-53818] -
Western Blot: ATG5 Antibody - BSA Free [NB110-53818] - ATG5 & ATG7 influenced on autophagy, apoptosis & cell cycle through PERK/Nrf2 signaling. a The ER stress proteins were analysed by western blotting in Ad-GFP, Ad-ATG5 + Ad-ATG7,Ad-ATG5 + Ad-ATG7 + siPERK,Ad-ATG5 + Ad-ATG7 + siNrf2 & Ad-ATG5+ Ad-ATG7 + siPERK+siNrf2 induced chondrocytes. b The levels of ER stress proteins were normalized to beta -actin. c Determination of autophagy & apoptosis proteins expression by western blotting in Ad-GFP, Ad-ATG5 + Ad-ATG7, Ad-ATG5 + Ad-ATG7 + siPERK,Ad-ATG5 + Ad-ATG7 + siNrf2 & Ad-ATG5+ Ad-ATG7 + siPERK+ siNrf2 induced chondrocytes. dThe levels of related proteins were normalized to beta -actin. e FCM analysis was used to calculate the percentage of apoptotic cells at the time point of 24 h. The apoptosis rate were increased when combined treatment with silencing of PERK or Nrf2. Experiments were repeated 3 times, Representative images are shown. f Analysis of cell apoptosis. Data come from 3 independent experiments. g FCM analysis indicated that the S phase percentage were decreased compared to that of the control groups when combine infected with silencing of PERK or Nrf2 in C28I2 cells. Experiments were repeated 3 times, Representative images are shown. h Percentage of cells at each phase in different groups. *P < 0.05, **P < 0.01 compared with the controls. Values are means ± SD n = 3). (1:Ad-GFP, 2:Ad-ATG5 + Ad-ATG7, 3:Ad-ATG5 + Ad-ATG7 + siPERK, 4:Ad-ATG5 + Ad-ATG7 + siNrf2, 5:Ad-ATG5 + Ad-ATG7 + siPERK+ siNrf2) Image collected & cropped by CiteAb from the following publication (https://pubmed.ncbi.nlm.nih.gov/31060556), licensed under a CC-BY license. Not internally tested by Novus Biologicals.
Western Blot: ATG5 Antibody - BSA Free [NB110-53818] -
Western Blot: ATG5 Antibody - BSA Free [NB110-53818] - Autophagy did not regulate the Hh signaling pathway. ATG5MO & MisMO were injected into embryos at the 1–4 cell stage. MisMO-injected group as a negative control. The means & s.d. were derived from triple duplicates. (A) Expression of LC3BII & ATG5 proteins was determined by a western blot assay. GAPDH served as a loading control. (B) Heat map of mRNA expression of Hh signaling pathway-related genes Smo, Gli family number Gli1, Gli2a, Gli2b, ptch1 & Shh mRNA from wild-type & ATG5MO-injected embryos was determined by RNAseq assay. (C) Embryos at 1–4 cell stage were either injected with ATG5MO or MisMO or mock-treated & treated with 10 µM of RAPA or 2 mM of 3MA for 3 days from 3 dpf. Expression of SHH protein was determined by a western blot assay. GAPDH served as a loading control. Image collected & cropped by CiteAb from the following publication (https://pubmed.ncbi.nlm.nih.gov/30992325), licensed under a CC-BY license. Not internally tested by Novus Biologicals.
Western Blot: ATG5 Antibody - BSA Free [NB110-53818] -
Western Blot: ATG5 Antibody - BSA Free [NB110-53818] - The effect of ATG5 & ATG7 on autophagy, ER stress, apoptosis & cell cycle depends on PERK. a The ER stress proteins were analysed by western blotting in the GSK2606414 treated chondrocytes. b The levels of ER stress proteins were normalized to beta -actin. c Determination of autophagy & apoptosis proteins expression by western blotting in the GSK2606414 treated chondrocytes. d The levels of related proteins were normalized to beta -actin. e FCM analysis was used to calculate the percentage of apoptotic cells at the time point of 24 h. The apoptosis rate were increased when combined treated with GSK2606414. Experiments were repeated 3 times, Representative images are shown. f Analysis of cell apoptosis. Data come from 3 independent experiments. g FCM analysis indicated that the S phase percentage were decreased compared to that of the control groups when combine treated with GSK2606414 in C28I2 cells. Experiments were repeated 3 times, Representative images are shown. h Percentage of cells at each phase in different groups. *P < 0.05, **P < 0.01 compared with the controls. Values are means ± SD n = 3). (1:Ad-GFP, 2:Ad-ATG5 + Ad-ATG7, 3:Ad-ATG5 + Ad-ATG7 + DMSO, 4:Ad-ATG5 + Ad-ATG7+ GSK2606414) Image collected & cropped by CiteAb from the following publication (https://pubmed.ncbi.nlm.nih.gov/31060556), licensed under a CC-BY license. Not internally tested by Novus Biologicals.
Western Blot: ATG5 Antibody - BSA Free [NB110-53818] -
Western Blot: ATG5 Antibody - BSA Free [NB110-53818] - ATG7/LC3-II regulates ERK phosphorylation.(a) Atg7−/− livers display decreased ERK phosphorylation. Immunoblots for the indicated proteins in liver homogenate (Hom) & cytosolic (Cyt) fractions of control (Con) & liver-specific Atg7−/− mice are shown. The bars represent mean±s.e.m. *P<0.05, **P<0.01, ***P<0.001 compared with Con; Student’s t-test, n=4. (b) Atg7−/− livers display decreased ERK2 dimers. Immunoblots show the indicated proteins in Hom from Con & Atg7−/− livers. The bars represent mean±s.e.m. *P<0.05, ***P<0.001 compared to Con; Student’s t-test, n=4–5. Arrows indicate p42 monomers & dimers. (c) Atg7−/− brown adipose tissues (BAT) display decreased ERK phosphorylation. Immunoblots for indicated proteins in Hom from Con & Atg7−/−BAT. The bars represent mean±s.e.m. **P<0.01 compared with Con; Student’s t-test, n=4–6. (d) Atg7−/− livers exhibit decreased nuclear ERK phosphorylation. Immunoblots show the indicated proteins in homogenate (Hom, lane 1) & nuclear fractions (lanes 2–5) from Con & Atg7−/− livers. The bars represent mean±s.e.m. ***P<0.001 compared with Con; Student’s t-test, n=4–5. (e) LC3 C terminus glycine-deleted ( delta G) mutants exhibit decreased ERK phosphorylation. Immunoblots for indicated proteins in total lysates from CFP-LC3- & CFP-LC3 delta G-transfected NIH/3T3 cells exposed or not to EGF (10 min). The bars represent mean±s.e.m. ***P<0.001 compared with Con; Student’s t-test, n=8. Image collected & cropped by CiteAb from the following publication (https://www.nature.com/articles/ncomms3799), licensed under a CC-BY license. Not internally tested by Novus Biologicals.
Western Blot: ATG5 Antibody - BSA Free [NB110-53818] -
Western Blot: ATG5 Antibody - BSA Free [NB110-53818] - FIGURE 2: Blockage of autophagy leads to increased plp mRNA & protein levels.(A) Schematic illustration of the experimental protocol used for tamoxifen (TMX) induction & analysis in the plpCreERT2; atg5f/f mice. All animals were injected i.p. with 1 mg of TMX per day at the age of 2.5 months for 10 days with two days break in between. The analysis was performed at 6 mo. (B) Western blot analysis with antibodies against Atg5, P62, PLP & MBP proteins in optic nerve lysates of 6mo control & cKO mice. Representative images of a single experiment are depicted. (C) Quantification of normalized protein levels of “B”. (D) Quantification of quantitative real-time PCR in mouse optic nerves of 6mo control & cKO mice. Data information: Data are shown as mean ± SEM. N=3-4 animals per genotype. Student's t-test was used to determine statistical significance between control & cKO protein & mRNA levels. *p < 0.05, **p ≤ 0.01. Image collected & cropped by CiteAb from the following publication (http://www.cell-stress.com/researcharticles/2022a-ktena-cell-stress/), licensed under a CC-BY license. Not internally tested by Novus Biologicals.
Western Blot: ATG5 Antibody - BSA Free [NB110-53818] -
Western Blot: ATG5 Antibody - BSA Free [NB110-53818] - Autophagy is required cell-autonomously in postsynaptic pyramidal neurons for LTD.a–c Time-plots of normalized fEPSP slope & bar graphs of average normalized fEPSP slope during last 15 min of recording after LFS (a) or NMDA (b) or DHPG (c) bath application in P22 hippocampal slices from control (atg5f/f, white circles & bars) & thy1-cKO (black circles & bars) animals. N = 7 animals per genotype. Representative traces of fEPSPs before (black) & after (red) LTD induction for two genotypes in every LTD-triggering protocol. d Schematic representation of protocol used to knockdown atg5 selectively in excitatory neurons of CA1 area of hippocampus in adult (P60) animals. e Images showing representative slices expressing AAV-CamK2a-shatg5-eGFP or AAV-CamK2-shscrambled-mCherry in CA1 area, stained w/ Hoechst dye (nuclei). f Western blot analyses of Atg5, LC3, p62, & actin in lysates from shRNA-atg5 & control hippocampal slices to validate efficacy of knockdown protocol. Graph showing normalized protein levels of LC3, p62, & Atg5 in indicated condition. N = 9 animals. g Time-plot of normalized fEPSP slope & bar graphs of average normalized fEPSP slope during last 15 min of recording following LFS in slices expressing AAV-CamK2a-shscrambled-mCherry (white circles & bars) or AAV-CamK2a-shatg5-eGFP (black circles & bars) in CA1 area. N = 9 animals per condition. Representative traces of fEPSPs before (black) & after (red) LTD induction for two conditions. a–c, f, g Bars represent mean values ± SEM. Statistical analyses performed using unpaired, two-tailed Student’s t-test. a, P = 0.0007, b, P < 0.0001, c, P = 0.0001. In f, P = 0.0231 for LC3, P = 0.0034 for p62, & P < 0.0001 for ATG5. For g, P < 0.0001. Image collected & cropped by CiteAb from following publication (https://pubmed.ncbi.nlm.nih.gov/35115539), licensed under a CC-BY license. Not internally tested by Novus Biologicals.
Western Blot: ATG5 Antibody - BSA Free [NB110-53818] -
Western Blot: ATG5 Antibody - BSA Free [NB110-53818] - IFN-gamma increased rates of autophagy in primary BMECs in vitro. (a) The expression of IFNGRs in BMECs. BMECs treated w/ IFN-gamma for 6, 24 or 48 h. At the end of the treatment period, the levels of IFNGR1 & IFNGR2 analysed using western blot analysis w/ specific antibodies as described in the Materials & Methods section. The data represent the mean±S.E.M. of three independent experiments. Error bars are ±S.E.M. One-way ANOVA; *P<0.05; **P<0.01. (b) BMECs treated w/ IFN-gamma for 3, 6, 12 or 24 h. At the end of the treatment, levels of MAP1LC3, ATG12-ATG5, SQSTM1/p62 & GAPDH analysed using western blot analysis w/ specific antibodies as described in the Materials & Methods section. The data represent the mean±S.E.M. of three independent experiments. Error bars are ±S.E.M. One-way ANOVA; *P<0.05; **P<0.01. (c) BMECs treated w/ IFN-gamma at 2.5, 5, 10 or 20 ng/ml. At the end of the treatment, levels of MAP1LC3, ATG12-ATG5, SQSTM1/p62 & GAPDH analysed using western blot analysis w/ specific antibodies as described in the Materials & Methods section. The data represent the mean±S.E.M. of three independent experiments. Error bars are ±S.E.M. One-way ANOVA; *P<0.05; **P<0.01. (d) Direct effect of IFN-gamma on induction of autophagy. BMECs cultured for 24 h in supernatants from either mock-treated BMECs or cells treated w/ 10 ng/ml of IFN-gamma for 24 h in the presence or absence of anti-IFNGR1, IFNGR2 or IFNGR1/2. At the end of the treatment, levels of MAP1LC3, ATG12-ATG5, SQSTM1/p62 & GAPDH analysed using western blot analysis w/ specific antibodies as described in the Materials & Methods section. The data represent the mean±S.E.M. of three independent experiments. Error bars are ±S.E.M. One-way ANOVA; *P<0.05; **P<0.01. Image collected & cropped by CiteAb from the following publication (https://www.nature.com/articles/cddiscovery201565), licensed under a CC-BY license. Not internally tested by Novus Biologicals.
Immunocytochemistry/ Immunofluorescence: ATG5 Antibody - BSA Free [NB110-53818] -
Immunocytochemistry/ Immunofluorescence: ATG5 Antibody - BSA Free [NB110-53818] - Autophagy associated protein immunoreactivity in HIV-infected brain tissue. (A) Representative images from five randomly selected fields of cells each examined in duplicate frontal lobe white matter sections for the indicated subject groups. The indicated proteins were labeled red & microglia with the cell-type-specific marker Iba1 (green). Blue staining indicates cell nuclei. Arrow heads indicate examples of higher Iba1 immunoreactivity whereas arrows indicate more focal (punctal) vs. diffuse (filamentous) patterns of autophagy associated protein expression. Scale bar = 10 μm. (B) Quantification of relative Iba1 immunoreactivity from (A). F(3,20) = 6.450, p = 0.0031; ∗p < 0.05 when compared to all other subject groups. Error bars show the SEM for the average values of 2–6 regions from each subject group across the six autophagy associated proteins examined. (C) Quantification of the indicated autophagy associated protein relative immunoreactivity from (A). Beclin 1: F(3,12) = 11.29, p = 0.0008; LC3B: F(3,12) = 1.994, p = 0.1687; APG7/ATG7: F(3,12) = 84.20, p = < 0.0001; ATG5: F(3,12) = 6.218, p = 0.0086; p62/SQSTM1: F(3,12) = 87.04, p = < 0.0001; LAMP1: F(3,12) = 8.317, p = 0.0029. ∗p < 0.05 when compared to HIV-negative; #p < 0.05 when compared to HIV-positive; & Ωp < 0.05 when compared to HIV-positive/NCI subjects. Error bars show the SEM for four regions from each subject group. Image collected & cropped by CiteAb from the following publication (http://journal.frontiersin.org/Article/10.3389/fmicb.2015.00653/abstract), licensed under a CC-BY license. Not internally tested by Novus Biologicals.
Western Blot: ATG5 Antibody - BSA Free [NB110-53818] -
Western Blot: ATG5 Antibody - BSA Free [NB110-53818] - Expression of autophagic proteins (Atg5, Atg3, LC3, & beclin-1) & phosphorylated Bcl-2 (Ser70) in BME-UV1 cells forming acinar structures on Matrigel. Representative images of Western blot analysis of Atg5 (a), Atg3 (b), LC3 (c), beclin-1 (d), & phosphorylated Bcl-2 (Ser70) (f) in bovine MECs grown in 3D culture for 3, 6, 9, & 14 days in differentiation medium (control), enriched with 17 beta -estradiol (E2, 1 nM), progesterone (P4, 5 ng/mL), or both (E + P); expression of beta -actin was used as a loading control; graphs below the images show the results of densitometric analysis, in which IOD of each band was measured, & the values were normalized to IOD of beta -actin; the IOD results are presented as means ± SEM from at least three separate experiments. (e) Confocal images of immunofluorescence staining of beclin-1 (green fluorescence) in cells grown in 3D culture for 3 or 9 days in control conditions: DNA was counterstained with 7AAD (red fluorescence) & white arrows indicate the nuclear localization of beclin-1. Image collected & cropped by CiteAb from the following publication (https://pubmed.ncbi.nlm.nih.gov/24895572), licensed under a CC-BY license. Not internally tested by Novus Biologicals.
Immunohistochemistry: ATG5 Antibody - BSA Free [NB110-53818] -
Immunohistochemistry: ATG5 Antibody - BSA Free [NB110-53818] - Elevated basal expression of proinflammatory cytokines genes in Atg5-knockout SMGs. (a) Schematic diagram of generation of experimental mice. Mice developed a spontaneous heterologous Atg5 deletion after five generations of crossing between Atg5f/f & Atg5f/f;Aqp5-Cre mice, resulting in Atg5f/−;Aqp5-Cre mice. Atg5f/+;Aqp5-Cre (Atg5WT) & Atg5f/−;Aqp5-Cre (Atg5KO) mice were used in studies herein. (b) Immunohistochemical analyses show decreased ATG5 protein in both SMG granular convoluted ducts (GCDs; labeled D) & acinar cells (labeled A) of Atg5KO mice, compared with that of Atg5WTmice. Bar: 100 μm. (c) Correlation of decreased ATG5 expression & impaired MAP1LC3 lipidation in SMGs among different genotypes. Equal amounts of whole SMG lysates from two individual mouse of the indicated genotype were analyzed for ATG5 & MAP1LC3 levels by western blots. ATG5 expression was greatly reduced in the SMGs of Atg5F/F than that in Atg5+/+ mice. This hypomorphic phenotype in floxed mouse line has been reported previously in the loxP mouse gene targeting system.18+/+, Atg5+/+; +/−, Atg5+/−; +/−C, Atg5+/−;Aqp5-Cre; F/F, Atg5F/F; F/+, Atg5F/+; F/+C, Atg5F/+;Aqp5-Cre (or Atg5WT); F/−, Atg5F/−; F/−C, Atg5F/−;Aqp5-Cre (or Atg5KO). Relative ATG5 levels were determined by setting average level of ATG5 in Atg5+/+ mice as 1. (d) Quantitative RT-PCR analyses show elevated basal expression of selected proinflammatory cytokine genes in SMGs from Atg5KOmice. Respective mean expression level of the indicated message from SMGs of Atg5WT mice was set as 1. Results are shown as mean±S.D.; N=3; *P<0.05 Image collected & cropped by CiteAb from the following publication (https://www.nature.com/articles/cddis2014428), licensed under a CC-BY license. Not internally tested by Novus Biologicals.
Immunocytochemistry/ Immunofluorescence: ATG5 Antibody - BSA Free [NB110-53818] -
Immunocytochemistry/ Immunofluorescence: ATG5 Antibody - BSA Free [NB110-53818] - ERK2 utilizes kinase-docking domains to interact with ATG5–ATG12 & LC3-II.(a) Mutations in FRS on ERK2 decrease colocalization of ERK2 with ATG5–ATG12, LC3 & WIPI1. Immunofluorescence (IF) showing colocalization (depicted as white pixels by ‘colocalization finder application’) of WT-ERK2-HA, FRS ERK2 mutants (L198A-, L232A-, L198A/L232A-, Y261A-ERK2-HA) or common docking (CD) mutant (D319N-ERK2-HA) with ATG5–ATG12 (panels 1–6), LC3 (panels 7–12) or WIPI1 (panels 13–18) in EGF-treated NIH/3T3 cells. ERK2 is stained in red, & autophagy proteins are stained in green. Scale bar, 10 μm. The bars represent mean±s.e.m. **P<0.01, ****P<0.0001 compared with WT-ERK2-transfected cells; Student’s t-test, 50 cells analysed from n=2. (b) Mutations in FRS on ERK2 decrease colocalization of ERK2 with nuclear ATG5–ATG12 or LC3. IF showing colocalization (white pixels) of WT-ERK2-HA (red), FRS ERK2 mutants (L198A-, L232A-, L198A/L232A-, Y261A-ERK2-HA) or common docking (CD) mutant (D319N-ERK2-HA) with ATG5–ATG12 (panels 1–6) or LC3-II (panels 7–12) in EGF-treated NIH/3T3 cells. Scale bar, 5 μm. The bars represent mean±s.e.m. **P<0.01, ***P<0.001, ****P<0.0001 compared with WT-ERK2-transfected cells; Student’s t-test, 50 cells analysed from n=2. Arrows depict colocalization. (c) ATG5–ATG12 conjugation is required for ERK phosphorylation. Immunoblots for P-ERK, total ERK & beta -actin in NIH/3T3 cells transfected with WT ATG5 or the conjugation-defective ATG5 K130R mutant & treated with EGF (10 min). The bars represent mean±s.e.m. *P<0.05 compared with WT ATG5-transfected cells; Student’s t-test, n=3. Image collected & cropped by CiteAb from the following publication (https://www.nature.com/articles/ncomms3799), licensed under a CC-BY license. Not internally tested by Novus Biologicals.
Western Blot: ATG5 Antibody - BSA Free [NB110-53818] -
Western Blot: ATG5 Antibody - BSA Free [NB110-53818] - ERK phosphorylation in Atg5−/−cells depends on nutrient availability.(a) Atg5−/− MEFs display reduced ERK phosphorylation during nutrient deprivation. Quantification of P-ERK levels normalized to total ERK (detected by immunoblotting) in WT & Atg5−/− MEFs cultured in the absence of serum for indicated times. The bars represent mean±s.e.m. *P<0.05 compared with corresponding WT value; ***P<0.001, ****P<0.0001 compared with 10 min serum-starved Atg5−/− MEFs; ANOVA-Bonferroni post hoc test, n=3. (b) Serum-deprived Atg5−/− MEFs display decreased ERK & p90RSK phosphorylation. Immunoblots for the indicated proteins in total lysates from 2 h serum-deprived WT & Atg5−/− MEFs. The bars represent mean±s.e.m. *P<0.05, ***P<0.001 compared with Con; Student’s t-test, n=3. (c) Atg5−/− MEFs display decreased nuclear ERK activity. Immunoblots for phosphorylated HA (haemagglutinin)-tagged Elk1 in total lysates from 2 h serum-deprived WT & Atg5−/− MEFs cells exposed or not to EGF (10 min). (d) Atg5−/− MEFs display decreased Elk1-driven gene expression. Elk1-driven ZFP36 mRNA levels from 2 h serum-deprived WT & Atg5−/− MEFs cells exposed or not to EGF (10 min). The bars represent mean±s.e.m. ***P<0.001 compared with Con; Student’s t-test, n=3. (e) Decreased ERK phosphorylation in Atg5−/− MEFs occurs independently of changes in ERK phosphatases. Immunoblots for the indicated proteins in 2 h serum-deprived WT MEFs transfected with scrambled siRNA (scr), & Atg5−/− MEFs transfected with scr or siRNAs against MKP3 or PP2A in the presence or absence of EGF. The bars represent mean±s.e.m., n=3. Image collected & cropped by CiteAb from the following publication (https://www.nature.com/articles/ncomms3799), licensed under a CC-BY license. Not internally tested by Novus Biologicals.
Western Blot: ATG5 Antibody - BSA Free [NB110-53818] -
Western Blot: ATG5 Antibody - BSA Free [NB110-53818] - Subarachnoid hemorrhage (SAH) grades & temporal expression of endogenous osteopontin (OPN) & autophagy‐related proteins in rat brain after SAH. A, Representative brain images of Sham & SAH rats. B, Summary of SAH grading scores of all groups. Sample size is 27, n = 9 per group. Data were analyzed using Kruskal‐Wallis test, χ2 = 18.183. C, Representative Western blot images & quantitative analyses of OPN, Beclin 1, LC3, & ATG 5 from the left hemisphere of rat brains at different time points after SAH. Sample size is 36, n = 6 per group. Data were presented as mean ± SD. F = 28.45 for OPN, F = 12.37 for Beclin 1, F = 18.88 for LC3, F = 22.14 for ATG5. *P < .05, ** P < .01, ***P < .001 vs Sham group. SAH, subarachnoid hemorrhage; Vehicle, phosphate‐buffered saline; rOPN, recombinant OPN. NS, not significant Image collected & cropped by CiteAb from the following publication (https://pubmed.ncbi.nlm.nih.gov/31436915), licensed under a CC-BY license. Not internally tested by Novus Biologicals.
Western Blot: ATG5 Antibody - BSA Free [NB110-53818] -
Western Blot: ATG5 Antibody - BSA Free [NB110-53818] - beta ‐guanidinopropionic acid (GPA) promotes autophagy that is essential for longevity in Drosophila. Western blot analysis of Atg8 in wild‐type (WT) flies. beta ‐GPA was found to efficiently increase the levels of Atg8 in flies (n = 6, one‐way ANOVA, *P < 0.05 vs. control). (B) The levels of P62 were downregulated upon beta ‐GPA administration (n = 6, P < 0.05 vs. control, Student's t‐test). (C) Western blot analysis of Atg5 in actin‐GAL4>UAS‐Atg5‐RNAi flies (Atg5‐RNAi). Atg5 was reduced in Atg5‐RNAi flies (n = 6, one‐way ANOVA, *P < 0.05 vs. control). (D, E) Downregulation of autophagy abolished the beta ‐GPA‐mediated lifespan extension (n = 200, P < 0.0001 vs. control, log‐rank test). For all Western blots, relative band intensity was estimated using IMAGEJ. Data are shown as mean ± SEM. Image collected & cropped by CiteAb from the following publication (https://pubmed.ncbi.nlm.nih.gov/26120775), licensed under a CC-BY license. Not internally tested by Novus Biologicals.
Western Blot: ATG5 Antibody - BSA Free [NB110-53818] -
Western Blot: ATG5 Antibody - BSA Free [NB110-53818] - Differences in neuronal autophagy & dendrite varicosity following HIV-1 Tat protein & morphine treatment. (A) Representative images of neurons transfected with a fluorescent reporter plasmid to monitor autophagic flux at 8 h following the indicated treatments. GFP (green) & GFP + mRFP (yellow) fluorescence are observed prior to the fusion of autophagosomes with lysosomes whereas only mRFP (red) fluorescence is present in post-fusion autolysosomes. DIC, differential interference contrast microscopy image. DAPI (blue) staining indicates cell nuclei. (B) Quantification of autolysosomes (red puncta) from (A). F(3,13) = 8.756, p = 0.0019; ∗p < 0.05 when compared to all other groups. (C) Western blotting analysis of the indicated autophagy associated protein levels at 24 h following the indicated treatments. GAPDH was used as a loading control. Blots are representative of three independent experiments. (D) Quantification of dendrite beading from (A). F(3,77) = 6.429, p = 0.0006; ∗p < 0.05 when compared to control cells. Error bars show the SEM. Image collected & cropped by CiteAb from the following publication (http://journal.frontiersin.org/Article/10.3389/fmicb.2015.00653/abstract), licensed under a CC-BY license. Not internally tested by Novus Biologicals.Applications for ATG5 Antibody - BSA Free
Application
Recommended Usage
Immunocytochemistry/ Immunofluorescence
1:250
Immunohistochemistry
1:400
Immunohistochemistry-Paraffin
1:400
Immunoprecipitation
1:10 - 1:500
Simple Western
1:50
Western Blot
1:500
Reviewed Applications
Read 8 reviews rated 4.3 using NB110-53818 in the following applications:
Flow Cytometry Panel Builder
Bio-Techne Knows Flow Cytometry
Save time and reduce costly mistakes by quickly finding compatible reagents using the Panel Builder Tool.
Advanced Features
- Spectra Viewer - Custom analysis of spectra from multiple fluorochromes
- Spillover Popups - Visualize the spectra of individual fluorochromes
- Antigen Density Selector - Match fluorochrome brightness with antigen density

Formulation, Preparation, and Storage
Purification
Immunogen affinity purified
Formulation
PBS
Format
BSA Free
Preservative
0.02% Sodium Azide
Concentration
1.0 mg/ml
Shipping
The product is shipped with polar packs. Upon receipt, store it immediately at the temperature recommended below.
Stability & Storage
Store at 4C short term. Aliquot and store at -20C long term. Avoid freeze-thaw cycles.
Background: ATG5
In the context of its role in autophagy, Atg5 plays diverse physiologically relevant roles. For example, Atg5 together with Atg7 are required for adipogenesis (3). Recently, Atg5 has been implicated in the process of B-cell receptor polarization and antigen presentation (4). In addition to its role in autophagy, Atg5 is implicated in apoptotic cell death. Interaction of Atg5 with FADD (Fas-associated protein with death domain) is involved in cell death induced by IFN-gamma. A truncated form of Atg5, a 24kDa fragment, leads to cell death by interacting with Bcl-xl and inhibiting its anti-apoptotic activity (5). Other Atg5 interacting partners include interleukin-beta (IL-beta) converting enzyme and nucleotide binding oligomerization domain protein 1, which suggest that Atg5 may play other biologically relevant roles (3).
References
1. Yang, Z., & Klionsky, D. J. (2010). Mammalian autophagy: Core molecular machinery and signaling regulation. Current Opinion in Cell Biology. https://doi.org/10.1016/j.ceb.2009.11.014
2. Rubinsztein, D. C., Shpilka, T., & Elazar, Z. (2012). Mechanisms of autophagosome biogenesis. Current Biology. https://doi.org/10.1016/j.cub.2011.11.034
3. Subramani, S., & Malhotra, V. (2013). Non-autophagic roles of autophagy-related proteins. EMBO Reports. https://doi.org/10.1038/embor.2012.220
4. Arbogast, F., Arnold, J., Hammann, P., Kuhn, L., Chicher, J., Murera, D., Gros, F. (2019). ATG5 is required for B cell polarization and presentation of particulate antigens. Autophagy. https://doi.org/10.1080/15548627.2018.1516327
5. Luo, S., & Rubinsztein, D. C. (2007). Atg5 and Bcl-2 provide novel insights into the interplay between apoptosis and autophagy. Cell Death and Differentiation. https://doi.org/10.1038/sj.cdd.4402149
Long Name
ATG5 Autophagy Related 5 Homolog
Alternate Names
APG5, ASP
Gene Symbol
ATG5
Additional ATG5 Products
Product Documents for ATG5 Antibody - BSA Free
Certificate of Analysis
To download a Certificate of Analysis, please enter a lot or batch number in the search box below.
Product Specific Notices for ATG5 Antibody - BSA Free
This product is for research use only and is not approved for use in humans or in clinical diagnosis. Primary Antibodies are guaranteed for 1 year from date of receipt.
Related Research Areas
Citations for ATG5 Antibody - BSA Free
 Powered by Bioz
Customer Reviews for ATG5 Antibody - BSA Free (8)
4.3 out of 5
8 Customer Ratings
Have you used ATG5 Antibody - BSA Free?
Submit a review and receive an Amazon gift card!
$25/€18/£15/$25CAN/¥2500 Yen for a review with an image
$10/€7/£6/$10CAN/¥1110 Yen for a review without an image
Submit a review
Customer Images

-(01-ml)_NB110-53818_10841.jpg)
Showing
1
-
5 of
8 reviews
Showing All
Filter By:
-
Application: Western BlotSample Tested: DU145 human prostate carcinoma cell lineSpecies: HumanVerified Customer | Posted 06/27/2023W-B of the lysate of DU145 cells - control and ATG5 KD

-
Application: Western BlotSample Tested: Liver tissueSpecies: MouseVerified Customer | Posted 09/15/2020WT Liver samples
-
Application: Western BlotSample Tested: Mouse ColonSpecies: MouseVerified Customer | Posted 03/31/2018
-
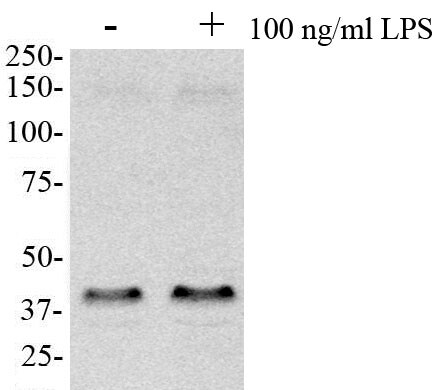
Application: Western BlotSample Tested: human parimary hepatocytes and Human primary hepatocytesSpecies: HumanVerified Customer | Posted 12/15/2017100 ng/ml LPS treated human primary hepatocytes100 ng/ml LPS treated human primary hepatocytes
-
Application: Immunohistochemistry-ParaffinVerified Customer | Posted 10/04/2014Mouse knee
-
Application: Western BlotSample Tested: Murine hepatomaSpecies: MouseVerified Customer | Posted 09/21/2012
-
Application: Western BlotSample Tested: Rat CardiomyocyteSpecies: RatVerified Customer | Posted 12/20/2011
-
Application: Western BlotSample Tested: MouseSpecies: MouseVerified Customer | Posted 11/16/2011
There are no reviews that match your criteria.
Protocols
View specific protocols for ATG5 Antibody - BSA Free (NB110-53818):
Protocol: Western Blot Protocol for Atg5 Antibody (NB110-53818)
Materials
1X PBS
Sample buffer, 2X Laemmli buffer: 4% SDS, 5% 2-mercaptoethanol (BME), 20% glycerol, 0.004% bromophenol blue, 0.125 M Tris HCl, pH 6.8
1X Running Buffer: 25 mM Tris-base, 192 mM glycine, 0.1% SDS. Adjust to pH 8.3
1X Transfer buffer (wet): 25 mM Tris-base, 192 mM glycine, 20% methanol Adjust to pH 8.3
TBS
TBST, TBS and 0.1% Tween
Blocking solution: TBST, 5% non-fat dry milk
rabbit anti-Atg5 primary antibody (NB110-53818) in blocking buffer (1:500)
Methods
1. Grow cells (e.g. HeLa or Neuro2A) in vitro to semi-confluency (70-75%).
2. Rinse cells with ice-cold 1X PBS and lyse cells with sample buffer.
3. Sonicate and incubate cells for 5 minutes at 95oC.
Tip: Cells are lysed directly in sample buffer.
4. Load 10-40 ug/lane of sample on a 12% polyacrylamide gel (SDS-PAGE).
5. Transfer proteins to a PVDF membrane for 60 minutes at 100V.
Tip: For more information on Western Blotting, see our Western Blot handbook:
6. After transfer, rinse the membrane with dH2O and stain with Ponceau S for 1-2 minutes to confirm efficiency of protein transfer.
7. Rinse the membrane in dH2O to remove excess stain and mark the loaded lanes and molecular weight markers using a pencil.
8. Block the membrane using blocking buffer solution (5% BSA in TBST) for 1 hour at room temperature.
9. Rinse the membrane with TBST for 5 minutes.
10. Dilute anti-Atg5 primary antibody (NB110-53818) in blocking buffer (1:500) and incubate the membrane for 1 hour at room temperature.
11. Rinse the membrane with dH2O.
12. Rinse the membrane with TBST, 3 times for 10 minutes each.
13. Incubate the membrane with diluted secondary antibody, according with product's specification, (e.g. anti-rabbit-IgG HRP-conjugated) in blocking buffer for 1 hour at room temperature.
Note: Tween-20 may be added to the blocking or antibody dilution buffer at a final concentration of 0.05-0.2%, provided it does not interfere with antibody-antigen binding.
14. Rinse the membrane with TBST, 3 times for 10 minutes each.
15. Apply the detection reagent of choice (e.g. BioFX Super Plus ECL) in accordance with the manufacturer's instructions.
Deparaffinization:
1. Treat slides with Xylene: 3 changes for 5 minutes each. Drain slides for 10 seconds between changes. 2. Treat slides with 100% Reagent Alcohol: 3 changes for 5 minutes each. Drain slides for 10 seconds between changes.
Quench Endogenous Peroxidase:
1.Place slides in peroxidase quenching solution: 15-30 minutes. To Prepare 200ml of Quenching Solution: Add 3ml of 30% Hydrogen Peroxide to 200ml of Methanol. Use within 4 hours of preparation.
2. Place slides in distilled water: 2 changes for 2 minutes each.
Retrieve Epitopes:
1. Preheat Citrate Buffer. Place 200ml of Citrate Buffer Working Solution into container, cover and place into steamer. Heat to 90-96 degrees C.
2. Place rack of slides into hot Citrate Buffer for 20 minutes. Cover.
3. Carefully remove container with slides from steamer and cool on bench, uncovered, for 20 minutes.
4. Slowly add distilled water to further cool for 5 minutes.
5. Rinse slides with distilled water. 2 changes for 2 minutes each.
Immunostaining Procedure:
1. Remove each slide from rack and circle tissue section with a hydrophobic barrier pen (e.g. Liquid Blocker-Super Pap-Pen).
2. Flood slide with wash solution. Do not allow tissue sections to dry for the rest of the procedure.
3. Drain wash solution and apply 4 drops of blocking reagent to each slide and incubate for 15 minutes.
4. Drain Blocking Reagent (do not wash off the Blocking Reagent), apply 200ul of primary antibody solution to each slide, and incubate for 1 hour.
5. Wash slides with wash solution: 3 changes for 5 minutes each.
6. Drain wash solution, apply 4 drops of secondary antibody to each slide and incubate for 1 hour.
7. Wash slides with wash solution: 3 changes for 5 minutes each.
8. Drain wash solution, apply 4 drops of DAB substrate to each slide and develop for 5-10 minutes. Check development with microscope.
9. Wash slides with wash solution: 3 changes for 5 minutes each.
10. Drain wash solution, apply 4 drops of Hematoxylin to each slide and stain for 1-3 minutes. Increase time if darker counterstaining is desired.
11. Wash slides with wash solution: 2-3 changes for 2 minutes each.
12. Drain wash solution and apply 4 drops of Bluing Solution to each slide for 1-2 minutes.
13. Rinse slides in distilled water.
14. Soak slides in 70% reagent alcohol: 3 minutes with intermittent agitation.
15. Soak slides in 95% reagent alcohol: 2 changes for 3 minutes each with intermittent agitation.
16. Soak slides in 100% reagent alcohol: 3 changes for 3 minutes each with intermittent agitation. Drain slides for 10 seconds between each change.
17. Soak slides in Xylene: 3 changes for 3 minutes each with intermittent agitation. Drain slides for 10 seconds between each change.
18. Apply 2-3 drops of non-aqueous mounting media to each slide.
19. Lay slides on a flat surface to dry prior to viewing under microscope.
NOTES:
-Use treated slides (e.g. HistoBond) to ensure adherence of FFPE sections to slide.
-Prior to deparaffinization, heat slides overnight in a 60 degrees C oven.
-All steps in which Xylene is used should be performed in a fume hood.
-For Epitope Retrieval, a microwave or pressure cooker may be substituted for the steamer method. Adjust times as necessary depending on conditions.
-For the initial IHC run with a new primary antibody, test tissues with and without Epitope Retrieval. In some instances, Epitope Retrieval may not be necessary.
-200ul is the recommended maximum volume to apply to a slide for full coverage. Using more than 200ul may allow solutions to wick off the slide and create drying artifacts. For small tissue sections, less than 200ul may be used.
-5 minutes of development with DAB substrate should be sufficient. Do not develop for more than 10 minutes. If 5 minutes of development causes background staining, further dilution of the primary antibody may be necessary.
-Hematoxylin should produce a light nuclear counterstain so as not to obscure the DAB staining. Counterstain for 1-2 minutes for nuclear antigens. Counterstain for 2-3 minutes for cytoplasmic and membranous antigens. If darker counterstaining is desired, increase the time (up to 10 minutes).
Find general support by application which include: protocols, troubleshooting, illustrated assays, videos and webinars.
- 7-Amino Actinomycin D (7-AAD) Cell Viability Flow Cytometry Protocol
- Antigen Retrieval Protocol (PIER)
- Antigen Retrieval for Frozen Sections Protocol
- Appropriate Fixation of IHC/ICC Samples
- Cellular Response to Hypoxia Protocols
- Chromogenic IHC Staining of Formalin-Fixed Paraffin-Embedded (FFPE) Tissue Protocol
- Chromogenic Immunohistochemistry Staining of Frozen Tissue
- ClariTSA™ Fluorophore Kits
- Detection & Visualization of Antibody Binding
- ELISA Sample Preparation & Collection Guide
- ELISA Troubleshooting Guide
- Extracellular Membrane Flow Cytometry Protocol
- Flow Cytometry Protocol for Cell Surface Markers
- Flow Cytometry Protocol for Staining Membrane Associated Proteins
- Flow Cytometry Staining Protocols
- Flow Cytometry Troubleshooting Guide
- Fluorescent IHC Staining of Frozen Tissue Protocol
- Graphic Protocol for Heat-induced Epitope Retrieval
- Graphic Protocol for the Preparation and Fluorescent IHC Staining of Frozen Tissue Sections
- Graphic Protocol for the Preparation and Fluorescent IHC Staining of Paraffin-embedded Tissue Sections
- Graphic Protocol for the Preparation of Gelatin-coated Slides for Histological Tissue Sections
- How to Run an R&D Systems DuoSet ELISA
- How to Run an R&D Systems Quantikine ELISA
- How to Run an R&D Systems Quantikine™ QuicKit™ ELISA
- ICC Cell Smear Protocol for Suspension Cells
- ICC Immunocytochemistry Protocol Videos
- ICC for Adherent Cells
- IHC Sample Preparation (Frozen sections vs Paraffin)
- Immunocytochemistry (ICC) Protocol
- Immunocytochemistry Troubleshooting
- Immunofluorescence of Organoids Embedded in Cultrex Basement Membrane Extract
- Immunofluorescent IHC Staining of Formalin-Fixed Paraffin-Embedded (FFPE) Tissue Protocol
- Immunohistochemistry (IHC) and Immunocytochemistry (ICC) Protocols
- Immunohistochemistry Frozen Troubleshooting
- Immunohistochemistry Paraffin Troubleshooting
- Immunoprecipitation Protocol
- Intracellular Flow Cytometry Protocol Using Alcohol (Methanol)
- Intracellular Flow Cytometry Protocol Using Detergents
- Intracellular Nuclear Staining Flow Cytometry Protocol Using Detergents
- Intracellular Staining Flow Cytometry Protocol Using Alcohol Permeabilization
- Intracellular Staining Flow Cytometry Protocol Using Detergents to Permeabilize Cells
- Preparing Samples for IHC/ICC Experiments
- Preventing Non-Specific Staining (Non-Specific Binding)
- Primary Antibody Selection & Optimization
- Propidium Iodide Cell Viability Flow Cytometry Protocol
- Protocol for Heat-Induced Epitope Retrieval (HIER)
- Protocol for Liperfluo
- Protocol for Making a 4% Formaldehyde Solution in PBS
- Protocol for VisUCyte™ HRP Polymer Detection Reagent
- Protocol for the Characterization of Human Th22 Cells
- Protocol for the Characterization of Human Th9 Cells
- Protocol for the Fluorescent ICC Staining of Cell Smears - Graphic
- Protocol for the Fluorescent ICC Staining of Cultured Cells on Coverslips - Graphic
- Protocol for the Preparation & Fixation of Cells on Coverslips
- Protocol for the Preparation and Chromogenic IHC Staining of Frozen Tissue Sections
- Protocol for the Preparation and Chromogenic IHC Staining of Frozen Tissue Sections - Graphic
- Protocol for the Preparation and Chromogenic IHC Staining of Paraffin-embedded Tissue Sections
- Protocol for the Preparation and Chromogenic IHC Staining of Paraffin-embedded Tissue Sections - Graphic
- Protocol for the Preparation and Fluorescent ICC Staining of Cells on Coverslips
- Protocol for the Preparation and Fluorescent ICC Staining of Non-adherent Cells
- Protocol for the Preparation and Fluorescent ICC Staining of Stem Cells on Coverslips
- Protocol for the Preparation and Fluorescent IHC Staining of Frozen Tissue Sections
- Protocol for the Preparation and Fluorescent IHC Staining of Paraffin-embedded Tissue Sections
- Protocol for the Preparation of Gelatin-coated Slides for Histological Tissue Sections
- Protocol for the Preparation of a Cell Smear for Non-adherent Cell ICC - Graphic
- Protocol: Annexin V and PI Staining by Flow Cytometry
- Protocol: Annexin V and PI Staining for Apoptosis by Flow Cytometry
- Quantikine HS ELISA Kit Assay Principle, Alkaline Phosphatase
- Quantikine HS ELISA Kit Principle, Streptavidin-HRP Polymer
- R&D Systems Quality Control Western Blot Protocol
- Sandwich ELISA (Colorimetric) – Biotin/Streptavidin Detection Protocol
- Sandwich ELISA (Colorimetric) – Direct Detection Protocol
- TUNEL and Active Caspase-3 Detection by IHC/ICC Protocol
- The Importance of IHC/ICC Controls
- Troubleshooting Guide: ELISA
- Troubleshooting Guide: Fluorokine Flow Cytometry Kits
- Troubleshooting Guide: Immunohistochemistry
- Troubleshooting Guide: Western Blot Figures
- Western Blot Conditions
- Western Blot Protocol
- Western Blot Protocol for Cell Lysates
- Western Blot Troubleshooting
- Western Blot Troubleshooting Guide
- View all Protocols, Troubleshooting, Illustrated assays and Webinars
FAQs for ATG5 Antibody - BSA Free
Showing
1
-
5 of
5 FAQs
Showing All
-
Q: Does this antibody detect free ATG5 monomer in HeLa or HEK 293 cells?
A: This antibody is able to detect ATG5 (unconjugated form) at ~33 kDa and the ATG12-conjugated form at ~56 kDa. In the Western blot image we have on our website, we show the antibody's ability to detect the autophagy induced conjugate ATG5/ATG12. A customer review image shows both the conjugated and unconjugated ATG5 in rat cardiomyocytes. Several publications show this antibody working in Western blot with mouse and human samples. We are not sure if in any of the publications HeLa or HEK 293 cells specifically were used, but if the ATG5 protein is present, this product will detect it in Western blot.
-
Q: I am interested in testing your anti ATG5 (NB110-53818SS) for Immunofluorescence in MDCK cell (canine epithelial cell line). I noticed you report reactivity of the antibody against several species but not dog. Do you know if the Ab will react against canine genome? Also for IF what fixation do you recommend?
A: The applications and species listed for any one of our antibodies are ones we have tested and validated. Canine is not listed as it has not been tested and therefore we cannot guarantee its cross reactivity. If you would be interested in testing this antibody in canine, we can recommend our Innovator's Reward. Our Innovator's Reward is offered to reward researchers for testing new species and applications with our products. Learn more about our Innovators Reward Program. Also, please use this link to view our Immunofluorescence protocol which explains the fixation method that we recommend.
-
Q: Our customer is interested in this ATG5 antibody (cat. no. NB110-53818). Would you please confirm that this antibody would recognize ATG5 alone, as well as ATG5-ATG12 conjugate?
A: The antibody was raised against a peptide corresponding to the N-terminal of ATG5. It should recognize ATG5 alone but it appears that ATG5 is rarely found alone in the cell.
-
Q: The arrow in the data sheet points to the ATG5/ATG12 band of 56 kDa. There is also a band of 33 kDa which I guess is ATG5? Could you explain the meaning of detecting the ATG5/ATG12 conjugate in preference to ATG5? Does the antibody cross-react with ATG12?
A: The Western blot image you are referring to illustrates the ATG5/ATG12 conjugate, which is formed during autophagy. During autophagy ATG5 is covalently bonds ATG12 in a ubiquitous reaction. The lysate that was used was meant to illustrate the ability to detect autophagy by Western blot via ATG5/ATG12. It is possible to detect free ATG5 in cell lysates, although it is not seen in this Western blot. The lower 2 bands do not correspond to ATG5. Our ATG5 antibody does not detect ATG12, which runs at about 23 kDa.
-
Q: Would you please help confirm if NB110-53818 has been tested by IHC with frozen sections?
A: NB110-53818 has been tested with paraffin-embedded tissue, but we have not validated this antibody for IHC with frozen tissue sections.
-
Q: Does this antibody detect free ATG5 monomer in HeLa or HEK 293 cells?
A: This antibody is able to detect ATG5 (unconjugated form) at ~33 kDa and the ATG12-conjugated form at ~56 kDa. In the Western blot image we have on our website, we show the antibody's ability to detect the autophagy induced conjugate ATG5/ATG12. A customer review image shows both the conjugated and unconjugated ATG5 in rat cardiomyocytes. Several publications show this antibody working in Western blot with mouse and human samples. We are not sure if in any of the publications HeLa or HEK 293 cells specifically were used, but if the ATG5 protein is present, this product will detect it in Western blot.
-
Q: I am interested in testing your anti ATG5 (NB110-53818SS) for Immunofluorescence in MDCK cell (canine epithelial cell line). I noticed you report reactivity of the antibody against several species but not dog. Do you know if the Ab will react against canine genome? Also for IF what fixation do you recommend?
A: The applications and species listed for any one of our antibodies are ones we have tested and validated. Canine is not listed as it has not been tested and therefore we cannot guarantee its cross reactivity. If you would be interested in testing this antibody in canine, we can recommend our Innovator's Reward. Our Innovator's Reward is offered to reward researchers for testing new species and applications with our products. Learn more about our Innovators Reward Program. Also, please use this link to view our Immunofluorescence protocol which explains the fixation method that we recommend.
-
Q: Our customer is interested in this ATG5 antibody (cat. no. NB110-53818). Would you please confirm that this antibody would recognize ATG5 alone, as well as ATG5-ATG12 conjugate?
A: The antibody was raised against a peptide corresponding to the N-terminal of ATG5. It should recognize ATG5 alone but it appears that ATG5 is rarely found alone in the cell.
-
Q: The arrow in the data sheet points to the ATG5/ATG12 band of 56 kDa. There is also a band of 33 kDa which I guess is ATG5? Could you explain the meaning of detecting the ATG5/ATG12 conjugate in preference to ATG5? Does the antibody cross-react with ATG12?
A: The Western blot image you are referring to illustrates the ATG5/ATG12 conjugate, which is formed during autophagy. During autophagy ATG5 is covalently bonds ATG12 in a ubiquitous reaction. The lysate that was used was meant to illustrate the ability to detect autophagy by Western blot via ATG5/ATG12. It is possible to detect free ATG5 in cell lysates, although it is not seen in this Western blot. The lower 2 bands do not correspond to ATG5. Our ATG5 antibody does not detect ATG12, which runs at about 23 kDa.
-
Q: Would you please help confirm if NB110-53818 has been tested by IHC with frozen sections?
A: NB110-53818 has been tested with paraffin-embedded tissue, but we have not validated this antibody for IHC with frozen tissue sections.
Loading...