c-Myc Antibody - BSA Free
Novus Biologicals | Catalog # NB600-336
![Immunocytochemistry/ Immunofluorescence: c-Myc Antibody [NB600-336]](https://resources.rndsystems.com/images/products/c-Myc-Antibody-Immunocytochemistry-Immunofluorescence-NB600-336-img0010.jpg "Immunocytochemistry/ Immunofluorescence: c-Myc Antibody [NB600-336]")
Key Product Details
Species Reactivity
Validated:
Human, Mouse, Insect, S. pombe
Cited:
Human, Mouse, S. pombe
Applications
Validated:
Immunohistochemistry, Immunohistochemistry-Paraffin, Western Blot, ELISA, Immunocytochemistry/ Immunofluorescence, Simple Western, Immunoprecipitation, Chromatin Immunoprecipitation (ChIP)
Cited:
Western Blot, Immunocytochemistry/ Immunofluorescence, Immunoprecipitation, Chemotaxis
Label
Unconjugated
Antibody Source
Polyclonal Rabbit IgG
Format
BSA Free
Loading...
Product Specifications
Immunogen
A synthetic peptide made to the human c-Myc Antibody (between residues 385-435) [Uniprot: P01106]
Reactivity Notes
Insect reactivity reported in scientific literature (Martinez-Velez N et al). Use in S. pombe reported in scientific literature (PMID:18094683).
Localization
Cytoplasmic and Nuclear
Clonality
Polyclonal
Host
Rabbit
Isotype
IgG
Theoretical MW
48.8 kDa.
Disclaimer note: The observed molecular weight of the protein may vary from the listed predicted molecular weight due to post translational modifications, post translation cleavages, relative charges, and other experimental factors.
Disclaimer note: The observed molecular weight of the protein may vary from the listed predicted molecular weight due to post translational modifications, post translation cleavages, relative charges, and other experimental factors.
Scientific Data Images for c-Myc Antibody - BSA Free
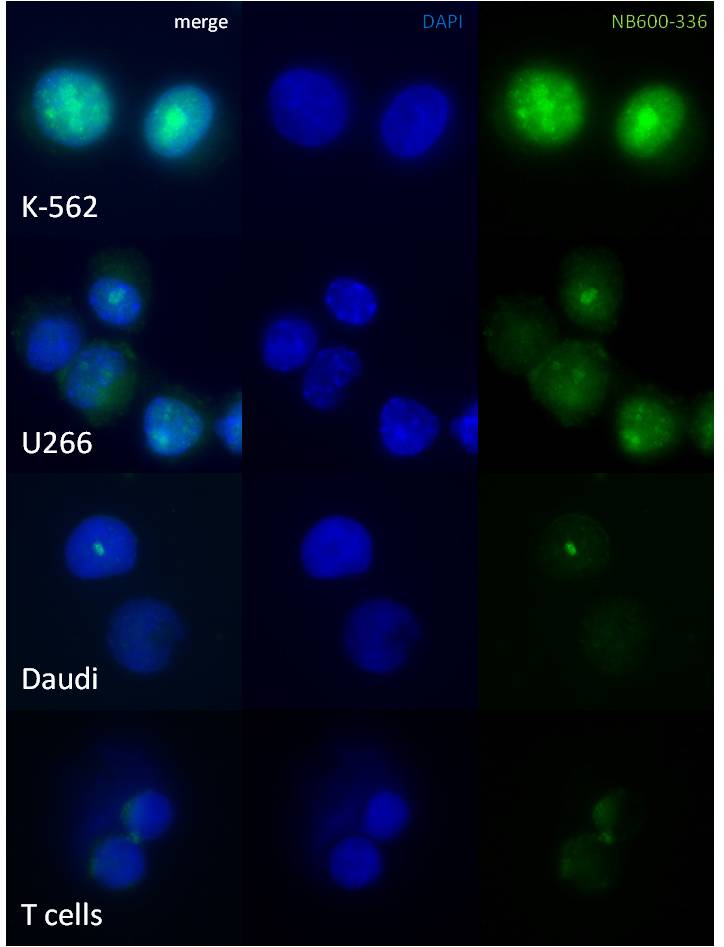
Immunocytochemistry/ Immunofluorescence: c-Myc Antibody [NB600-336]
Immunocytochemistry/Immunofluorescence: c-Myc Antibody [NB600-336] - Staining of K-562, U266, Daudi and normal T cells with c-Myc antibody. ICC/IF image submitted by a verified customer review.![Western Blot: c-Myc Antibody [NB600-336]](https://resources.rndsystems.com/images/products/c-Myc-Antibody-Western-Blot-NB600-336-img0012.jpg "Western Blot: c-Myc Antibody [NB600-336]")
Western Blot: c-Myc Antibody [NB600-336]
Western Blot: c-Myc Antibody [NB600-336] - Detection of c-Myc in HtrA2-Myc Transfectant lysates.![Western Blot: c-Myc Antibody [NB600-336]](https://resources.rndsystems.com/images/products/c-Myc-Antibody-Western-Blot-NB600-336-img0004.jpg "Western Blot: c-Myc Antibody [NB600-336]")
Western Blot: c-Myc Antibody [NB600-336]
Western Blot: c-Myc Antibody [NB600-336] - Analysis of c-Myc on Jurkat whole cell extract using NB600-336.![Western Blot: c-Myc Antibody [NB600-336]](https://resources.rndsystems.com/images/products/c-Myc-Antibody-Western-Blot-NB600-336-img0014.jpg "Western Blot: c-Myc Antibody [NB600-336]")
Western Blot: c-Myc Antibody [NB600-336]
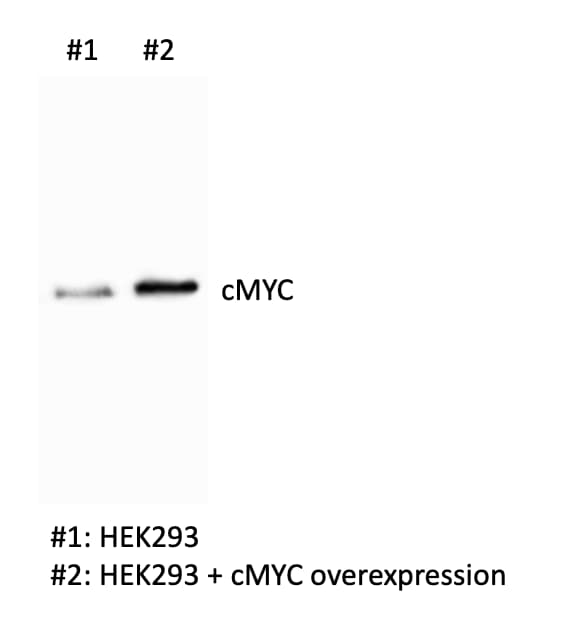
Western Blot: c-Myc Antibody [NB600-336] - Lane 1: control HEK293 cell lysate. Lane 2: CMYC over-expression in HEK293 cell lysate. WB image submitted by a verified customer review.![Immunohistochemistry: c-Myc Antibody [NB600-336]](https://resources.rndsystems.com/images/products/c-Myc-Antibody-Immunohistochemistry-NB600-336-img0002.jpg "Immunohistochemistry: c-Myc Antibody [NB600-336]")
Immunohistochemistry: c-Myc Antibody [NB600-336]
Immunohistochemistry: c-Myc Antibody [NB600-336] - Analysis of c-Myc in mouse prostate using DAB with hematoxylin counterstain.![Western Blot: c-Myc Antibody [NB600-336]](https://resources.rndsystems.com/images/products/c-Myc-Antibody-Western-Blot-NB600-336-img0006.jpg "Western Blot: c-Myc Antibody [NB600-336]")
Western Blot: c-Myc Antibody [NB600-336]
Western Blot: c-Myc Antibody [NB600-336] - c-Myc in MOLT-4 cells. WB image submitted by a verified customer review.![Western Blot: c-Myc Antibody [NB600-336]](https://resources.rndsystems.com/images/products/c-Myc-Antibody-Western-Blot-NB600-336-img0013.jpg "Western Blot: c-Myc Antibody [NB600-336]")
Western Blot: c-Myc Antibody [NB600-336]
Western Blot: c-Myc Antibody [NB600-336] - Analysis of whole cell lysate (WCL) of Jurkat cells using anti-cMyc antibody (NB600-336) at 1:1000 dilution. HRP conjugated goat anti-rabbit IgG (H+L) cross adsorbed secondary antibody was used with ECL substrate for the detection of c-Myc antibody bound to the blotted protein. This c-Myc antibody detected the c-Myc specific band at its expected position (48-50kDa). The signal below 10 kDa in this blot is potentially the degraded protein and we have not characterized this band.![Western Blot: c-Myc Antibody [NB600-336]](https://resources.rndsystems.com/images/products/c-Myc-Antibody-Western-Blot-NB600-336-img0009.jpg "Western Blot: c-Myc Antibody [NB600-336]")
Western Blot: c-Myc Antibody [NB600-336]
Western Blot: c-Myc Antibody [NB600-336] - Analysis using the HRP conjugate of NB600-336. Detection of c-Myc in NIH/3T3 cell lysates (30ug and 45ug per lane) using anti-c-Myc antibody. WB image submitted by a verified customer review.![Immunocytochemistry/ Immunofluorescence: c-Myc Antibody [NB600-336]](https://resources.rndsystems.com/images/products/c-Myc-Antibody-Immunocytochemistry-Immunofluorescence-NB600-336-img0005.jpg "Immunocytochemistry/ Immunofluorescence: c-Myc Antibody [NB600-336]")
Immunocytochemistry/ Immunofluorescence: c-Myc Antibody [NB600-336]
Immunocytochemistry/Immunofluorescence: c-Myc Antibody [NB600-336] - Detection of c-myc Tagged Plakoglobin by Immunofluorescence. Samples: Human microvascular endothelial cells expressing c-myc tagged plakoglobin following transient transfection.![Simple Western: c-Myc Antibody [NB600-336]](https://resources.rndsystems.com/images/products/c-Myc-Antibody-Simple-Western-NB600-336-img0007.jpg "Simple Western: c-Myc Antibody [NB600-336]")
Simple Western: c-Myc Antibody [NB600-336]
Simple Western: c-Myc Antibody [NB600-336] - Lane view shows a specific band for c-Myc in 0.05 mg/ml of Jurkat lysate. This experiment was performed under reducing conditions using the 12-230 kDa separation system.
Western Blot: c-Myc Antibody - BSA Free [NB600-336] -
Z363 promotes MYC and TAF10 degradation. (A) Identification of small inhibitory molecules for MYC. (B) MCF7 cells were treated with Z363 (0, 2.5, 7.5 and 15 μg/ml) for 24 h. The protein levels of MYC and TAF10 were analysed by Western blotting. (C) MCF7 cells were treated with Z363 (7.5 μg/ml) for 0, 6, 12 and 24 h. Furthermore, the protein levels of MYC and TAF10 were analysed by Western blotting. (D) MCF7 cells were treated with 25 μM MG132 at the indicated time points, followed by treatment with or without Z363 (7.5 μg/ml) for 24 h, and MYC and TAF10 expressions were analysed by Western blotting. (E) Western blots for MYC, phosphorylated MYC T58 and S62 in MCF7 cells treated with Z363 at the times indicated. (F) Ratios of pT58 or pS62 to total MYC protein levels from the experiment (E). (G) IF staining for Ki67 and pT58 in Z363‐treated MCF7 cells, scale bar, 10 μm. (H) MCF7 cells were treated with 25 μM MG132 for 2 h, followed by Z363 treatment (7.5 μg/ml) for 24 h. Expressions of MYC and TAF10 were assessed using Western blot analysis. Data shown in F were analysed by two‐way ANOVA. Fluorescence images and blots were representative of three independent experiments. All data are presented as the mean +/- SEM of n = 3. ***p <.001, ns, no significance Image collected and cropped by CiteAb from the following open publication (https://pubmed.ncbi.nlm.nih.gov/36639831), licensed under a CC-BY license. Not internally tested by Novus Biologicals.
Western Blot: c-Myc Antibody - BSA Free [NB600-336] -
The role of miR124-3p and miR766-3p target genes in HNSCC drug resistance. (A) Expression analysis of miR124-3p and miR766-3p direct target genes and downstream target genes by Western blot in HNSCC cell lines (CAL27 and FaDu), with or without transfection with miRNA inhibitors or miRNA mimics. Left: Western blotting showed the expression of miR124-3p target gene (CREBRF) and CREBRF target genes (ATG5 and CREB3). Right: Western blotting showed the expression of miR766-3p target gene (NR3C2) and NR3C2 target genes ( beta -catenin and c-Myc). Quantitative data (relative expression levels after beta -actin-corrected) from three independent experiments are disclosed below each protein band. Data represent the mean +/- SD (n = 3). (B) Target gene analysis in sensitive (CAL27) vs. resistant (CAL27/FP-R) HNSCC cell lines. Quantitative data (relative expression levels after beta -actin-corrected) is shown below each protein band. (C) The effect of NR3C2 and/or CREBRF knockdown on drug-induced cytotoxicity in CAL27 and FaDu. Cells were transfected by 10 nM siRNA (single or combined) for 24 h followed by 72 h exposure to the indicated drug. Cytotoxicity was determined by MTT assay. IC50 values are listed in Table S7. (D) Measurement of apoptosis in CAL27 or FaDu cells in response to cisplatin or 5-FU +/- 24 h prior transfection with 10 nM siRNA. After 24 h of drug treatments, cells were labeled with anti-annexin V-FITC antibody and PI and then analyzed with flow cytometry. A two-way ANOVA with Bonferroni’s correction for multiple comparisons was used to analyze group comparisons, and data are presented as means +/- SD (n = 3). * p < 0.05, *** p < 0.001 (vs. control siRNA), and ### p < 0.001 (vs. untreated). Image collected and cropped by CiteAb from the following open publication (https://pubmed.ncbi.nlm.nih.gov/36358691), licensed under a CC-BY license. Not internally tested by Novus Biologicals.
Western Blot: c-Myc Antibody - BSA Free [NB600-336] -
TAF10 promotes cancer cell proliferation and migration. (A and B) MCF7 cells were transfected with Flag‐labelled MYC and HA‐labelled TAF10, and the interaction between MYC and TAF10 was detected by Co‐IP. (C) Endogenous interaction of MYC and TAF10 was tested in MCF7 cells. (D) Schematic representation of MYC mutants. (E) Schematic representation of TAF10 mutants. Co‐IP was used to detect the interaction between the TAF10 mutants and MYC in MCF7 cells. Co‐IP was used to detect the interaction. (G) Interaction between the MYC mutants and TAF10 in MCF7 cells was detected using Co‐IP. (H) MCF7 cells were co‐transfected with empty vector (Vec) and HA‐labelled TAF10 wild‐type (HA‐TAF10 WT) or mutants (HA‐TAF10 delta 1‐116, HA‐TAF10 delta 116‐206, HA‐TAF10 delta 206‐218). The MYC promoter activity was analysed using the dual luciferase reporter assay 24 h later. (I) Overexpression of TAF10 assessed the capacity for colony formation. MCF7 cells were transfected with either Control‐vec or HA‐TAF10. The ability of cells to form colonies was measured using crystal violet staining. (J) Overexpression of TAF10 measured the migration capacity of cells. MCF7 cells were transfected with either Control‐vec or HA‐TAF10. Transwell assays were used to assess the migration capacity of cells. Scale bar, 20 μm. Data shown in H were analysed by one‐way ANOVA. Data shown in I and J were analysed by t‐test. The blots represented three independent experiments. All data are presented as the mean +/- SEM of n = 3. ***p <.001, **p <.01, ns, no significance Image collected and cropped by CiteAb from the following open publication (https://pubmed.ncbi.nlm.nih.gov/36639831), licensed under a CC-BY license. Not internally tested by Novus Biologicals.
Western Blot: c-Myc Antibody - BSA Free [NB600-336] -
Co‐inhibition of MYC and TAF10 causes synergistic reduction of cell proliferation and tumour growth. (A) Cells (WT, TAF10 KO) were treated with different doses of Z363 for 24 h. Cell proliferation was determined by the CCK‐8 assay. (B) Knockout reliability was detected by Western blotting. (C) The proliferation of wild‐type cells (WT), single and double KO cells (MYC KO, TAF10 KO, DKO) and Z363‐treated cells were detected by Ki67 ELISA kit. (D) The apoptosis of wild‐type cells (WT), single and double KO cells (MYC KO, TAF10 KO, DKO) and Z363‐treated cells were detected by flow cytometry. (E) Cell apoptosis‐related proteins levels were detected by Western blotting. (F) The migration of wild‐type cells (WT), single and double KO cells (MYC KO, TAF10 KO, DKO), and Z363‐treated cells were detected by a Transwell migration assay. Scale bar, 20 μm. (G) Representative images showing xenograft tumours at day 28 post‐subcutaneous injection (n = 5). (H and I) Tumours were measured and depicted as tumour volume (H) or tumour weight (I). Data shown in A were analysed by two‐way ANOVA. Data shown in C, D, F, H and I were analysed by one‐way ANOVA. Flow cytometry, transwell and blots were representative of three independent experiments. All data are presented as the mean +/- SEM of n = 3. ***p <.001, **p <.01, *p <.05 Image collected and cropped by CiteAb from the following open publication (https://pubmed.ncbi.nlm.nih.gov/36639831), licensed under a CC-BY license. Not internally tested by Novus Biologicals.
Western Blot: c-Myc Antibody - BSA Free [NB600-336] -
Z363 promotes MYC and TAF10 degradation. (A) Identification of small inhibitory molecules for MYC. (B) MCF7 cells were treated with Z363 (0, 2.5, 7.5 and 15 μg/ml) for 24 h. The protein levels of MYC and TAF10 were analysed by Western blotting. (C) MCF7 cells were treated with Z363 (7.5 μg/ml) for 0, 6, 12 and 24 h. Furthermore, the protein levels of MYC and TAF10 were analysed by Western blotting. (D) MCF7 cells were treated with 25 μM MG132 at the indicated time points, followed by treatment with or without Z363 (7.5 μg/ml) for 24 h, and MYC and TAF10 expressions were analysed by Western blotting. (E) Western blots for MYC, phosphorylated MYC T58 and S62 in MCF7 cells treated with Z363 at the times indicated. (F) Ratios of pT58 or pS62 to total MYC protein levels from the experiment (E). (G) IF staining for Ki67 and pT58 in Z363‐treated MCF7 cells, scale bar, 10 μm. (H) MCF7 cells were treated with 25 μM MG132 for 2 h, followed by Z363 treatment (7.5 μg/ml) for 24 h. Expressions of MYC and TAF10 were assessed using Western blot analysis. Data shown in F were analysed by two‐way ANOVA. Fluorescence images and blots were representative of three independent experiments. All data are presented as the mean +/- SEM of n = 3. ***p <.001, ns, no significance Image collected and cropped by CiteAb from the following open publication (https://pubmed.ncbi.nlm.nih.gov/36639831), licensed under a CC-BY license. Not internally tested by Novus Biologicals.
Western Blot: c-Myc Antibody - BSA Free [NB600-336] -
The role of miR124-3p and miR766-3p target genes in HNSCC drug resistance. (A) Expression analysis of miR124-3p and miR766-3p direct target genes and downstream target genes by Western blot in HNSCC cell lines (CAL27 and FaDu), with or without transfection with miRNA inhibitors or miRNA mimics. Left: Western blotting showed the expression of miR124-3p target gene (CREBRF) and CREBRF target genes (ATG5 and CREB3). Right: Western blotting showed the expression of miR766-3p target gene (NR3C2) and NR3C2 target genes ( beta -catenin and c-Myc). Quantitative data (relative expression levels after beta -actin-corrected) from three independent experiments are disclosed below each protein band. Data represent the mean +/- SD (n = 3). (B) Target gene analysis in sensitive (CAL27) vs. resistant (CAL27/FP-R) HNSCC cell lines. Quantitative data (relative expression levels after beta -actin-corrected) is shown below each protein band. (C) The effect of NR3C2 and/or CREBRF knockdown on drug-induced cytotoxicity in CAL27 and FaDu. Cells were transfected by 10 nM siRNA (single or combined) for 24 h followed by 72 h exposure to the indicated drug. Cytotoxicity was determined by MTT assay. IC50 values are listed in Table S7. (D) Measurement of apoptosis in CAL27 or FaDu cells in response to cisplatin or 5-FU +/- 24 h prior transfection with 10 nM siRNA. After 24 h of drug treatments, cells were labeled with anti-annexin V-FITC antibody and PI and then analyzed with flow cytometry. A two-way ANOVA with Bonferroni’s correction for multiple comparisons was used to analyze group comparisons, and data are presented as means +/- SD (n = 3). * p < 0.05, *** p < 0.001 (vs. control siRNA), and ### p < 0.001 (vs. untreated). Image collected and cropped by CiteAb from the following open publication (https://pubmed.ncbi.nlm.nih.gov/36358691), licensed under a CC-BY license. Not internally tested by Novus Biologicals.
Western Blot: c-Myc Antibody - BSA Free [NB600-336] -
Kar4p interacts with the MIS complex components Mum2p and Slz1p.(A) Western blots of total protein and co-IPs between Mum2p-4MYC and the alleles of Kar4p-3HA. (MY 16256 and 16257) (Top) Total protein samples from the extracts that were used for the Co-IPs. Kar2p is used as a loading control. Alleles proficient for Kar4p’s meiotic function (Mei+) are in blue and alleles in red are defective (Mei-). (Bottom) Co-IPs where Mum2p-4MYC was purified and the co-purification of Kar4p-3HA was assayed. (B) Western blots of total protein and Co-IPs between Slz1p-3HA and Kar4p-9MYC. (MY 16405 and 16409) (Left) Total protein samples from the extracts that were used for the co-IPs. “*" indicates a non-specific band. (Right) Co-IPs where Slz1p-3HA was purified and the co-purification of Kar4p-13MYC was assayed. “‡" indicates the heavy chain of IgG from the anti-HA magnetic beads used for the Co-IP. (C) Western blots of total protein and Co-IPs between Kar4p-9MYC and Slz1p-3HA. (Left) Total protein samples from the extracts that were used for the Co-IPs. (Right) Co-IPs where Kar4p-9MYC was purified and the co-purification of Slz1-3HA was assayed. Image collected and cropped by CiteAb from the following open publication (https://pubmed.ncbi.nlm.nih.gov/37603553), licensed under a CC-BY license. Not internally tested by Novus Biologicals.
Western Blot: c-Myc Antibody - BSA Free [NB600-336] -
Kar4p is required for mRNA m6A methylation.(A) mRNA m6A levels measured using an ELISA-like assay. The indicated mutations were made in the SK1 strain background (MY 16325, 16326, 16351, 16353, and 16356) and samples were harvested after four hours of exposure to meiosis inducing conditions. Experiments were run in three biological replicates for each strain and error bars represent standard deviation. (B) Western Blot of 3xFLAG-Rme1p in wild type (MY 16563) and kar4 delta / delta (MY 16569) across a time course of meiosis. Kar2p is used as a loading control. (C) Western blot of 3xMYC-Ime4p after four hours in meiosis inducing media with either 100 μM cycloheximide or an equivalent amount of DMSO in both wild type (Say914) and kar4 delta / delta (MY 16543). (Top) 3xMYC-Ime4p levels with DMSO. (Middle) 3xMYC-Ime4p levels with cycloheximide. (Bottom) Quantification of three biological replicates of the cycloheximide chase experiment. The strains used are in the SK1 background. Kar2p is used as a loading control. Image collected and cropped by CiteAb from the following open publication (https://pubmed.ncbi.nlm.nih.gov/37603553), licensed under a CC-BY license. Not internally tested by Novus Biologicals.
Immunohistochemistry: c-Myc Antibody - BSA Free [NB600-336] -
Downregulation of CREBRF and NR3C2 increase poor prognosis in HNSCC. (A) Histological analysis of miR124-3p and miR766-3p target gene expression (CREBRF-ATG5/CREB3, NR3C2-beta -catenin/c-Myc) in Responder vs. Non-Responder HNSCC clinical samples. Magnification, x100. Scale bar, 210 um. The quantitative data from all specimens are shown in the bar chart. Each dot in the graph represents an individual clinical sample. Two-sided unpaired Student t test was used to analyze comparisons, and data are presented as means +/- SEM. * p < 0.05 and *** p < 0.001. (B) Histological analysis of tumor morphology in relation to miR124-3p and miR766-3p target gene expression. Representative images of CREBRF, ATG5, CREB3, NR3C2, beta -catenin, and c-Myc expression in the serial section of responder and non-responder HNSCC specimens. BV: Blood Vessel. T: Tumor. N: Normal tissue. The invasive cancer cells are indicated by red arrowhead. Magnification, ×200. Scale bar, 100 um. (C) Summary of resistance mechanisms regulated by miR124-3p and miR766-3p. Our data indicated that upon acquired resistance in HNSCC cells or in non-responder HNSCC tumors, the levels of miR124-3p and miR766-3p go up, which in turn down-regulate its direct target genes: CREBRF and NR3C2, and consequently the expression of downstream targets of CREBRF (ATG5/CREB3) and NR3C2 ( beta -catenin/c-Myc) increased in resistant tumors, which are positively correlated with poor prognosis. Thus, by enhancing the CREBRF-ATG5/CREB3 and NR3C2-beta -catenin/c-Myc axis, miR124-3p and miR766-3p support aggressive HNSCC progression. Image collected and cropped by CiteAb from the following open publication (https://pubmed.ncbi.nlm.nih.gov/36358691), licensed under a CC-BY license. Not internally tested by Novus Biologicals.
Immunohistochemistry: c-Myc Antibody - BSA Free [NB600-336] -
Downregulation of CREBRF and NR3C2 increase poor prognosis in HNSCC. (A) Histological analysis of miR124-3p and miR766-3p target gene expression (CREBRF-ATG5/CREB3, NR3C2-beta -catenin/c-Myc) in Responder vs. Non-Responder HNSCC clinical samples. Magnification, x100. Scale bar, 210 um. The quantitative data from all specimens are shown in the bar chart. Each dot in the graph represents an individual clinical sample. Two-sided unpaired Student t test was used to analyze comparisons, and data are presented as means +/- SEM. * p < 0.05 and *** p < 0.001. (B) Histological analysis of tumor morphology in relation to miR124-3p and miR766-3p target gene expression. Representative images of CREBRF, ATG5, CREB3, NR3C2, beta -catenin, and c-Myc expression in the serial section of responder and non-responder HNSCC specimens. BV: Blood Vessel. T: Tumor. N: Normal tissue. The invasive cancer cells are indicated by red arrowhead. Magnification, ×200. Scale bar, 100 um. (C) Summary of resistance mechanisms regulated by miR124-3p and miR766-3p. Our data indicated that upon acquired resistance in HNSCC cells or in non-responder HNSCC tumors, the levels of miR124-3p and miR766-3p go up, which in turn down-regulate its direct target genes: CREBRF and NR3C2, and consequently the expression of downstream targets of CREBRF (ATG5/CREB3) and NR3C2 ( beta -catenin/c-Myc) increased in resistant tumors, which are positively correlated with poor prognosis. Thus, by enhancing the CREBRF-ATG5/CREB3 and NR3C2-beta -catenin/c-Myc axis, miR124-3p and miR766-3p support aggressive HNSCC progression. Image collected and cropped by CiteAb from the following open publication (https://pubmed.ncbi.nlm.nih.gov/36358691), licensed under a CC-BY license. Not internally tested by Novus Biologicals.Applications for c-Myc Antibody - BSA Free
Application
Recommended Usage
ELISA
1:1000
Immunocytochemistry/ Immunofluorescence
1:50
Immunohistochemistry
1:100
Immunohistochemistry-Paraffin
1:100
Immunoprecipitation
1:1000
Simple Western
1:500
Western Blot
1:1000
Application Notes
Prior to immunostaining paraffin tissues, antigen retrieval with sodium citrate buffer (pH 6.0) is recommended. In Simple Western only 10 - 15 uL of the recommended dilution is used per data point.
See Simple Western Antibody Database for Simple Western validation: Tested in Jurkat lysate 0.05 mg/mL, separated by Size, antibody dilution of 1:500, apparent MW was 87 kDa. Separated by Size-Wes, Sally Sue/Peggy Sue.
See Simple Western Antibody Database for Simple Western validation: Tested in Jurkat lysate 0.05 mg/mL, separated by Size, antibody dilution of 1:500, apparent MW was 87 kDa. Separated by Size-Wes, Sally Sue/Peggy Sue.
Reviewed Applications
Read 3 reviews rated 5 using NB600-336 in the following applications:
Formulation, Preparation, and Storage
Purification
Immunogen affinity purified
Formulation
Tris-Glycine, 0.15 M NaCl
Format
BSA Free
Preservative
0.09% Sodium Azide
Concentration
1 mg/ml
Shipping
The product is shipped with polar packs. Upon receipt, store it immediately at the temperature recommended below.
Stability & Storage
Store at 4C short term. Aliquot and store at -20C long term. Avoid freeze-thaw cycles.
Background: c-Myc
A basic Helix-Loop-Helix, Leucine Zipper domain (bHLH/LZ), designated Max, specifically associates with c-Myc, N-Myc and L-Myc proteins. The Myc-Max complex binds to DNA in a sequence-specific manner under conditions where neither Max nor Myc exhibit appreciable binding. Max can also form heterodimers with other bHLH-Zip proteins, Mad and Mxi1. c-Myc plays a role in cell cycle progression, apoptosis, cellular transformation and angiogenesis (2). Mutations, overexpression, rearrangement and translocation of this gene have been associated with a variety of cancers including B-cell Lymphomas, acute myeloid leukemia, glioblastoma, stomach adenocarcinoma, and prostate adenocarcinoma (3).
References
1. Wilkinson, D. S., Tsai, W. W., Schumacher, M. A., & Barton, M. C. (2008). Chromatin-bound p53 anchors activated Smads and the mSin3A corepressor to confer transforming-growth-factor-beta-mediated transcription repression. Mol Cell Biol, 28(6), 1988-1998. doi:10.1128/mcb.01442-07
2. Pedrosa, A. R., Bodrug, N., Gomez-Escudero, J., Carter, E. P., Reynolds, L. E., Georgiou, P. N.,... Hodivala-Dilke, K. M. (2019). Tumor Angiogenesis Is Differentially Regulated by Phosphorylation of Endothelial Cell Focal Adhesion Kinase Tyrosines-397 and -861. Cancer Res, 79(17), 4371-4386. doi:10.1158/0008-5472.Can-18-3934
3. Nagasaka, M., Tsuzuki, K., Ozeki, Y., Tokugawa, M., Ohoka, N., Inoue, Y., & Hayashi, H. (2019). Lysine-Specific Demethylase 1 (LSD1/KDM1A) Is a Novel Target Gene of c-Myc. Biol Pharm Bull, 42(3), 481-488. doi:10.1248/bpb.b18-00892
Long Name
v-Myc Avian Myelocytomatosis Viral Oncogene Homolog (Avian)
Alternate Names
cMyc, Myc, Myc2, Niard, Nird
Entrez Gene IDs
4609 (Human)
Gene Symbol
MYC
UniProt
Additional c-Myc Products
Product Documents for c-Myc Antibody - BSA Free
Certificate of Analysis
To download a Certificate of Analysis, please enter a lot or batch number in the search box below.
Product Specific Notices for c-Myc Antibody - BSA Free
This product is for research use only and is not approved for use in humans or in clinical diagnosis. Primary Antibodies are guaranteed for 1 year from date of receipt.
Citations for c-Myc Antibody - BSA Free
 Powered by Bioz
Customer Reviews for c-Myc Antibody - BSA Free (3)
5 out of 5
3 Customer Ratings
Have you used c-Myc Antibody - BSA Free?
Submit a review and receive an Amazon gift card!
$25/€18/£15/$25CAN/¥2500 Yen for a review with an image
$10/€7/£6/$10CAN/¥1110 Yen for a review without an image
Submit a review
Customer Images
-(01-ml)_NB600-336_9001.jpg)
Showing
1
-
3 of
3 reviews
Showing All
Filter By:
-
Application: Western BlotSample Tested: HEK293Species: HumanVerified Customer | Posted 06/04/2021Line1: control HEK293 Line2: CMYC over expression in HEK293

-
Application: ImmunofluorescenceSample Tested: K-562, U266, Daudi, normal human T cellsSpecies: HumanVerified Customer | Posted 10/02/2015IFF/ICC staining of K-562, U266, Daudi and normal T cells with NB600-336
-
Application: Western BlotSample Tested: WB for c-Myc in MOLT-4 cellsSpecies: HumanVerified Customer | Posted 07/24/2014WB for c-Myc in MOLT-4 cells
There are no reviews that match your criteria.
Protocols
View specific protocols for c-Myc Antibody - BSA Free (NB600-336):
Western Blot Protocol
1. Perform SDS-PAGE on samples to be analyzed, loading 40 ug of total protein per lane.
2. Transfer proteins to membrane according to the instructions provided by the manufacturer of the membrane and transfer apparatus.
3. Stain according to standard Ponceau S procedure (or similar product) to assess transfer success, and mark molecular weight standards where appropriate.
4. Rinse the blot.
5. Block the membrane using standard blocking buffer for at least 1 hour.
6. Wash the membrane in wash buffer three times for 10 minutes each.
7. Dilute primary antibody in blocking buffer and incubate 1 hour at room temperature.
8. Wash the membrane in wash buffer three times for 10 minutes each.
9. Apply the diluted HRP conjugated secondary antibody in blocking buffer (as per manufacturers instructions) and incubate 1 hour at room temperature.
10. Wash the blot in wash buffer three times for 10 minutes each (this step can be repeated as required to reduce background).
11. Apply the detection reagent of choice in accordance with the manufacturers instructions.
Note: Tween-20 can be added to the blocking or antibody dilution buffer at a final concentration of 0.05-0.2%.
Immunohistochemistry-Paraffin Embedded Sections
Antigen Unmasking:
Bring slides to a boil in 10 mM sodium citrate buffer (pH 6.0) then maintain at a sub-boiling temperature for 10 minutes. Cool slides on bench-top for 30 minutes.
Staining:
1. Wash sections in deionized water three times for 5 minutes each.
2. Wash sections in wash buffer for 5 minutes.
3. Block each section with 100-400 ul blocking solution for 1 hour at room temperature.
4. Remove blocking solution and add 100-400 ul diluted primary antibody. Incubate overnight at 4 C.
5. Remove antibody solution and wash sections in wash buffer three times for 5 minutes each.
6. Add 100-400 ul biotinylated diluted secondary antibody. Incubate 30 minutes at room temperature.
7. Remove secondary antibody solution and wash sections three times with wash buffer for 5 minutes each.
8. Add 100-400 ul Streptavidin-HRP reagent to each section and incubate for 30 minutes at room temperature.
9. Wash sections three times in wash buffer for 5 minutes each.
10. Add 100-400 ul DAB substrate to each section and monitor staining closely.
11. As soon as the sections develop, immerse slides in deionized water.
12. Counterstain sections in hematoxylin.
13. Wash sections in deionized water two times for 5 minutes each.
14. Dehydrate sections.
15. Mount coverslips.
Immunocytochemistry Protocol
Culture cells to appropriate density in 35 mm culture dishes or 6-well plates.
1. Remove culture medium and add 10% formalin to the dish. Fix at room temperature for 30 minutes.
2. Remove the formalin and add ice cold methanol. Incubate for 5-10 minutes.
3. Remove methanol and add washing solution (i.e. PBS). Be sure to not let the specimen dry out. Wash three times for 10 minutes.
4. To block nonspecific antibody binding incubate in 10% normal goat serum from 1 hour to overnight at room temperature.
5. Add primary antibody at appropriate dilution and incubate at room temperature from 2 hours to overnight at room temperature.
6. Remove primary antibody and replace with washing solution. Wash three times for 10 minutes.
7. Add secondary antibody at appropriate dilution. Incubate for 1 hour at room temperature.
8. Remove antibody and replace with wash solution, then wash for 10 minutes. Add Hoechst 33258 to wash solution at 1:25,0000 and incubate for 10 minutes. Wash a third time for 10 minutes.
9. Cells can be viewed directly after washing. The plates can also be stored in PBS containing Azide covered in Parafilm (TM). Cells can also be cover-slipped using Fluoromount, with appropriate sealing.
*The above information is only intended as a guide. The researcher should determine what protocol best meets their needs. Please follow safe laboratory procedures.
Find general support by application which include: protocols, troubleshooting, illustrated assays, videos and webinars.
- Antigen Retrieval Protocol (PIER)
- Antigen Retrieval for Frozen Sections Protocol
- Appropriate Fixation of IHC/ICC Samples
- Cellular Response to Hypoxia Protocols
- ChIP Protocol Video
- Chromatin Immunoprecipitation (ChIP) Protocol
- Chromatin Immunoprecipitation Protocol
- Chromogenic IHC Staining of Formalin-Fixed Paraffin-Embedded (FFPE) Tissue Protocol
- Chromogenic Immunohistochemistry Staining of Frozen Tissue
- ClariTSA™ Fluorophore Kits
- Detection & Visualization of Antibody Binding
- ELISA Sample Preparation & Collection Guide
- ELISA Troubleshooting Guide
- Fluorescent IHC Staining of Frozen Tissue Protocol
- Graphic Protocol for Heat-induced Epitope Retrieval
- Graphic Protocol for the Preparation and Fluorescent IHC Staining of Frozen Tissue Sections
- Graphic Protocol for the Preparation and Fluorescent IHC Staining of Paraffin-embedded Tissue Sections
- Graphic Protocol for the Preparation of Gelatin-coated Slides for Histological Tissue Sections
- How to Run an R&D Systems DuoSet ELISA
- How to Run an R&D Systems Quantikine ELISA
- How to Run an R&D Systems Quantikine™ QuicKit™ ELISA
- ICC Cell Smear Protocol for Suspension Cells
- ICC Immunocytochemistry Protocol Videos
- ICC for Adherent Cells
- IHC Sample Preparation (Frozen sections vs Paraffin)
- Immunocytochemistry (ICC) Protocol
- Immunocytochemistry Troubleshooting
- Immunofluorescence of Organoids Embedded in Cultrex Basement Membrane Extract
- Immunofluorescent IHC Staining of Formalin-Fixed Paraffin-Embedded (FFPE) Tissue Protocol
- Immunohistochemistry (IHC) and Immunocytochemistry (ICC) Protocols
- Immunohistochemistry Frozen Troubleshooting
- Immunohistochemistry Paraffin Troubleshooting
- Immunoprecipitation Protocol
- Preparing Samples for IHC/ICC Experiments
- Preventing Non-Specific Staining (Non-Specific Binding)
- Primary Antibody Selection & Optimization
- Protocol for Heat-Induced Epitope Retrieval (HIER)
- Protocol for Making a 4% Formaldehyde Solution in PBS
- Protocol for VisUCyte™ HRP Polymer Detection Reagent
- Protocol for the Fluorescent ICC Staining of Cell Smears - Graphic
- Protocol for the Fluorescent ICC Staining of Cultured Cells on Coverslips - Graphic
- Protocol for the Preparation & Fixation of Cells on Coverslips
- Protocol for the Preparation and Chromogenic IHC Staining of Frozen Tissue Sections
- Protocol for the Preparation and Chromogenic IHC Staining of Frozen Tissue Sections - Graphic
- Protocol for the Preparation and Chromogenic IHC Staining of Paraffin-embedded Tissue Sections
- Protocol for the Preparation and Chromogenic IHC Staining of Paraffin-embedded Tissue Sections - Graphic
- Protocol for the Preparation and Fluorescent ICC Staining of Cells on Coverslips
- Protocol for the Preparation and Fluorescent ICC Staining of Non-adherent Cells
- Protocol for the Preparation and Fluorescent ICC Staining of Stem Cells on Coverslips
- Protocol for the Preparation and Fluorescent IHC Staining of Frozen Tissue Sections
- Protocol for the Preparation and Fluorescent IHC Staining of Paraffin-embedded Tissue Sections
- Protocol for the Preparation of Gelatin-coated Slides for Histological Tissue Sections
- Protocol for the Preparation of a Cell Smear for Non-adherent Cell ICC - Graphic
- Quantikine HS ELISA Kit Assay Principle, Alkaline Phosphatase
- Quantikine HS ELISA Kit Principle, Streptavidin-HRP Polymer
- R&D Systems Quality Control Western Blot Protocol
- Sandwich ELISA (Colorimetric) – Biotin/Streptavidin Detection Protocol
- Sandwich ELISA (Colorimetric) – Direct Detection Protocol
- TUNEL and Active Caspase-3 Detection by IHC/ICC Protocol
- The Importance of IHC/ICC Controls
- Troubleshooting Guide: ELISA
- Troubleshooting Guide: Immunohistochemistry
- Troubleshooting Guide: Western Blot Figures
- Western Blot Conditions
- Western Blot Protocol
- Western Blot Protocol for Cell Lysates
- Western Blot Troubleshooting
- Western Blot Troubleshooting Guide
- View all Protocols, Troubleshooting, Illustrated assays and Webinars
FAQs for c-Myc Antibody - BSA Free
Showing
1
-
2 of
2 FAQs
Showing All
-
Q: Can you tell me the Ig type of this antibody?
A: Rabbit polyclonal IgG
-
Q: I want to know the MW of NB600-336.
A: This antibody is designed to detect c-Myc which is a common epitope tag used on proteins. The MW detected with each protein will vary based on the size of the protein. The c-Myc tag is only about 1.2kDa but the full length Myc protein is about 49kDa.
-
Q: Can you tell me the Ig type of this antibody?
A: Rabbit polyclonal IgG
-
Q: I want to know the MW of NB600-336.
A: This antibody is designed to detect c-Myc which is a common epitope tag used on proteins. The MW detected with each protein will vary based on the size of the protein. The c-Myc tag is only about 1.2kDa but the full length Myc protein is about 49kDa.