ALCAM, activated leukocyte cell adhesion molecule, is a type I membrane glycoprotein and a member of the immunoglobulin supergene family. It is also known as CD166, MEMD, SC-1/DM-GRASP/BEN in the chicken, and KG-CAM in the rat. ALCAM is expressed on thymic epithelial cells, activated B and T cells, and monocytes. ALCAM can bind itself homotypically and is also capable of binding CD6, NgCAM, and other, as of yet, unidentified brain proteins. The ALCAM/CD6 interaction may be involved in T cell development and T cell regulation. Additionally, ALCAM/CD6 and ALCAM/NgCAM interactions may play roles in the nervous system. ALCAM has also been observed to be upregulated on highly metastasizing melanoma cell lines and may play a role in tumor migration. ALCAM is a 583 amino acid (aa) protein consisting of a 27 aa signal peptide, a 500 aa extracellular domain, a 24 aa transmembrane domain and a 32 aa cytoplasmic domain. The extracellular domain of ALCAM contains 5 Ig-like domains.
Human ALCAM/CD166 Antibody (105902) [PE]
R&D Systems | Catalog # FAB6561P

Key Product Details
Species Reactivity
Validated:
Cited:
Applications
Validated:
Cited:
Label
Antibody Source
Product Specifications
Immunogen
Trp28-Ala526
Accession # Q13740
Specificity
Clonality
Host
Isotype
Scientific Data Images for Human ALCAM/CD166 Antibody (105902) [PE]
Detection of ALCAM/CD166 in Human Whole Blood Monocytes by Flow Cytometry.
Human whole blood monocytes were stained with Mouse Anti-Human ALCAM/CD166 PE-conjugated Monoclonal Antibody (Catalog # FAB6561P, filled histogram) or isotype control antibody (IC002P, open histogram). View our protocol for Staining Membrane-associated Proteins.
Detection of Human ALCAM/CD166 by Flow Cytometry
Analysis of CSC marker expression in TOP-GFP cultures.(A) Representative images of the three independent single-cell-cloned CSC cultures, lentivirally transduced with TOP-GFP. Phase contrast (top) and fluorescence microscopy (bottom) for each of the cultures indicated. Bar = 90 µm. (B) Single parameter histograms for GFP intensity for each of the TOP-GFP single-cell-cloned CSC cultures with the TOP-GFPlow (10% lowest) and TOP-GFPhigh (10% highest) populations indicated. (C) Single parameter histograms for the indicated cell surface markers for each of the indicated cultures. Gray denotes TOP-GFPlow (10% lowest) and green denotes TOP-GFPhigh (10% highest) populations. (D) Density plots for CD29/CD24 and CD44/CD166 from TOP-GFPlow (gray) and TOP-GFPhigh (green) populations of each culture. Additional details for this experiment can be found at https://osf.io/tfy28/.Flow cytometry gating strategy.Representative density plots of gating strategy to assess cell surface markers from TOP-GFPlow and TOP-GFPhigh populations. Forward scatter area (FSC-A) and PerCP-Cy5.5 was used to gate on viable cells (PI negative cells), followed by forward verses side scatter area (FSC-A vs SSC-A) to identify cells of interest and exclude debris, which were then analyzed by FSC-A and forward scatter width (FSC-W), and then SSC-A and side scatter width (SSC-W) to exclude doublet cells. From the single-cell population, SSC and FITC were used to gate on the TOP-GFPlow (10% lowest) and TOP-GFPhigh (10% highest) populations. TOP-GFPlow and TOP-GFPhigh populations were then assessed for PE and APC to detect the fluorophores conjugated to antibodies against the cell surface markers analyzed in this study. Additional details for this experiment can be found at https://osf.io/tfy28/. Image collected and cropped by CiteAb from the following publication (https://pubmed.ncbi.nlm.nih.gov/31215867), licensed under a CC-BY license. Not internally tested by R&D Systems.
Detection of ALCAM/CD166 by Flow Cytometry
In vitro maintenance and expansion of CoCSC.Human ESA+CD44+CD166+ cells were plated in limiting dilution and cultured for fourteen days in serum-free maintenance conditions. Colorectal tumor colonies were then either analyzed for A) ESA expression by IHC, or B) ESA, CD44 and CD166 expression by flow cytometry. C) Cellular phenotype of single colony-derived tumors, showing human ESA+ cell subpopulations expressing CD44 and CD166. D) Tumor growth curves are shown for either 2,000 CoCSC phenotype cells or an equal number of cells with all other phenotypes (Other), which were isolated from in vitro colony-derived tumors (tumors/animals injected). Inset shows lentiviral insertion band obtained by inverse PCR of 1) human xenograft tumor cells, 2) ESA+CD44+CD166+ (CoCSC) cells or 3) ESA+CD44− (Other) cells isolated by FACS. Phenotypic and morphological analysis of single-cell derived tumors from serially transplanted CoCSC show that the diverse E) phenotype and F) histological makeup of xenogeneic colorectal tumors are maintained following brief in vitro culture in limiting dilution. Black bar = 100 µm. Image collected and cropped by CiteAb from the following open publication (https://pubmed.ncbi.nlm.nih.gov/18560594), licensed under a CC-BY license. Not internally tested by R&D Systems.
Detection of ALCAM/CD166 by Flow Cytometry
In vitro maintenance and expansion of CoCSC.Human ESA+CD44+CD166+ cells were plated in limiting dilution and cultured for fourteen days in serum-free maintenance conditions. Colorectal tumor colonies were then either analyzed for A) ESA expression by IHC, or B) ESA, CD44 and CD166 expression by flow cytometry. C) Cellular phenotype of single colony-derived tumors, showing human ESA+ cell subpopulations expressing CD44 and CD166. D) Tumor growth curves are shown for either 2,000 CoCSC phenotype cells or an equal number of cells with all other phenotypes (Other), which were isolated from in vitro colony-derived tumors (tumors/animals injected). Inset shows lentiviral insertion band obtained by inverse PCR of 1) human xenograft tumor cells, 2) ESA+CD44+CD166+ (CoCSC) cells or 3) ESA+CD44− (Other) cells isolated by FACS. Phenotypic and morphological analysis of single-cell derived tumors from serially transplanted CoCSC show that the diverse E) phenotype and F) histological makeup of xenogeneic colorectal tumors are maintained following brief in vitro culture in limiting dilution. Black bar = 100 µm. Image collected and cropped by CiteAb from the following open publication (https://pubmed.ncbi.nlm.nih.gov/18560594), licensed under a CC-BY license. Not internally tested by R&D Systems.Applications for Human ALCAM/CD166 Antibody (105902) [PE]
Flow Cytometry
Sample: Human whole blood monocytes
Spectra Viewer
Plan Your Experiments
Use our spectra viewer to interactively plan your experiments, assessing multiplexing options. View the excitation and emission spectra for our fluorescent dye range and other commonly used dyes.
Spectra Viewer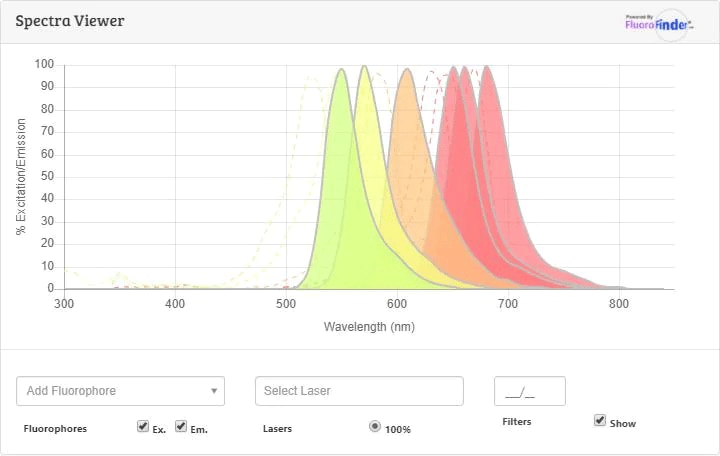
Flow Cytometry Panel Builder
Bio-Techne Knows Flow Cytometry
Save time and reduce costly mistakes by quickly finding compatible reagents using the Panel Builder Tool.
Advanced Features
- Spectra Viewer - Custom analysis of spectra from multiple fluorochromes
- Spillover Popups - Visualize the spectra of individual fluorochromes
- Antigen Density Selector - Match fluorochrome brightness with antigen density

Formulation, Preparation, and Storage
Purification
Formulation
Shipping
Stability & Storage
Background: ALCAM/CD166
References
- Bowen, M.A. et al. (1995) J. Exp. Med. 181:2213.
- Aruffo, A. et al. (1997) Immunol. Today 18:498.
- Degen, W.G. et al. (1998) Am. J. Pathol. 152:805.
Long Name
Alternate Names
Gene Symbol
UniProt
Additional ALCAM/CD166 Products
Product Documents for Human ALCAM/CD166 Antibody (105902) [PE]
Certificate of Analysis
To download a Certificate of Analysis, please enter a lot or batch number in the search box below.
Note: Certificate of Analysis not available for kit components.
Product Specific Notices for Human ALCAM/CD166 Antibody (105902) [PE]
For research use only
Related Research Areas
Citations for Human ALCAM/CD166 Antibody (105902) [PE]
 Powered by Bioz
Customer Reviews for Human ALCAM/CD166 Antibody (105902) [PE]
There are currently no reviews for this product. Be the first to review Human ALCAM/CD166 Antibody (105902) [PE] and earn rewards!
Have you used Human ALCAM/CD166 Antibody (105902) [PE]?
Submit a review and receive an Amazon gift card!
$25/€18/£15/$25CAN/¥2500 Yen for a review with an image
$10/€7/£6/$10CAN/¥1110 Yen for a review without an image
Submit a review
Protocols
Find general support by application which include: protocols, troubleshooting, illustrated assays, videos and webinars.
- 7-Amino Actinomycin D (7-AAD) Cell Viability Flow Cytometry Protocol
- Extracellular Membrane Flow Cytometry Protocol
- Flow Cytometry Protocol for Cell Surface Markers
- Flow Cytometry Protocol for Staining Membrane Associated Proteins
- Flow Cytometry Staining Protocols
- Flow Cytometry Troubleshooting Guide
- Intracellular Flow Cytometry Protocol Using Alcohol (Methanol)
- Intracellular Flow Cytometry Protocol Using Detergents
- Intracellular Nuclear Staining Flow Cytometry Protocol Using Detergents
- Intracellular Staining Flow Cytometry Protocol Using Alcohol Permeabilization
- Intracellular Staining Flow Cytometry Protocol Using Detergents to Permeabilize Cells
- Propidium Iodide Cell Viability Flow Cytometry Protocol
- Protocol for Liperfluo
- Protocol for the Characterization of Human Th22 Cells
- Protocol for the Characterization of Human Th9 Cells
- Protocol: Annexin V and PI Staining by Flow Cytometry
- Protocol: Annexin V and PI Staining for Apoptosis by Flow Cytometry
- Troubleshooting Guide: Fluorokine Flow Cytometry Kits
- View all Protocols, Troubleshooting, Illustrated assays and Webinars

