
Metabotropic glutamate receptor 1 (mGluR1) is a 130 kDa, 7-transmembrane glycoprotein that belongs to group I of the C-family of G-protein coupled receptors. On neurons, mGluR1 is postsynaptic, associates with Gq-like proteins, mobilizes intracellular Ca++, and influences ion channel activity. Mature mGluR1 is 1176 amino acids (aa) in length and contains a 574 aa N-terminal extracellular domain (ECD) (aa 19‑592). The ECD binds glutamate and forms either a covalent homodimer or heterodimer with CaSR. There is one alternative splice form for human mGluR1 that shows a 20 aa substitution for the C-terminal 308 amino acids. Over aa 33‑522, human mGluR1 shares more that 98% aa identity with mouse, rat and canine mGluR1.
Human mGluR1 Antibody
R&D Systems | Catalog # AF4836

Scientific images may be resized, cropped, or adjusted for brightness or contrast for presentation purposes. These updates are limited to presentation and do not affect the underlying scientific interpretation of the data. Where available, additional source data may be provided upon request.
Key Product Details
Species Reactivity
Validated:
Human
Cited:
Mouse
Applications
Validated:
Western Blot
Cited:
Immunohistochemistry-Frozen
Label
Unconjugated
Antibody Source
Polyclonal Sheep IgG
Loading...
Product Specifications
Immunogen
Chinese hamster ovary cell line CHO-derived recombinant human mGluR1
Ser33-Ser522
Accession # Q13255
Ser33-Ser522
Accession # Q13255
Specificity
Detects human mGluR1 in direct ELISAs and Western blots. In direct ELISAs and Western blots, less than 5% cross-reactivity with recombinant human (rh) mGluR4, rhmGluR8, rhmGluR2, rhmGluR3 and rhmGluR7 is observed.
Clonality
Polyclonal
Host
Sheep
Isotype
IgG
Scientific Data Images for Human mGluR1 Antibody
Detection of mGluR1 by Immunohistochemistry
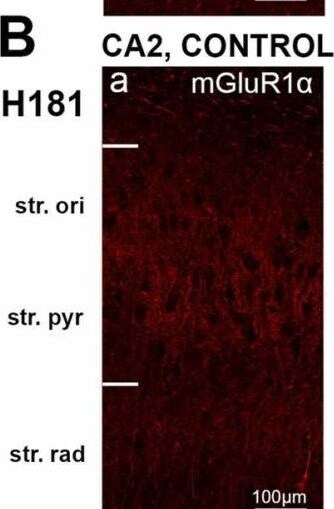
mGluR1 alpha expression and quantification of immunoreactivity in the hippocampus in human control and Alzheimer’s disease cases visualized by fluorescent immunohistochemistry. Photomicrographs of representative regions of the CA1(A), CA2 (B), CA3 (C), and dentate gyrus (D) showing mGluR1 alpha (red) and mGluR1 alpha overlaid with NeuN (green) immunoreactivity for representative Alzheimer’s disease and control cases. In the hippocampal CA2, CA3, and DG subfields, mGluR1 alpha density shows no statistically significant change in AD (white bars; n = 6) compared to control (black bars; n = 7) cases (Unpaired Mann-Whitney test). The figure shows a significant decrease in mGluR1 alpha expression in the stratum (str.) pyramidale (*p ≤ 0.05), and radiatum (**p ≤ 0.01) of the CA1 region in AD cases. Data is expressed as mean with individual data points representing single cases. AD = Alzheimer’s disease; CA = cornu ammonis; DG = dentate gyrus; str. ori = stratum oriens; str. pyr = stratum pyramidale; str. rad = stratum radiatum; str. mol = stratum moleculare; str. gran = stratum granulosum. Scale bars A-C= 100 µm; D = 50 µm. (For interpretation of the references to colour in this figure legend, the reader is referred to the web version of this article.) Image collected and cropped by CiteAb from the following open publication (https://pubmed.ncbi.nlm.nih.gov/36590090), licensed under a CC-BY license. Not internally tested by R&D Systems.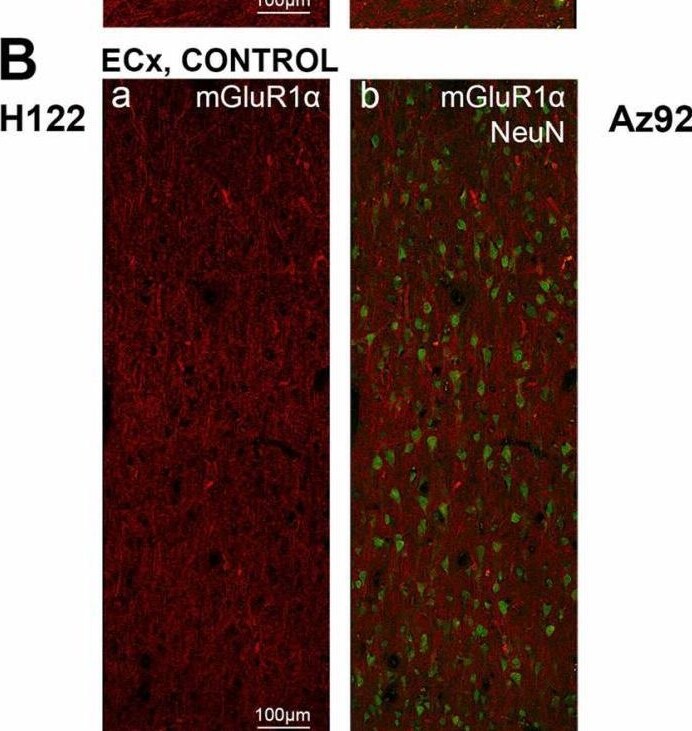
Detection of mGluR1 by Immunohistochemistry
mGluR1 alpha expression and quantification of immunoreactivity in the subiculum, entorhinal cortex and superior temporal gyrus in human control and Alzheimer’s disease cases. Photomicrographs of representative regions of the subiculum (A), entorhinal cortex (B), and superior temporal gyrus (C) showing mGluR1 alpha (red) and mGluR1 alpha overlaid with NeuN (green) immunoreactivity for representative Alzheimer’s disease and control cases. In the STG, mGluR1 alpha density shows no statistically significant change in AD (white bars; n = 6) compared to control (black bars; n = 7) cases (Unpaired Mann-Whitney test). The figure shows a significant decrease in mGluR1 alpha expression in the subiculum (*p ≤ 0.05) and entorhinal cortex (*p ≤ 0.05) in AD cases. Data is expressed as mean with individual data points representing single cases. AD = Alzheimer’s disease; ECx = entorhinal cortex: STG = superior temporal gyrus. Scale bars A-C = 100 µm. (For interpretation of the references to colour in this figure legend, the reader is referred to the web version of this article.) Image collected and cropped by CiteAb from the following open publication (https://pubmed.ncbi.nlm.nih.gov/36590090), licensed under a CC-BY license. Not internally tested by R&D Systems.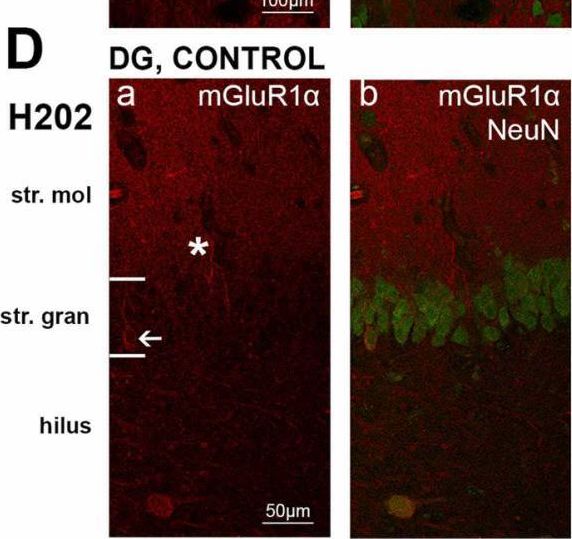
Detection of mGluR1 by Immunohistochemistry
mGluR1 alpha expression and quantification of immunoreactivity in the hippocampus in human control and Alzheimer’s disease cases visualized by fluorescent immunohistochemistry. Photomicrographs of representative regions of the CA1(A), CA2 (B), CA3 (C), and dentate gyrus (D) showing mGluR1 alpha (red) and mGluR1 alpha overlaid with NeuN (green) immunoreactivity for representative Alzheimer’s disease and control cases. In the hippocampal CA2, CA3, and DG subfields, mGluR1 alpha density shows no statistically significant change in AD (white bars; n = 6) compared to control (black bars; n = 7) cases (Unpaired Mann-Whitney test). The figure shows a significant decrease in mGluR1 alpha expression in the stratum (str.) pyramidale (*p ≤ 0.05), and radiatum (**p ≤ 0.01) of the CA1 region in AD cases. Data is expressed as mean with individual data points representing single cases. AD = Alzheimer’s disease; CA = cornu ammonis; DG = dentate gyrus; str. ori = stratum oriens; str. pyr = stratum pyramidale; str. rad = stratum radiatum; str. mol = stratum moleculare; str. gran = stratum granulosum. Scale bars A-C= 100 µm; D = 50 µm. (For interpretation of the references to colour in this figure legend, the reader is referred to the web version of this article.) Image collected and cropped by CiteAb from the following open publication (https://pubmed.ncbi.nlm.nih.gov/36590090), licensed under a CC-BY license. Not internally tested by R&D Systems.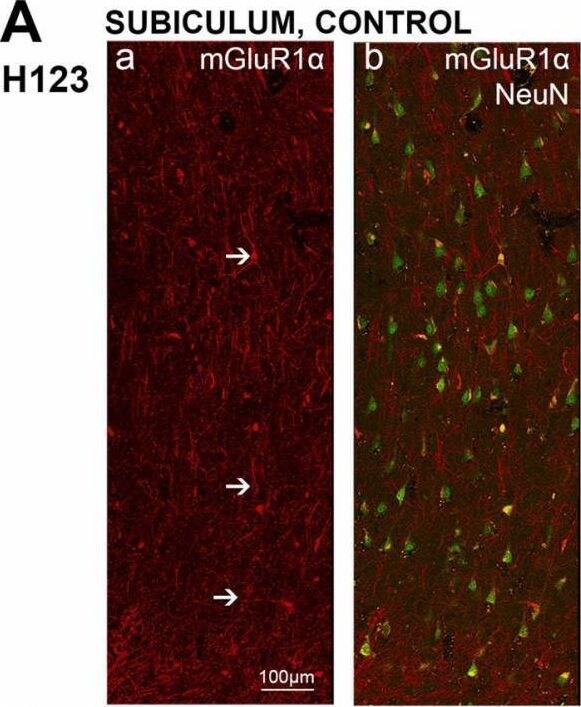
Detection of mGluR1 by Immunohistochemistry
mGluR1 alpha expression and quantification of immunoreactivity in the subiculum, entorhinal cortex and superior temporal gyrus in human control and Alzheimer’s disease cases. Photomicrographs of representative regions of the subiculum (A), entorhinal cortex (B), and superior temporal gyrus (C) showing mGluR1 alpha (red) and mGluR1 alpha overlaid with NeuN (green) immunoreactivity for representative Alzheimer’s disease and control cases. In the STG, mGluR1 alpha density shows no statistically significant change in AD (white bars; n = 6) compared to control (black bars; n = 7) cases (Unpaired Mann-Whitney test). The figure shows a significant decrease in mGluR1 alpha expression in the subiculum (*p ≤ 0.05) and entorhinal cortex (*p ≤ 0.05) in AD cases. Data is expressed as mean with individual data points representing single cases. AD = Alzheimer’s disease; ECx = entorhinal cortex: STG = superior temporal gyrus. Scale bars A-C = 100 µm. (For interpretation of the references to colour in this figure legend, the reader is referred to the web version of this article.) Image collected and cropped by CiteAb from the following open publication (https://pubmed.ncbi.nlm.nih.gov/36590090), licensed under a CC-BY license. Not internally tested by R&D Systems.Applications for Human mGluR1 Antibody
Application
Recommended Usage
Western Blot
0.1 µg/mL
Sample: Recombinant Human mGluR1a
Sample: Recombinant Human mGluR1a
Formulation, Preparation, and Storage
Purification
Antigen Affinity-purified
Reconstitution
Reconstitute at 0.2 mg/mL in sterile PBS. For liquid material, refer to CoA for concentration.
Loading...
Formulation
Lyophilized from a 0.2 μm filtered solution in PBS with Trehalose. *Small pack size (SP) is supplied either lyophilized or as a 0.2 µm filtered solution in PBS.
Shipping
Lyophilized product is shipped at ambient temperature. Liquid small pack size (-SP) is shipped with polar packs. Upon receipt, store immediately at the temperature recommended below.
Stability & Storage
Use a manual defrost freezer and avoid repeated freeze-thaw cycles.
- 12 months from date of receipt, -20 to -70 °C as supplied.
- 1 month, 2 to 8 °C under sterile conditions after reconstitution.
- 6 months, -20 to -70 °C under sterile conditions after reconstitution.
Calculators
Background: mGluR1
Long Name
Metabotropic Glutamate Receptor 1
Alternate Names
GPRC1A, GRM1
Gene Symbol
GRM1
UniProt
Additional mGluR1 Products
Product Documents for Human mGluR1 Antibody
Certificate of Analysis
To download a Certificate of Analysis, please enter a lot or batch number in the search box below.
Note: Certificate of Analysis not available for kit components.
Product Specific Notices for Human mGluR1 Antibody
For research use only
Related Research Areas
Citations for Human mGluR1 Antibody
 Powered by Bioz
Customer Reviews for Human mGluR1 Antibody
There are currently no reviews for this product. Be the first to review Human mGluR1 Antibody and earn rewards!
Have you used Human mGluR1 Antibody?
Submit a review and receive an Amazon gift card!
$25/€18/£15/$25CAN/¥2500 for a review with an image
$10/€7/£6/$10CAN/¥1110 for a review without an image
Submit a review
Protocols
Find general support by application which include: protocols, troubleshooting, illustrated assays, videos and webinars.
- Cellular Response to Hypoxia Protocols
- R&D Systems Quality Control Western Blot Protocol
- Troubleshooting Guide: Western Blot Figures
- Western Blot Conditions
- Western Blot Protocol
- Western Blot Protocol for Cell Lysates
- Western Blot Troubleshooting
- Western Blot Troubleshooting Guide
- View all Protocols, Troubleshooting, Illustrated assays and Webinars
Loading...
Associated Pathways
