
Key Product Details
Species Reactivity
Validated:
Human, Mouse
Cited:
Human, Mouse, Canine, Chicken, Equine, Transgenic Mouse
Applications
Validated:
Flow Cytometry, Immunocytochemistry, Immunoprecipitation, CyTOF-reported
Cited:
Immunohistochemistry, Immunohistochemistry-Paraffin, Western Blot, Flow Cytometry, Immunocytochemistry, Immunocytochemistry/ Immunofluorescence
Label
Unconjugated
Antibody Source
Monoclonal Mouse IgM Clone # MC-480
Loading...
Product Specifications
Immunogen
F9 mouse teratocarcinoma stem cells
Specificity
Detects human and mouse SSEA-1.
Clonality
Monoclonal
Host
Mouse
Isotype
IgM
Scientific Data Images for SSEA-1 Antibody (MC-480)
SSEA‑1 in D3 Mouse Cell Line.
SSEA‑1 was detected in immersion fixed D3 mouse embryonic stem cell line using 10 µg/mL Human/Mouse SSEA‑1 Monoclonal Antibody (Catalog # MAB2155) for 3 hours at room temperature. Cells were stained (red) and counterstained with DAPI (blue). View our protocol for Fluorescent ICC Staining of Cells on Coverslips.
Detection of SSEA‑1 in Whole blood granulocytes by Flow Cytometry.
Whole blood granulocytes cells were stained with Mouse Anti-Human/Mouse SSEA‑1 Monoclonal Antibody (Catalog # MAB2155, filled histogram) or isotype control antibody (open histogram), followed by Allophycocyanin-conjugated Anti-Mouse IgM Secondary Antibody (Catalog # F0117). View our protocol for Staining Membrane-associated Proteins.
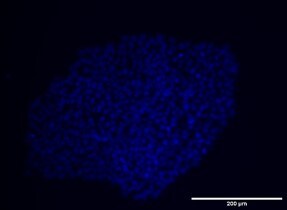
Detection of Mouse SSEA-1 by Immunocytochemistry/Immunofluorescence
Characteristics of mouse embryonic stem cells (mESCs) cultivated in 2i, R2i, and serum. Alkaline phosphatase (ALP) staining (scale bar: 100 µm) and immunofluorescence (IF) labeling for Oct4, SSEA-1, and Nanog counterstained for DAPI are shown (scale bar: 50 µm). Image collected and cropped by CiteAb from the following publication (https://pubmed.ncbi.nlm.nih.gov/29845793), licensed under a CC-BY license. Not internally tested by R&D Systems.
Detection of Canine SSEA-1 by Flow Cytometry
Flow cytometry. Comparison of cell surface proteins CD29, CD44, CD90, CD34, CD45, SSEA-1, SSEA-3, SSEA-4, TRA-1-60, and TRA-1-81 on primary cultures of BM-MSCs (A, C) and AT-MSCs (B, D). Solid histograms show nonspecific staining and open histograms show specific staining for the indicated marker. Three different donor MSC populations from each tissue type were analyzed and representative samples are shown. Image collected and cropped by CiteAb from the following publication (https://bmcvetres.biomedcentral.com/articles/10.1186/1746-6148-8-150), licensed under a CC-BY license. Not internally tested by R&D Systems.
Detection of Mouse Human/Mouse SSEA-1 Antibody by Immunocytochemistry/ Immunofluorescence
Characteristics of mouse embryonic stem cells (mESCs) cultivated in 2i, R2i, and serum. Alkaline phosphatase (ALP) staining (scale bar: 100 µm) and immunofluorescence (IF) labeling for Oct4, SSEA-1, and Nanog counterstained for DAPI are shown (scale bar: 50 µm). Image collected and cropped by CiteAb from the following publication (https://pubmed.ncbi.nlm.nih.gov/29845793), licensed under a CC-BY license. Not internally tested by R&D Systems.
Detection of Canine Human/Mouse SSEA-1 Antibody by Flow Cytometry
Flow cytometry. Comparison of cell surface proteins CD29, CD44, CD90, CD34, CD45, SSEA-1, SSEA-3, SSEA-4, TRA-1-60, and TRA-1-81 on primary cultures of BM-MSCs (A, C) and AT-MSCs (B, D). Solid histograms show nonspecific staining and open histograms show specific staining for the indicated marker. Three different donor MSC populations from each tissue type were analyzed and representative samples are shown. Image collected and cropped by CiteAb from the following publication (https://pubmed.ncbi.nlm.nih.gov/22937862), licensed under a CC-BY license. Not internally tested by R&D Systems.
Detection of Canine SSEA-1 by Flow Cytometry
Flow cytometry. Comparison of cell surface proteins CD29, CD44, CD90, CD34, CD45, SSEA-1, SSEA-3, SSEA-4, TRA-1-60, and TRA-1-81 on primary cultures of BM-MSCs (A, C) and AT-MSCs (B, D). Solid histograms show nonspecific staining and open histograms show specific staining for the indicated marker. Three different donor MSC populations from each tissue type were analyzed and representative samples are shown. Image collected and cropped by CiteAb from the following open publication (https://pubmed.ncbi.nlm.nih.gov/22937862), licensed under a CC-BY license. Not internally tested by R&D Systems.
Detection of Mouse SSEA-1 by Immunocytochemistry/ Immunofluorescence
Characteristics of mouse embryonic stem cells (mESCs) cultivated in 2i, R2i, and serum. Alkaline phosphatase (ALP) staining (scale bar: 100 µm) and immunofluorescence (IF) labeling for Oct4, SSEA-1, and Nanog counterstained for DAPI are shown (scale bar: 50 µm). Image collected and cropped by CiteAb from the following open publication (https://pubmed.ncbi.nlm.nih.gov/29845793), licensed under a CC-BY license. Not internally tested by R&D Systems.
Detection of SSEA-1 by Western Blot
Analysis of stem cell markers in tumor sample(A) Real-time quantitative PCR indicated there were no significant differences on stem cell markers expression between normal control animals and normoxia mice implanted with normoxia-treated cells; however, there were significant higher expression of stem cell markers in low oxygen feeding than control or normoxia feeding (*P > 0.05, *P < 0.05, One-way ANOVA). (B) Western blot analysis demonstrated that low oxygen feeding induced significantly increased levels of stem cell markers. (C) Gray value analysis of western-blot of B by Quantity One indicated the same results as real-time quantitative PCR (*P > 0.05, *P < 0.05, One-way ANOVA). Image collected and cropped by CiteAb from the following open publication (https://pubmed.ncbi.nlm.nih.gov/28427209), licensed under a CC-BY license. Not internally tested by R&D Systems.
Detection of Mouse SSEA-1 by Immunocytochemistry/ Immunofluorescence
Characteristics of mouse embryonic stem cells (mESCs) cultivated in 2i, R2i, and serum. Alkaline phosphatase (ALP) staining (scale bar: 100 µm) and immunofluorescence (IF) labeling for Oct4, SSEA-1, and Nanog counterstained for DAPI are shown (scale bar: 50 µm). Image collected and cropped by CiteAb from the following open publication (https://pubmed.ncbi.nlm.nih.gov/29845793), licensed under a CC-BY license. Not internally tested by R&D Systems.
Detection of Canine SSEA-1 by Flow Cytometry
Flow cytometry. Comparison of cell surface proteins CD29, CD44, CD90, CD34, CD45, SSEA-1, SSEA-3, SSEA-4, TRA-1-60, and TRA-1-81 on primary cultures of BM-MSCs (A, C) and AT-MSCs (B, D). Solid histograms show nonspecific staining and open histograms show specific staining for the indicated marker. Three different donor MSC populations from each tissue type were analyzed and representative samples are shown. Image collected and cropped by CiteAb from the following open publication (https://pubmed.ncbi.nlm.nih.gov/22937862), licensed under a CC-BY license. Not internally tested by R&D Systems.
Detection of SSEA-1 by Western Blot
Time-dependent expression of GSC markers following hypoxia(A) Real-time quantitative PCR indicated time-dependent changes of stem cell markers before (con) and after hypoxia in U87 glioma cells. In general, 6 h after hypoxia, there was a significant increase of stem cell markers, which reached peak values at 9–12 h. (*P < 0.05, One-sample T Test). (B) Western blot analysis indicated a higher expression of stem cell markers after hypoxia for 12–48 h in U87 glioma cells. (C) Gray value analysis of Western blot in B by Quantity One indicated the expression of stem cell markers (SOX-2, OCT-4, KLF-4, Nanog, CD133, CD15, NESTIN and ABCG2) increased at least two-fold compared with control (*P < 0.05, One-sample T Test). (D) An increase expression of CD133, CD15 and NESTIN with a time-dependent manner after hypoxia (*P < 0.05, One-sample T Test). Image collected and cropped by CiteAb from the following open publication (https://pubmed.ncbi.nlm.nih.gov/28427209), licensed under a CC-BY license. Not internally tested by R&D Systems.
Detection of Canine SSEA-1 by Flow Cytometry
Flow cytometry. Comparison of cell surface proteins CD29, CD44, CD90, CD34, CD45, SSEA-1, SSEA-3, SSEA-4, TRA-1-60, and TRA-1-81 on primary cultures of BM-MSCs (A, C) and AT-MSCs (B, D). Solid histograms show nonspecific staining and open histograms show specific staining for the indicated marker. Three different donor MSC populations from each tissue type were analyzed and representative samples are shown. Image collected and cropped by CiteAb from the following open publication (https://pubmed.ncbi.nlm.nih.gov/22937862), licensed under a CC-BY license. Not internally tested by R&D Systems.Applications for SSEA-1 Antibody (MC-480)
Application
Recommended Usage
CyTOF-reported
Lujan, E. et al. (2015) Nature 521: 352. Ready to be labeled using established conjugation methods. No BSA or other carrier proteins that could interfere with conjugation.
Flow Cytometry
0.25 µg/106 cells
Sample: Whole blood granulocytes
Sample: Whole blood granulocytes
Immunocytochemistry
8-25 µg/mL
Sample: Immersion fixed D3 mouse embryonic stem cell line
Sample: Immersion fixed D3 mouse embryonic stem cell line
Immunoprecipitation
Ballou, B. et al. (1979) Science 206:844.
Reviewed Applications
Read 2 reviews rated 4.5 using MAB2155 in the following applications:
Flow Cytometry Panel Builder
Bio-Techne Knows Flow Cytometry
Save time and reduce costly mistakes by quickly finding compatible reagents using the Panel Builder Tool.
Advanced Features
- Spectra Viewer - Custom analysis of spectra from multiple fluorochromes
- Spillover Popups - Visualize the spectra of individual fluorochromes
- Antigen Density Selector - Match fluorochrome brightness with antigen density

Formulation, Preparation, and Storage
Purification
IgM-specific Affinity-purified from hybridoma culture supernatant
Reconstitution
Reconstitute at 0.5 mg/mL in sterile PBS. For liquid material, refer to CoA for concentration.
Loading...
Formulation
Lyophilized from a 0.2 μm filtered solution in PBS with Trehalose. *Small pack size (SP) is supplied either lyophilized or as a 0.2 µm filtered solution in PBS.
Shipping
Lyophilized product is shipped at ambient temperature. Liquid small pack size (-SP) is shipped with polar packs. Upon receipt, store immediately at the temperature recommended below.
Stability & Storage
Use a manual defrost freezer and avoid repeated freeze-thaw cycles.
- 12 months from date of receipt, -20 to -70 °C as supplied.
- 1 month, 2 to 8 °C under sterile conditions after reconstitution.
- 6 months, -20 to -70 °C under sterile conditions after reconstitution.
Calculators
Background: SSEA-1
References
- Solter, D. and Knowles, B.B. (1978) Proc. Natl. Acad. Sci. USA 75:5565.
- Fox, N. et al. (1983) Cancer Res. 43:669.
Long Name
Stage-specific Embryonic Antigen-1
Alternate Names
SSEA1
Additional SSEA-1 Products
Product Documents for SSEA-1 Antibody (MC-480)
Certificate of Analysis
To download a Certificate of Analysis, please enter a lot or batch number in the search box below.
Note: Certificate of Analysis not available for kit components.
Product Specific Notices for SSEA-1 Antibody (MC-480)
For research use only
Related Research Areas
Citations for SSEA-1 Antibody (MC-480)
 Powered by Bioz
Customer Reviews for SSEA-1 Antibody (MC-480) (2)
4.5 out of 5
2 Customer Ratings
Have you used SSEA-1 Antibody (MC-480)?
Submit a review and receive an Amazon gift card!
$25/€18/£15/$25CAN/¥2500 Yen for a review with an image
$10/€7/£6/$10CAN/¥1110 Yen for a review without an image
Submit a review
Customer Images
Showing
1
-
2 of
2 reviews
Showing All
Filter By:
-
Application: Immunocytochemistry/ImmunofluorescenceSample Tested: iPS2 human induced pluripotent stem cellsSpecies: HumanVerified Customer | Posted 12/11/2020I used to check whether SSEA-1 is expressed in my iPSCs and it was great.. no background signal

-
Application: Flow CytometrySample Tested: See PMID 23736260Species: MouseVerified Customer | Posted 02/19/2015
There are no reviews that match your criteria.
Protocols
Find general support by application which include: protocols, troubleshooting, illustrated assays, videos and webinars.
- 7-Amino Actinomycin D (7-AAD) Cell Viability Flow Cytometry Protocol
- Appropriate Fixation of IHC/ICC Samples
- Cellular Response to Hypoxia Protocols
- ClariTSA™ Fluorophore Kits
- Detection & Visualization of Antibody Binding
- Extracellular Membrane Flow Cytometry Protocol
- Flow Cytometry Protocol for Cell Surface Markers
- Flow Cytometry Protocol for Staining Membrane Associated Proteins
- Flow Cytometry Staining Protocols
- Flow Cytometry Troubleshooting Guide
- ICC Cell Smear Protocol for Suspension Cells
- ICC Immunocytochemistry Protocol Videos
- ICC for Adherent Cells
- Immunocytochemistry (ICC) Protocol
- Immunocytochemistry Troubleshooting
- Immunofluorescence of Organoids Embedded in Cultrex Basement Membrane Extract
- Immunohistochemistry (IHC) and Immunocytochemistry (ICC) Protocols
- Immunoprecipitation Protocol
- Intracellular Flow Cytometry Protocol Using Alcohol (Methanol)
- Intracellular Flow Cytometry Protocol Using Detergents
- Intracellular Nuclear Staining Flow Cytometry Protocol Using Detergents
- Intracellular Staining Flow Cytometry Protocol Using Alcohol Permeabilization
- Intracellular Staining Flow Cytometry Protocol Using Detergents to Permeabilize Cells
- Preparing Samples for IHC/ICC Experiments
- Preventing Non-Specific Staining (Non-Specific Binding)
- Primary Antibody Selection & Optimization
- Propidium Iodide Cell Viability Flow Cytometry Protocol
- Protocol for Liperfluo
- Protocol for VisUCyte™ HRP Polymer Detection Reagent
- Protocol for the Characterization of Human Th22 Cells
- Protocol for the Characterization of Human Th9 Cells
- Protocol for the Fluorescent ICC Staining of Cell Smears - Graphic
- Protocol for the Fluorescent ICC Staining of Cultured Cells on Coverslips - Graphic
- Protocol for the Preparation and Fluorescent ICC Staining of Cells on Coverslips
- Protocol for the Preparation and Fluorescent ICC Staining of Non-adherent Cells
- Protocol for the Preparation and Fluorescent ICC Staining of Stem Cells on Coverslips
- Protocol for the Preparation of a Cell Smear for Non-adherent Cell ICC - Graphic
- Protocol: Annexin V and PI Staining by Flow Cytometry
- Protocol: Annexin V and PI Staining for Apoptosis by Flow Cytometry
- TUNEL and Active Caspase-3 Detection by IHC/ICC Protocol
- The Importance of IHC/ICC Controls
- Troubleshooting Guide: Fluorokine Flow Cytometry Kits
- View all Protocols, Troubleshooting, Illustrated assays and Webinars
Loading...