MAP2 Antibody - BSA Free
Novus Biologicals | Catalog # NB300-213

Loading...
Key Product Details
Validated by
Biological Validation
Species Reactivity
Validated:
Human, Mouse, Rat, Feline
Cited:
Human, Mouse, Rat
Applications
Validated:
Immunohistochemistry, Immunohistochemistry-Paraffin, Immunohistochemistry-Frozen, Western Blot, Immunocytochemistry/ Immunofluorescence, Knockdown Validated
Cited:
Immunohistochemistry-Frozen, Western Blot, Immunofluorescence, Immunocytochemistry/ Immunofluorescence, Proximity Ligation Assay, IF/IHC, Knockdown Validated
Label
Unconjugated
Antibody Source
Polyclonal Chicken IgY
Format
BSA Free
Loading...
Product Specifications
Immunogen
This MAP2 antibody was developed against a mix of recombinant human construct of projection domain sequences, amino acids 377-1505: Prot-r-MAP2-P1, Prot-r-MAP2-P2 and Prot-r-MAP2-P3.
Reactivity Notes
Rat reactivity reported in scientific literature (PMID: 32848625). Mouse reactivity reported in scientific literature (PMID: 33086056). Feline reactivity reported from a verified customer review.
Localization
Cytoskeleton
Marker
Neuronal Dendritic Marker
Specificity
This antibody was raised against recombinant constructs of the entire human projection domain, and so recognizes the high molecular MAP2 forms, MAP2A and MAP2B.
Clonality
Polyclonal
Host
Chicken
Isotype
IgY
Theoretical MW
199 kDa.
Disclaimer note: The observed molecular weight of the protein may vary from the listed predicted molecular weight due to post translational modifications, post translation cleavages, relative charges, and other experimental factors.
Disclaimer note: The observed molecular weight of the protein may vary from the listed predicted molecular weight due to post translational modifications, post translation cleavages, relative charges, and other experimental factors.
Scientific Data Images for MAP2 Antibody - BSA Free
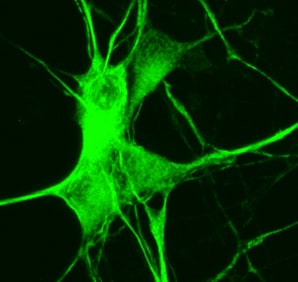
Immunocytochemistry/Immunofluorescence Staining of MAP2 in Mouse Primary Cultures
Mouse primary cultures stained with MAP2 antibody. ICC/IF image submitted by a verified customer review.
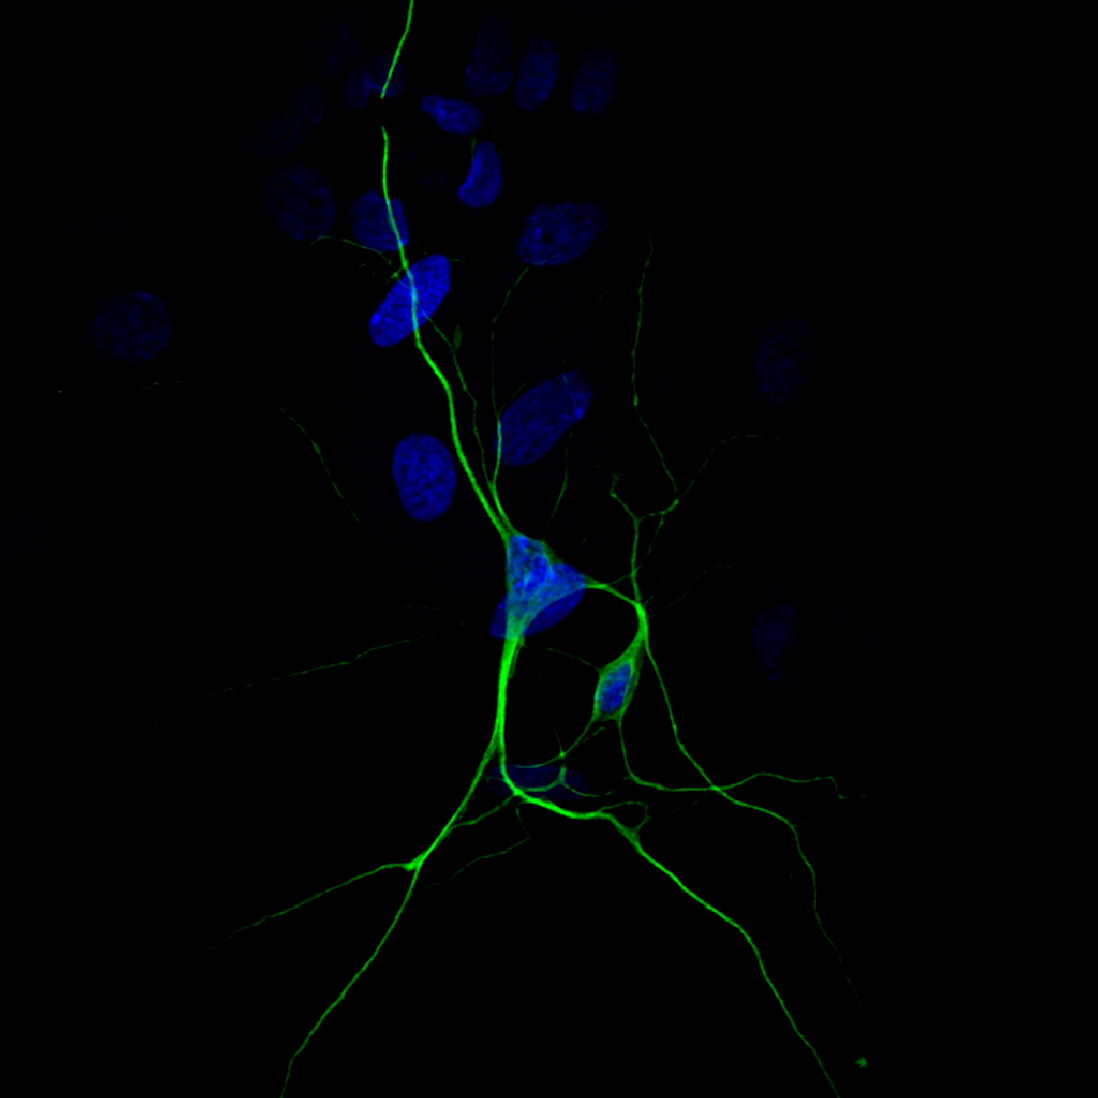
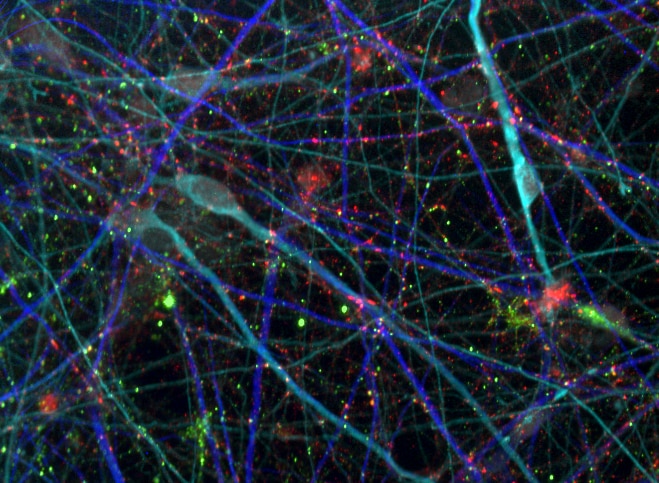
Immunocytochemistry/Immunofluorescence Staining of MAP2 in Rat Cortical Neuron-Glial Cells
Immunofluorescent analysis of cortical neuron-glial cell culture from E20 rat stained with chicken pAb to microtubule associated protein 2 (MAP2), NB300-213, dilution 1:10,000 in red, and mouse mAb to MAP-tau, NPB2-25162, dilution 1:2,000, in green. The blue is DAPI staining of nuclear DNA. NB300-213 antibody stains dendrites and perikarya of neurons, while NBP2-25162 antibody labels neuronal perikarya, dendrites and also axonal process. As a result perikarya and dendrites appears orange-yellow, since they contain both MAP2 and tau, while axons are green.
Western Blot Detection of MAP2 in Rat Brain Tissue Lysates
Western blot analysis of whole brain tissue lysates using chicken pAb to microtubule associated protein 2 (MAP2), NB300-213, dilution 1:50,000 in green: [1] protein standard (red), [2] adult rat brain, [3] embryonic E20 rat brain, [4] adult mouse brain. Strong band observed at ~280 kDa mark corresponds to two major isoforms of MAP2 protein referred to as MAP2A and MAP2B. Smaller fragments of these isoforms are also detected if the antibody is used at higher concentrations.
Immunofluorescent Analysis of MAP2 in Treated Rat Hippocampi
PEA decreases astrocyte activation in organotypic cultures of rat hippocampi and rescues neuronal CA3 damage caused by Abeta challenge. Abeta-challenged (1 ug/ml) slices of rat hippocampi were treated for 24 hours with PEA (0.1 uM) in the presence of the selective PPAR? antagonist (GW9662, 9 nM) or the selective PPARalpha antagonist (MK886, 3 uM). Representative photomicrographs of the CA3 region showing the results of immunofluorescence experiments aimed at investigating the effect of treatments on astrocyte activation and neuronal loss, as determined by immunostaining for GFAP (green) and MAP2 (red) alone or merged, respectively. Nuclei were stained with Hoechst (blue). Scale bar: 10 um. Arrows in the photomicrographs indicate astrocyte infiltration events and apoptotic condensation in the nuclei of adjacent neurons.
Immunocytochemistry/Immunofluorescence Staining of MAP2 in Human iPS Derived Neurons
Human iPS derived neurons labeled with MAP2 (in green) at 1:5000 dilution. Image from verified customer review.
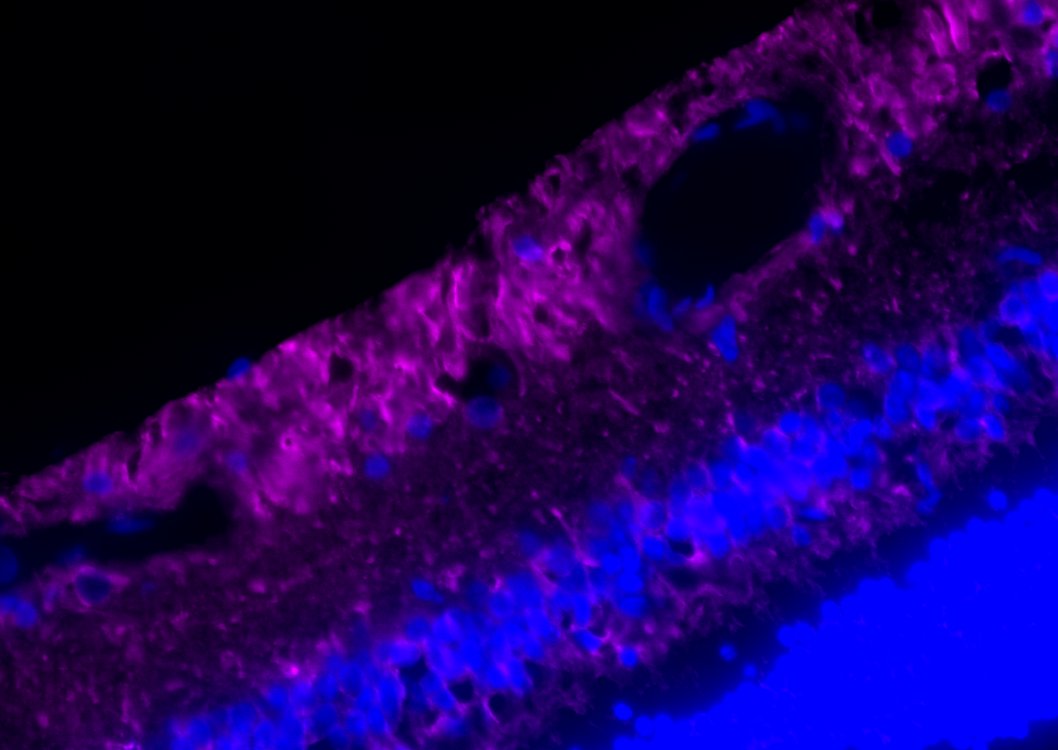
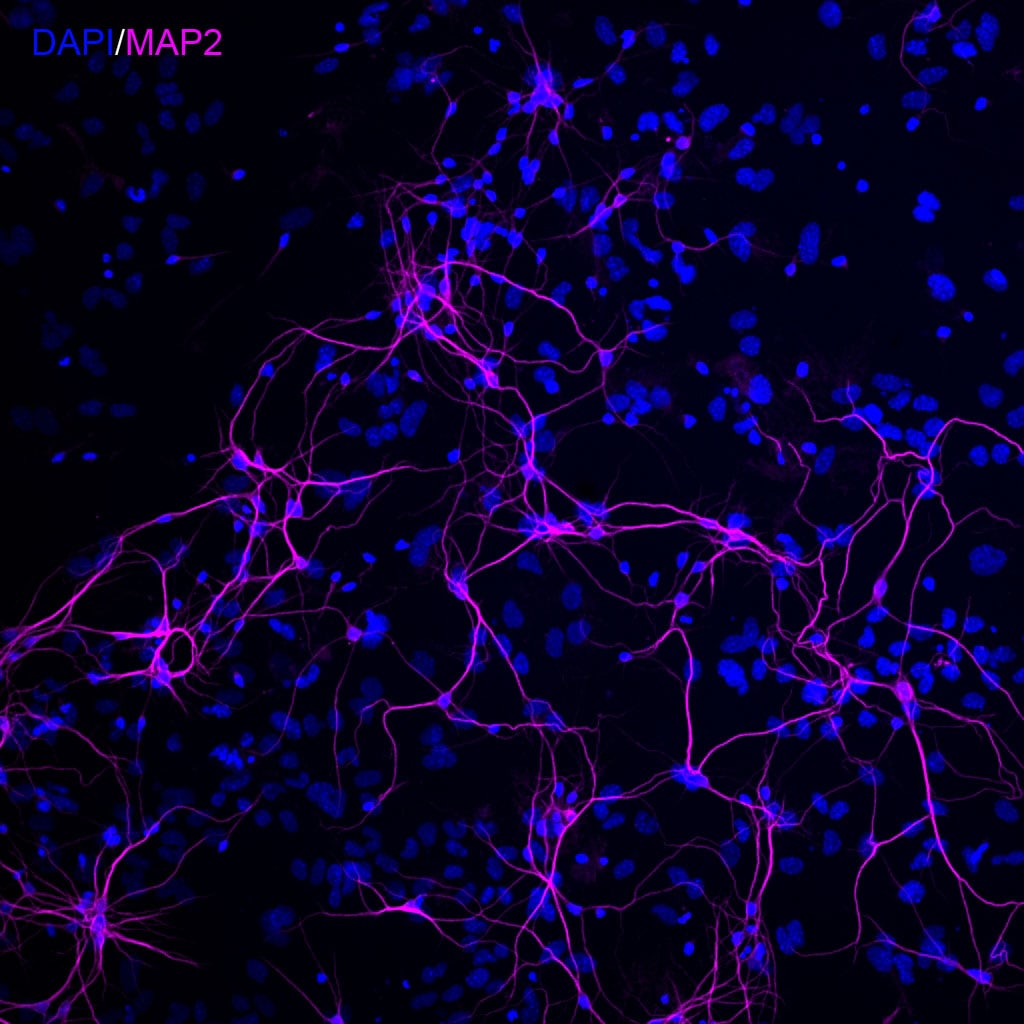
Immunohistochemical Analysis of MAP2 in Frozen Retina
MAP2 in the retina detected by NB300-213 antibody (magenta). DAPI (blue). Image from verified customer review.
Immunocytochemistry/Immunofluorescence Staining of MAP2 in Human DA Neurons
Human DA neurons 28 DIV stained with MAP2 antibody (blue). ICC/IF image submitted by a verified customer review.

Immunohistochemical Staining of MAP2 in Paraffin Embedded Mouse Hippocampus
MAP2-Antibody-Immunohistochemistry-Paraffin-NB300-213-img0011.jpg
Immunohistochemical Staining of MAP2 in Paraffin Embedded Mouse Hippocampus
MAP2-Antibody-Immunohistochemistry-Paraffin-NB300-213-img0010.jpg
Western Blot: MAP2 Antibody [NB300-213] -
ATM activation by chloroquine alleviates senescence.(a) Immunoblots showing protein levels of ATM, NBS1, and RAP80 in human skin fibroblasts (HSFs). A gradually increased level of p16 indicates cellular senescence, while elevated gamma H2AX level indicates accumulated DNA damage. (b) Immunoblots showing protein levels of ATM, NBS1, and RAP80 in mouse embryonic fibroblasts (MEFs). (c) Immunoblots showing protein levels of ATM, NBS1, and RAP80 in brain tissues isolated from 3-, 10-, and 18-month-old male mice. (d) SA-beta -Gal staining in HSFs treated with sh-ATM or scramble shRNA. Scale bar, 100 µm. (e) Quantification of SA-beta -Gal-positive staining of (d) from five views randomly captured for each group. Data represent means ± SEM. ***p<0.001. (f) Immunoblots showing increased gamma H2AX and unaffected LC3I/II in HSFs treated with sh-ATM or scramble shRNA. (g) Immunoblots showing protein levels of pS1981 ATM, gamma H2AX, and cleaved caspase-3 in HSFs treated with 10 μM of CQ for indicated time. (h) SA-beta -Gal staining in HSFs expressing either scramble or ATM shRNA treated with 1 μM CQ or DMSO (12 hr). Scale bar, 100 µm. (i) Quantification of SA-beta -Gal-positive staining of (h) from five views randomly captured for each group. Data represent means ± SEM. ***p<0.001; ‘N.S.’ indicates no significant difference. (j) HSFs at passage 20 were continuously cultured with 1 μM CQ or DMSO, and cell number was calculated at each passage. Data represent means ± SEM. ***p<0.01. (k) Immunoblots showing protein levels of gamma H2AX, p62, and LC3 in MEFs treated with 1 μM CQ or DMSO. Note that CQ had little effect on the expression levels of p62 and LC3. (l) MEFs at passage one were continuously cultured in 20% O2 with 1 μM CQ or DMSO, and cell number was determined at each passage. Data represent means ± SEM. ***p<0.01.10.7554/eLife.34836.006Figure 1—source data 1.Statistical analysis for SA-beta -Gal positive staining.10.7554/eLife.34836.007Figure 1—source data 2.Statistical analysis for EdU positive staining.Sta
Immunocytochemistry/ Immunofluorescence: MAP2 Antibody [NB300-213] -
Immunocytochemistry/ Immunofluorescence: MAP2 Antibody [NB300-213] - SUMO1 conjugates are not localized to amyloid plaques. (a) Sagittal brain sections of 24‐week‐old KI/AD & WT/AD animals were stained using anti‐HA antibodies (red), 6E10 antibodies (green) that label amyloid beta 1–42 among other amyloid beta variants (epitope lies within amino acids 3–8 of amyloid beta) & anti‐MAP2 antibodies (blue). Sections of the hippocampal subiculum are shown. Images are representatives of three independent experiments. Scale bar, 25 μm. (b) Anti‐HA signal intensity in amyloid plaques & in cell nuclei was quantified using ImageJ (N = 3, ***significance between WT/AD & KI/AD, p = .0007 in Student's t test) Image collected & cropped by CiteAb from the following publication (https://pubmed.ncbi.nlm.nih.gov/29633471), licensed under a CC-BY license. Not internally tested by Novus Biologicals.
Immunocytochemistry/ Immunofluorescence: MAP2 Antibody [NB300-213] -
Immunocytochemistry/ Immunofluorescence: MAP2 Antibody [NB300-213] - Oxytocin receptors (Oxtr) are expressed in mouse hippocampus.(a & b) Coronal sections of the hippocampus (a) & striatum (b) from OxtrVn/+ & Oxtr+/+ mice stained for Venus & DAPI (ac, anterior commisure; cx, cortex; hip, hippocampus; str, striatum). (c) Confocal images of rostral Oxtr+/+ & OxtrVn/+ brain sections including hippocampus, double-labeled for Venus (green) & NeuN (red). (d) Confocal images of Oxtr-expressing neurons in the CA1 subfields of the medial & caudal hippocampus from OxtrVn/+ sections, triple stained with antibodies directed against NeuN (red), MAP2 (magenta), & Venus (green). (e) Representative images of hippocampal mass cultures obtained from OxtrVn/+ mice at P0 mice & processed for immunofluorescence staining at 5, 10, & 14 DIV using antibodies to Venus (green) & GAD67 (red), & DAPI (blue). (f) Quantitative analysis of Venus-positive neurons with (GAD67+) & without colabeling for GAD67 (GAD67-) in hippocampal mass cultures obtained from OxtrVn/+ mice at P0 mice & processed for immunofluorescence staining at 5, 10, & 14 DIV. Data are shown as mean ± SEM.DOI:http://dx.doi.org/10.7554/eLife.22466.015 Image collected & cropped by CiteAb from the following publication (https://pubmed.ncbi.nlm.nih.gov/28231043), licensed under a CC-BY license. Not internally tested by Novus Biologicals.
Immunocytochemistry/ Immunofluorescence: MAP2 Antibody [NB300-213] -
Immunocytochemistry/ Immunofluorescence: MAP2 Antibody [NB300-213] - SUMO1 conjugates remain nuclear during increased amyloid burden. (a) Western blot analysis of subcellular fractions of 36‐week‐old KI/WT & KI/AD mouse brain using anti‐HA antibody (upper two panels) & antibodies to GluN1 (a marker of the postsynaptic compartment) & Synaptophysin (a marker of the presynaptic compartment) to validate the fractionation procedure (lower two panels). H, homogenate; P1, nuclear pellet; S1, supernatant after P1 sedimentation; P2, crude synaptosomal pellet; S2, supernatant after P2 sedimentation; LP1, lysed synaptosomal membranes; LS1, supernatant after LP1 sedimentation; LP2, pellet after LS1 sedimentation, SPM, synaptic plasma membranes. Bracket indicates the anti‐HA signal representing SUMOylation, arrow indicates RanGAP1, stars indicate nonspecific signal detected by the anti‐HA antibody. (b) Brain sagittal sections of aged (36 weeks old) KI/AD (left panels) & WT/AD (right panels) mice were immunostained using antibodies directed against HA (red, labels HA‐HA conjugates), MAP2 (green, labels neuronal somata & dendrites), & Synapsin1 (Syn1, magenta, labels synapses). The images show triple‐labeled neurons of hippocampal subiculum (b), cortical layer 5 (c), & proximal apical dendrite from hippocampal CA3 (d). The white line shows the orientation of the line‐scan used to generate the image stack shown in the bottom side view. Scale bar: 10 μm. Note that the anti‐HA immunosignal is mainly located in neuronal nuclei, only background staining is observed in WT/AD mice. Little anti‐HA signal is observed along MAP2‐positive structures & does not colocalize with Synapsin1 Image collected & cropped by CiteAb from the following publication (https://pubmed.ncbi.nlm.nih.gov/29633471), licensed under a CC-BY license. Not internally tested by Novus Biologicals.
Immunocytochemistry/ Immunofluorescence: MAP2 Antibody [NB300-213] -
Immunocytochemistry/ Immunofluorescence: MAP2 Antibody [NB300-213] - Validation of the CRISPR/Cas9 Alsin-/- cells in iPSC, NPC & iPSC-sMN.(A) Electrophoresis result of the PCR reaction using primers flanking exon three & within exon 3. Homozygous deletion was confirmed by the absence of a 2.8 kb. (B) Protein lysates from WT KOLF & Alsin-/- iPSC were loaded onto SDS-PAGE & immunoblotted with Alsin antibody. A band detected at ~184 kDa, but absent in Alsin-/-, corresponds to full-length Alsin. (C) WT KOLF, Alsin-/- iPSC, & neuroprogenitor cells (NPC) were immunostained with pluripotency markers Oct4 & Lin28, & neuroprogenitor markers Sox2 & Pax6, respectively. (D–E) WT KOLF & Alsin-/- iPSC-sMN were immunostained with motor neuron markers such as ChAT, HB9, & ISL1, nuclear dye DAPI, & cytoskeletal marker MAP2. (F) WT KOLF & Alsin-/- iPSC-sMN were immunostained with antibodies against Rab5 & Alsin, along with DAPI (nuclear) & phalloidin (actin) stains. Scale bars, 10 μm. Image collected & cropped by CiteAb from the following publication (https://pubmed.ncbi.nlm.nih.gov/29469808), licensed under a CC-BY license. Not internally tested by Novus Biologicals.
Immunocytochemistry/ Immunofluorescence: MAP2 Antibody [NB300-213] -
Immunocytochemistry/ Immunofluorescence: MAP2 Antibody [NB300-213] - PEA decreases astrocyte activation in organotypic cultures of rat hippocampi & rescues neuronal CA3 damage caused by A beta challenge. A beta -challenged (1 μg/ml) slices of rat hippocampi treated for 24 hours w/ PEA (0.1 μM) in presence of selective PPAR gamma antagonist (GW9662, 9 nM) or selective PPAR alpha antagonist (MK886, 3 μM). (A) Nissl staining showing effect of treatment on morphology of organotypic hippocampal slices. Scale bar: 80 μm. A beta caused a marked neuronal loss, mainly in CA3 region of hippocampus, as highlighted by arrows. PEA able to reverse this effect. (B) Representative photomicrographs of CA3 region showing Results of immunofluorescence experiments aimed at investigating effect of treatments on astrocyte activation & neuronal loss, as determined by immunostaining for GFAP (green) & MAP2 (red) alone or merged, respectively. Nuclei stained w/ Hoechst (blue). Scale bar: 10 μm. Arrows in photomicrographs indicate astrocyte infiltration events & apoptotic condensation in nuclei of adjacent neurons. (C) Relative quantification of GFAP-positive cell number as a count of astrocyte proliferation. (D) Apoptotic events detected on MAP2-expressing cells as an indication of neuronal death. For (C) & (D), average value determined by counting cells in at least five microscopic fields for each treatment. Results are presented as means ± SEM of four separate experiments. At least four slices from each experimental group observed for each experiment. Statistical analysis performed using parametric one-way analysis of variance, & multiple comparisons performed using Bonferroni test. ***P < 0.001 & *P < 0.05 vs. control; ∘∘P < 0.01 & ∘P < 0.05 vs. A beta -challenge slices. Image collected & cropped by CiteAb from following publication (https://jneuroinflammation.biomedcentral.com/articles/10.1186/1742-2094…), licensed under a CC-BY license. Not internally tested by Novus Biologicals.
Immunocytochemistry/ Immunofluorescence: MAP2 Antibody [NB300-213] -
Immunocytochemistry/ Immunofluorescence: MAP2 Antibody [NB300-213] - PEA inhibits astroglial proliferation & reduces neuronal loss in mixed neuroglia co-cultures exposed to A beta. A beta -challenged (1 μg/ml) astrocyte/neuron mixed cultures were treated with PEA (0.1 μM) in the presence of the selective PPAR gamma antagonist (GW9662, 9 nM) or the selective PPAR alpha antagonist (MK886, 3 μM). After 24 hours of treatment, cells were processed for analyses. (A) Immunofluorescence photomicrographs showing the effect of the treatments on astrocyte proliferation & neuronal loss, as determined by immunostaining for GFAP (green) & MAP2 (red), respectively. Arrows indicate chromatin condensation in nuclei stained with Hoechst dye (blue) as markers of apoptotic events. Scale bar: 10 μm. (B) Relative quantification of GFAP-positive cell number as a count of astrocyte proliferation. (C) Apoptotic events detected on MAP2-expressing cells as an indication of neuronal death. For (B) & (C), the average value was determined by counting cells in at least nine microscopic fields for each treatment. Results are presented as means ± SEM of three separate experiments. Statistical analysis was performed using parametric one-way analysis of variance, & multiple comparisons were performed using the Bonferroni test. ***P < 0.001 vs. unstimulated cells, ∘∘P < 0.01 & ∘P < 0.05 vs. A beta -stimulated cultures. Image collected & cropped by CiteAb from the following publication (https://jneuroinflammation.biomedcentral.com/articles/10.1186/1742-2094…), licensed under a CC-BY license. Not internally tested by Novus Biologicals.Applications for MAP2 Antibody - BSA Free
Application
Recommended Usage
Immunocytochemistry/ Immunofluorescence
1:5000-1:10000
Immunohistochemistry
1:1000-1:5000
Immunohistochemistry-Frozen
1:1000-1:5000
Western Blot
1:10000-1:20000
Reviewed Applications
Read 7 reviews rated 5 using NB300-213 in the following applications:
Formulation, Preparation, and Storage
Purification
IgY purified
Formulation
Supplied as a concentrated total IgY preparation from egg yolk, dialyzed against PBS with added preservative.
Format
BSA Free
Preservative
0.035% Sodium Azide
Concentration
Please see the vial label for concentration. If unlisted please contact technical services.
Shipping
The product is shipped with polar packs. Upon receipt, store it immediately at the temperature recommended below.
Stability & Storage
Store at 4C short term. Aliquot and store at -20C long term. Avoid freeze-thaw cycles.
Background: MAP2
MAP2 isoforms are developmentally regulated and differentially expressed in neurons and some glia. MAP2c is predominantly expressed in the developing brain while the other isoforms are expressed in the adult brain. The distribution of MAP2 isoforms also varies, with MAP2a and MAP2b predominantly localized to dendrites, while MAP2c is also found in axons. Lastly, the expression of MAP2d is not limited to neurons and may be found in glia, specifically oligodendrocytes (1, 2). MAP2 isoforms associate with microtubules and mediate their interaction with actin filaments thereby playing a critical role in organizing the microtubule-actin network. In neurons, MAP2 isoforms are implicated in different processes including neurite initiation, elongation and stabilization as well as axon and dendrite formation (2). Knockout of MAP expression in animal models results in a variety of functional and structural brain defects according to the isoform affected (e.g., reduced LTP and LTD, reduced myelination, absence of corpus collosum, motor system malfunction, abnormal hippocampal dendritic morphology, abnormal synaptic plasticity) (4).
References
1. Dehmelt, L., & Halpain, S. (2005). The MAP2/Tau family of microtubule-associated proteins. Genome Biology. https://doi.org/10.1186/gb-2004-6-1-204
2. Mohan, R., & John, A. (2015). Microtubule-associated proteins as direct crosslinkers of actin filaments and microtubules. IUBMB Life. https://doi.org/10.1002/iub.1384
3. Shafit-Zagardo, B., & Kalcheva, N. (1998). Making sense of the multiple MAP-2 transcripts and their role in the neuron. Molecular Neurobiology. https://doi.org/10.1007/BF02740642
4. Tortosa, E., Kapitein, L. C., & Hoogenraad, C. C. (2016). Microtubule organization and microtubule-associated proteins (MAPs). In Dendrites: Development and Disease. https://doi.org/10.1007/978-4-431-56050-0_3
Long Name
Microtubule-associated Protein 2
Alternate Names
DKFZp686I2148, MAP-2, MAP2A, MAP2B, MAP2C, Microtubule Associated Protein 2, microtubule-associated protein 2, MTAP2
Gene Symbol
MAP2
UniProt
Additional MAP2 Products
Product Documents for MAP2 Antibody - BSA Free
Certificate of Analysis
To download a Certificate of Analysis, please enter a lot or batch number in the search box below.
Product Specific Notices for MAP2 Antibody - BSA Free
Chicken products cannot be exported to Canada.
This product is for research use only and is not approved for use in humans or in clinical diagnosis. Primary Antibodies are guaranteed for 1 year from date of receipt.
Related Research Areas
Citations for MAP2 Antibody - BSA Free
 Powered by Bioz
Customer Reviews for MAP2 Antibody - BSA Free (7)
5 out of 5
7 Customer Ratings
Have you used MAP2 Antibody - BSA Free?
Submit a review and receive an Amazon gift card!
$25/€18/£15/$25CAN/¥2500 Yen for a review with an image
$10/€7/£6/$10CAN/¥1110 Yen for a review without an image
Submit a review
Customer Images
Showing
1
-
5 of
7 reviews
Showing All
Filter By:
-
Application: ImmunocytochemistrySample Tested: human iPS cortical neuronsSpecies: HumanVerified Customer | Posted 12/08/2022Human iPS derived neuronsHuman iPS derived neurons labeled with MAP2 (in green) at 1:5000 dilution.

-
Application: Immunohistochemistry-FrozenSample Tested: RetinaSpecies: FelineVerified Customer | Posted 11/19/2022MAP2 in the retina detected by NB300-213 antibody (magenta). DAPI (blue).
Bio-Techne ResponseThis review was submitted through the legacy Novus Innovators Program, reflecting a new species or application tested on a primary antibody.
-
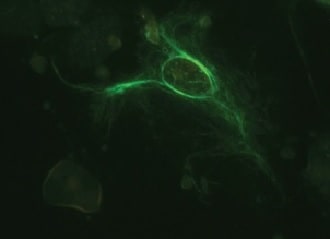
Application: Immunohistochemistry-FrozenSample Tested: AstrocytesSpecies: MouseVerified Customer | Posted 07/29/2021MAP2, astrocytes
-
Application: ImmunocytochemistrySample Tested: Cultured motor neuronsSpecies: RatVerified Customer | Posted 11/01/2017Excellent antibodyUsed at a dilution of 1:2500. incubated at 4 degrees overnight. Robust staining
-
Application: ImmunocytochemistrySample Tested: Mouse primary culturesSpecies: MouseVerified Customer | Posted 11/22/2016We also used Novus anti-chicken-680 as the secondary antibody.1:1000 dilution
-
Application: ImmunofluorescenceSample Tested: Rat and Human.Species: HumanVerified Customer | Posted 01/22/2016Human DA neurons 28 DIV stained with chick MAP2 antibody (NB300-213) (blue). PFA/MetOH fixed, used at 1:2000 dilution.
-
Application: Immunohistochemistry-FrozenSample Tested: Rat brain tissueSpecies: RatVerified Customer | Posted 12/07/2010
There are no reviews that match your criteria.
Protocols
Find general support by application which include: protocols, troubleshooting, illustrated assays, videos and webinars.
- Antigen Retrieval Protocol (PIER)
- Antigen Retrieval for Frozen Sections Protocol
- Appropriate Fixation of IHC/ICC Samples
- Cellular Response to Hypoxia Protocols
- Chromogenic IHC Staining of Formalin-Fixed Paraffin-Embedded (FFPE) Tissue Protocol
- Chromogenic Immunohistochemistry Staining of Frozen Tissue
- ClariTSA™ Fluorophore Kits
- Detection & Visualization of Antibody Binding
- Fluorescent IHC Staining of Frozen Tissue Protocol
- Graphic Protocol for Heat-induced Epitope Retrieval
- Graphic Protocol for the Preparation and Fluorescent IHC Staining of Frozen Tissue Sections
- Graphic Protocol for the Preparation and Fluorescent IHC Staining of Paraffin-embedded Tissue Sections
- Graphic Protocol for the Preparation of Gelatin-coated Slides for Histological Tissue Sections
- ICC Cell Smear Protocol for Suspension Cells
- ICC Immunocytochemistry Protocol Videos
- ICC for Adherent Cells
- IHC Sample Preparation (Frozen sections vs Paraffin)
- Immunocytochemistry (ICC) Protocol
- Immunocytochemistry Troubleshooting
- Immunofluorescence of Organoids Embedded in Cultrex Basement Membrane Extract
- Immunofluorescent IHC Staining of Formalin-Fixed Paraffin-Embedded (FFPE) Tissue Protocol
- Immunohistochemistry (IHC) and Immunocytochemistry (ICC) Protocols
- Immunohistochemistry Frozen Troubleshooting
- Immunohistochemistry Paraffin Troubleshooting
- Preparing Samples for IHC/ICC Experiments
- Preventing Non-Specific Staining (Non-Specific Binding)
- Primary Antibody Selection & Optimization
- Protocol for Heat-Induced Epitope Retrieval (HIER)
- Protocol for Making a 4% Formaldehyde Solution in PBS
- Protocol for VisUCyte™ HRP Polymer Detection Reagent
- Protocol for the Fluorescent ICC Staining of Cell Smears - Graphic
- Protocol for the Fluorescent ICC Staining of Cultured Cells on Coverslips - Graphic
- Protocol for the Preparation & Fixation of Cells on Coverslips
- Protocol for the Preparation and Chromogenic IHC Staining of Frozen Tissue Sections
- Protocol for the Preparation and Chromogenic IHC Staining of Frozen Tissue Sections - Graphic
- Protocol for the Preparation and Chromogenic IHC Staining of Paraffin-embedded Tissue Sections
- Protocol for the Preparation and Chromogenic IHC Staining of Paraffin-embedded Tissue Sections - Graphic
- Protocol for the Preparation and Fluorescent ICC Staining of Cells on Coverslips
- Protocol for the Preparation and Fluorescent ICC Staining of Non-adherent Cells
- Protocol for the Preparation and Fluorescent ICC Staining of Stem Cells on Coverslips
- Protocol for the Preparation and Fluorescent IHC Staining of Frozen Tissue Sections
- Protocol for the Preparation and Fluorescent IHC Staining of Paraffin-embedded Tissue Sections
- Protocol for the Preparation of Gelatin-coated Slides for Histological Tissue Sections
- Protocol for the Preparation of a Cell Smear for Non-adherent Cell ICC - Graphic
- R&D Systems Quality Control Western Blot Protocol
- TUNEL and Active Caspase-3 Detection by IHC/ICC Protocol
- The Importance of IHC/ICC Controls
- Troubleshooting Guide: Immunohistochemistry
- Troubleshooting Guide: Western Blot Figures
- Western Blot Conditions
- Western Blot Protocol
- Western Blot Protocol for Cell Lysates
- Western Blot Troubleshooting
- Western Blot Troubleshooting Guide
- View all Protocols, Troubleshooting, Illustrated assays and Webinars
FAQs for MAP2 Antibody - BSA Free
Showing
1
-
3 of
3 FAQs
Showing All
-
Q: Can you please tell me the country of origin for antibody NB300-213, chicken anti-MAP2?
A: Our product NB300-213 originates in the United States.
-
Q: I was using your product NB300-213 for MAP2 immunofluorescence, I did many times, which showed a beaded signal consistently unlike the picture presented on the product datasheet,could you give me some advice?
A: I looked at the images, and I think that the MAP2 antibody is working fine. The beading of the dendrites is likely due to some problem with fixation, which resulted in some damage to the neurons. MAP2 is bound to microtubules which are very labile, rapidly breaking down in the cold or if the cells are metabolically or mechanically challenged. When this happens, the dendrites take up a beaded appearance, as in the images. We routinely use a fixation protocol in which cells are fixed briefly in formalin at room temperature, which stabilizes the microtubules, followed by cold methanol, which helps to permeabilize the cells.
-
Q: Would you be able to share the concentration of NB300-213 from Lot# 7214, and the current lot of this antibody?
A: This antibody is a chicken polyclonal that has been precipitated therefore a concentration is irrelevant. This is because, unlike an affinity purified antibody, there will be other proteins that absorb at 280 that are not the specific antibody to the protein target. The concentration is usually about 20mg/ml. We currently are on Lot# 7225-3.
-
Q: Can you please tell me the country of origin for antibody NB300-213, chicken anti-MAP2?
A: Our product NB300-213 originates in the United States.
-
Q: I was using your product NB300-213 for MAP2 immunofluorescence, I did many times, which showed a beaded signal consistently unlike the picture presented on the product datasheet,could you give me some advice?
A: I looked at the images, and I think that the MAP2 antibody is working fine. The beading of the dendrites is likely due to some problem with fixation, which resulted in some damage to the neurons. MAP2 is bound to microtubules which are very labile, rapidly breaking down in the cold or if the cells are metabolically or mechanically challenged. When this happens, the dendrites take up a beaded appearance, as in the images. We routinely use a fixation protocol in which cells are fixed briefly in formalin at room temperature, which stabilizes the microtubules, followed by cold methanol, which helps to permeabilize the cells.
-
Q: Would you be able to share the concentration of NB300-213 from Lot# 7214, and the current lot of this antibody?
A: This antibody is a chicken polyclonal that has been precipitated therefore a concentration is irrelevant. This is because, unlike an affinity purified antibody, there will be other proteins that absorb at 280 that are not the specific antibody to the protein target. The concentration is usually about 20mg/ml. We currently are on Lot# 7225-3.
Loading...
Associated Pathways
