Nephrin is a 185 kDa type I transmembrane glycoprotein that belongs to the immunoglobulin superfamily (1). Mature mouse Nephrin consists of a 1042 amino acid (aa) extracellular domain (ECD) with eight Ig-like C2-set domains and one fibronectin type III domain, a 22 aa transmembrane segment, and a 156 aa cytoplasmic tail (2, 3). Within the ECD, mouse Nephrin shares 84% and 95% aa sequence identity with human and rat Nephrin, respectively. Usage of the alternate exon 1B results in a distinct N-terminal sequence that lacks a clearly defined signal peptide cleavage site (4). Nephrin is expressed primarily on podocytes in the renal glomerulus and to a lesser extent in the brain and pancreas (3, 5). The 1B isoform is not expressed in the kidney (4). Nephrin localizes to intercellular junctions between podocyte foot processes where it functions as a homophilic adhesion molecule (2, 6). Nephrin is required for formation and maintenance of the slit diaphragm between these processes (7). It associates with Neph1, podicin, P-cadherin, and multiple scaffolding proteins which couple it to the actin cytoskeleton (8-12). Nephrin expression is required for the anti-apoptotic effect of VEGF on podocytes as well as for the ability of podocytes to upregulate Glut1 and Glut4 glucose transporters in response to insulin (13, 14). Nephrin downregulation contributes to diabetic nephropathy, and Nephrin mutations underlie the lethal congenital nephritic syndrome NPHS1 (5, 15).

Key Product Details
Validated by
Biological Validation
Species Reactivity
Validated:
Mouse
Cited:
Human, Mouse, Rat, Transgenic Mouse
Applications
Validated:
Immunohistochemistry
Cited:
Immunohistochemistry, Immunohistochemistry-Paraffin, Immunohistochemistry-Frozen, Western Blot, Neutralization, Flow Cytometry, Immunocytochemistry, IHC-
Label
Unconjugated
Antibody Source
Polyclonal Goat IgG
Loading...
Product Specifications
Immunogen
Mouse myeloma cell line NS0-derived recombinant mouse Nephrin
Gln37-Thr1049
Accession # NP_062332
Gln37-Thr1049
Accession # NP_062332
Specificity
Detects mouse Nephrin in direct ELISAs and Western blots. In direct ELISAs, less than 5% cross-reactivity with recombinant human Nephrin is observed.
Clonality
Polyclonal
Host
Goat
Isotype
IgG
Scientific Data Images for Mouse Nephrin Antibody
Nephrin in Mouse Kidney.
Nephrin was detected in perfusion fixed frozen sections of mouse kidney using 10 µg/mL Goat Anti-Mouse Nephrin Antigen Affinity-purified Polyclonal Antibody (Catalog # AF3159) overnight at 4 °C. Tissue was stained with the NorthernLights™ 557-conjugated Anti-Goat IgG Secondary Antibody (red; Catalog # NL001) and counterstained (green). View our protocol for Fluorescent IHC Staining of Frozen Tissue Sections.
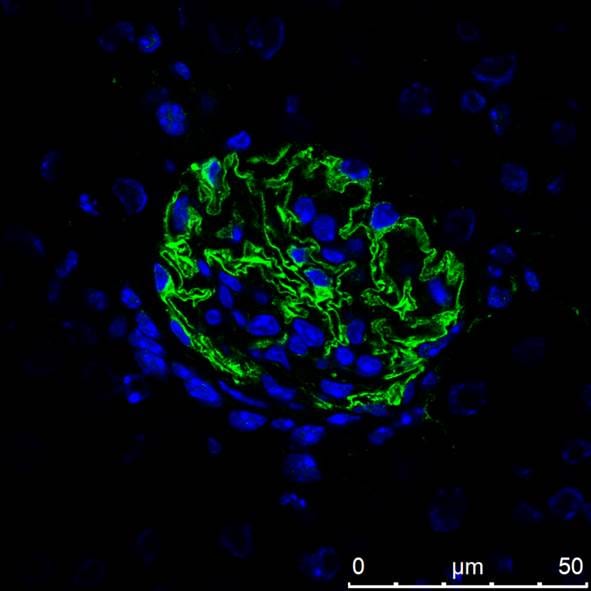
Nephrin in Mouse Kidney.
Nephrin was detected in perfusion fixed frozen sections of mouse kidney using Goat Anti-Mouse Nephrin Antigen Affinity-purified Polyclonal Antibody (Catalog # AF3159) at 10 µg/mL overnight at 4 °C. Tissue was stained using the NorthernLights™ 557-conjugated Anti-Goat IgG Secondary Antibody (yellow; Catalog # NL001) and counterstained with DAPI (blue). View our protocol for Fluorescent IHC Staining of Frozen Tissue Sections.
Detection of Mouse Nephrin by Immunocytochemistry/Immunofluorescence
Immunofluorescence analysis of PRCP and nephrin at 60x magnification eleven weeks after 2K1C.White arrows indicate PRCP staining. A) Localization of PRCP and nephrin with overlay in the control kidney. B) Localization of PRCP and nephrin with overlay in the unclipped kidney. C) Localization of PRCP and nephrin with overlay in the clipped kidney. D) Quantitative analysis of cortical, glomerular and tubular PRCP expression in control, unclipped and clipped kidneys. *p < 0.05 vs. Control. **p < 0.01 vs. Unclipped. Image collected and cropped by CiteAb from the following publication (https://pubmed.ncbi.nlm.nih.gov/25706121), licensed under a CC-BY license. Not internally tested by R&D Systems.
Detection of Mouse Nephrin by Immunocytochemistry/Immunofluorescence
Intraparenchymal delivery of lentiviral vectors preferentially infects epithelial cells of both kidneys and urinary bladder.(a) Confocal images of Strawberry expression in renal sections of ELS infected kidneys 60 days post injection. Sections were stained with the indicated antibodies and merged images with DAPI (blue) are presented. Preferential transduction was observed in proximal (AQP1) and distal (THP) renal tubular epithelial cells and renal fibroblasts (CD73) (white arrowheads). Strawberry was not localised to collecting ducts (AQP2) or podocytes (Nephrin) (white arrows). Scale bars, 50 μm. (b) Confocal images of Strawberry expression in the liver, spleen, lung, urinary bladder and left and right kidney of ELS infected animals 60 days post left intrarenal injection (top panels) and uninjected control animals (bottom panels). Sections were stained with an antibody against Strawberry (green) and merged images with DAPI (blue) are presented. Scale bars, 50 μm. Image collected and cropped by CiteAb from the following publication (https://pubmed.ncbi.nlm.nih.gov/26046460), licensed under a CC-BY license. Not internally tested by R&D Systems.
Detection of Mouse Nephrin by Immunocytochemistry/Immunofluorescence
Podocyte‐specific knockout of KDM6A in mice protects against diabetes‐induced kidney injuryAQuantitative RT–PCR evaluation of KDM6A mRNA expression in kidney glomeruli isolated from wild‐type and KDM6A‐knockout (KO) mice. *P < 0.05, significant difference versus wild‐type controls (Wilcoxon two‐sample test; n = 8).BWestern blot analysis of KDM6A expression in glomeruli and podocytes isolated from wild‐type and KDM6A‐KO mice. Presented experiments were performed at least three times independently.CChanges in body weights and levels of blood glucose in wild‐type or KDM6A‐KO mice with or without STZ treatment. No significant differences in body weights or blood glucose levels between wild‐type and KDM6A‐KO mice with diabetes were observed during the 8‐week experimental period (Wilcoxon two‐sample test; n = 8).DLevels of urinary protein excretion, weights of kidney, and levels of HbA1c in wild‐type and KDM6A‐KO mice with or without STZ treatment (at 8 weeks after the onset of diabetes). The mean relative kidney weight (%) shown in the study is determined as the percent of kidneys out of total body weight, and the HbA1c level is defined as the ratio of HbA1c to the total hemoglobin (% HbA1c; DCCT unit). *P < 0.05 versus untreated wild‐type controls, #P < 0.05 versus STZ‐treated wild‐type mice (parametric ANOVA and a Bonferroni post hoc test; n = 8).EImmunofluorescence images of kidney sections stained with KDM6A and nephrin in wild‐type (WT‐NC), KDM6A‐KO (KO‐NC), STZ‐treated wild‐type (WT‐DM), or STZ‐treated KDM6A‐KO (KO‐DM) mice. Scale bars, 20 μm. *P < 0.05 versus untreated wild‐type controls, #P < 0.05 versus STZ‐treated wild‐type mice (parametric ANOVA and a Bonferroni post hoc test; n = 3).FImmunofluorescence images of kidney sections stained with KDM6A and H3K27me3 in wild‐type (WT‐NC), KDM6A‐KO (KO‐NC), STZ‐treated wild‐type (WT‐DM), or STZ‐treated KDM6A‐KO (KO‐DM) mice. Scale bars, 20 μm. *P < 0.05 versus untreated wild‐type controls, #P < 0.05 versus STZ‐treated
Detection of Mouse Nephrin by Immunocytochemistry/Immunofluorescence
KLF10 is a downstream effector of KDM6A and is capable of directly binding to nephrin gene promoterAScreening of the potential KDM6A‐regulated transcriptional factors involved in repression of nephrin expression. After transduction with a control lentiviral vector or a lentiviral vector expressing KDM6A into primary podocytes for 48 h, intracellular RNAs were isolated and used for RNA sequencing (RNA‐Seq) analysis. The transcript expression patterns of 86 selected transcriptional factors from three independent RNA‐Seq experiments are presented in a heat map. Notably, among these 86 selected genes, KLF10 is the most up‐regulated gene.BValidation of increased KDM6A and KLF10 expression in primary podocytes that were infected with an empty lentiviral vector or KDM6A‐expressing lentiviral vector for 48 h. *P < 0.05 versus the empty vector control (Wilcoxon two‐sample test; n = 3).CIncreased expression of KDM6A and KLF10 in primary podocytes cultured in high glucose for 48 h. *P < 0.05 versus normal controls (Wilcoxon two‐sample test; n = 3).DEffect of KLF10 knockdown on high glucose‐mediated reduction of nephrin in primary podocytes. As noted, knockdown of KLF10 prevented down‐regulation of nephrin and up‐regulation of KDM6A in high glucose‐treated podocytes. *P < 0.05 versus normal controls, #P < 0.05 versus control siRNA with HG incubation (parametric ANOVA and a Bonferroni post hoc test; n = 3).EImmunofluorescence analysis of KLF10 and nephrin in renal sections of normal, diabetic, and GSK‐J4‐treated diabetic mice. Scale bars, 20 μm. *P < 0.05 versus the normal control group, #P < 0.05 versus the untreated diabetic group (parametric ANOVA and a Bonferroni post hoc test; n = 3).FImmunofluorescence images of KLF10 and nephrin in renal sections of wild‐type or KDM6A‐KO mice with or without STZ treatment. Scale bars, 20 μm. *P < 0.05 versus the untreated wild‐type group, #P < 0.05 versus the STZ‐treated wild‐type group (parametric ANOVA and a Bonferroni post hoc test; n
Detection of Mouse Nephrin by Immunocytochemistry/Immunofluorescence
Elevated levels of KDM6A and KLF10 expression, along with decreased levels of nephrin (or WT‐1) expression, are detected in kidney tissues and urinary exosomes of patients with diabetic nephropathyAImmunofluorescence analysis of kidney sections from diabetic nephropathy subjects and non‐diabetic controls stained with KDM6A, KLF10, nephrin, and WT‐1. Scale bars, 50 μm. *P < 0.05 by Wilcoxon two‐sample test (n = 6 for each group).BWestern blot analysis of kidney tissues from non‐diabetic controls and diabetic nephropathy subjects. Expression levels of KDM6A, KLF10, nephrin, and WT‐1 in kidney tissues were determined by immunoblotting using the indicated antibodies. Relative protein levels in kidney tissues were normalized to actin. *P < 0.05 by Wilcoxon two‐sample test (n = 6 for each group).CLevels of KDM6A and KLF10, nephrin mRNAs in urine exosomes of diabetic nephropathy patients and non‐diabetic controls. Relative mRNA levels in human urinary exosomes were normalized to 18S rRNA. Horizontal lines are medians. *P < 0.05, **P < 0.01, and ***P < 0.001 by Wilcoxon two‐sample test (n = 12 for each group).Data information: Data are expressed as mean ± SEM (A and B). See the exact P‐values for comparison tests in Appendix Table S7. Image collected and cropped by CiteAb from the following publication (https://pubmed.ncbi.nlm.nih.gov/30948420), licensed under a CC-BY license. Not internally tested by R&D Systems.
Detection of Mouse Nephrin by Immunocytochemistry/Immunofluorescence
KDM6A promotes podocyte and kidney dysfunction in diabetic miceARelative mRNA levels of KDM6A, nephrin and WT‐1, normalized to beta ‐actin, expressed in kidney glomeruli of normal and diabetic mice at 4, 8, and 12 weeks after diabetic induction. *Significant differences (P < 0.05) compared with normal controls (Wilcoxon two‐sample test; n = 8 each).BWestern blot analysis of nephrin, KDM6A, and H3K27me3 in kidney glomeruli of normal and diabetic mice at different time points. *P < 0.05 versus normal controls for the indicated time points (Wilcoxon two‐sample test; n = 3).CChanges in body weights and levels of blood glucose in normal, diabetic, and GSK‐J4‐treated diabetic mice. As noted, GSK‐J4 treatment did not significantly affect body weights or blood glucose levels in diabetic mice during the experimental period of 12 weeks (Wilcoxon two‐sample test; n = 8).DLevels of urinary protein excretion, weights of kidney, and levels of HbA1c in normal, diabetic, and GSK‐J4‐treated diabetic mice. Urinary total protein excretion, kidney weight, and levels of HbA1c were measured at 12 weeks after diabetic induction. The mean relative kidney weight (%) shown in the study is determined as the percent of kidneys out of total body weight, and the HbA1c level is defined as the ratio of HbA1c to the total hemoglobin (% HbA1c; DCCT unit). *P < 0.05 versus normal controls, #P < 0.05 versus untreated diabetic mice (parametric ANOVA and a Bonferroni post hoc test; n = 8).EWestern blot analysis of KDM6A, nephrin, WT‐1, and H3K27me3 expressed in kidney glomeruli of normal, diabetic, and GSK‐J4‐treated diabetic mice at 12 weeks after diabetic induction. *P < 0.05 versus normal controls, #P < 0.05 versus untreated diabetic mice (parametric ANOVA and a Bonferroni post hoc test; n = 3).FImmunofluorescence analysis of KDM6A, nephrin, and WT‐1 in kidney sections from normal, diabetic, and GSK‐J4‐treated diabetic mice. Green: nephrin or WT‐1; red: KDM6A; blue: DAPI. Scale bars, 20 μm. *P < 0.05 ver
Detection of Mouse Nephrin by Immunocytochemistry/ Immunofluorescence
Comparison of nephrin imaging with different conventional and super-resolution modalities. a Widefield vs dSTORM using Atto647N. b Confocal vs STED using Atto647N. c Widefield vs SIM using Alexa Fluor 488. d ExM prepared sample imaged with widefield vs e confocal using Alexa Fluor 488. The confocal ExM image furthermore shows the nucleus stained with Hoechst. Highlighted panels show × 3 zoomed areas. Scale bars in a–c are 1 μm, in d and e 10 μm and in the zoomed in areas 5 μm (after expansion) Image collected and cropped by CiteAb from the following open publication (https://pubmed.ncbi.nlm.nih.gov/33277998), licensed under a CC-BY license. Not internally tested by R&D Systems.
Detection of Mouse Nephrin by Immunocytochemistry/ Immunofluorescence
Kidney organoids derived from the isolated Sca1+ Oct4+ cells develop kidney structures and glomerular lineage. A) The time‐course of the development of Sca1+ Oct4+ cell‐derived kidney organoids in culture. Scale bar, 100 µm. B) Bright field of kidney‐shaped KSCs‐derived organoid. Scale bar, 200 µm. C) Cryosection of kidney organoids (H&E staining) revealing kidney structures including cortex, medulla, column, and capsule. Scale bar, 20 µm. D) Cryosections of kidney organoids were further processed with immunofluorescent staining. The photo shows glomerulus‐like structure with positive staining for nephrin (red) and distal tubule‐positive staining for NCC (green, arrow). Scale bar, 10 µm. Data is representative of three independent experiments. Image collected and cropped by CiteAb from the following open publication (https://pubmed.ncbi.nlm.nih.gov/35315252), licensed under a CC-BY license. Not internally tested by R&D Systems.
Detection of Mouse Nephrin by Western Blot
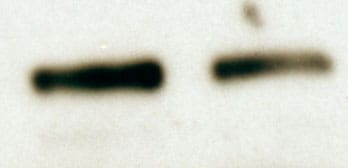
Generation of a self‐organizing de novo nephron from the differentiated Sca1+ Oct4+ monolayer cultures. A) Bright field image of self‐organizing organoid‐like structure from monolayer culture of kidney stem cells. The photo shows glomerulus‐like structure (black arrow), tubule‐like structure (red arrows), and collecting duct‐like structure (green arrow). Scale bar, 100 µm. A1) Glomerulus‐like structure stained with nephrin (white arrow). Scale bar, 50 µm. A2) Glomerulus‐like structure stained with nephrin (white arrow) and proximal tubule‐like structure stained with LTL (red arrows). Scale bar, 50 µm. A3) Glomerulus‐like structure stained with podocin (white arrow). Scale bar, 50 µm. A4) Collecting duct‐like structure stained with GATA3 (white arrow). Scale bar, 50 µm.,C) Western blot analysis of CD31, nephrin, and podocin expression in undifferentiated and differentiated Sca1+ Oct4+ cells. GAPDH was used as a loading control. Data is representative of three independent experiments. Values represent the mean ± SD (n = 3). p < 0.05 versus control by 2‐tailed Student's t test. Image collected and cropped by CiteAb from the following open publication (https://pubmed.ncbi.nlm.nih.gov/35315252), licensed under a CC-BY license. Not internally tested by R&D Systems.
Detection of Mouse Nephrin by Immunocytochemistry/ Immunofluorescence
Generation of self‐organizing kidney‐shaped structures from the differentiated Sca1+ Oct4+ monolayer cultures. A) Comma‐shaped body with positive staining of cleaved‐Notch1 and CD31. Scale bar, 20 µm. B) Bright field (BF) of differentiation of the isolated Sca1+ Oct4+ cells and subsequent generation of self‐organized kidney‐shaped structures. Scale bar, 100, 20, and 20 µm. C) Expression of nephrin and podocin in self‐organizing kidney‐shaped structures assembled by differentiated Sca1+ Oct4+ cells. Scale bar, 25 µm. D) Uptake of 70 kDa FITC‐dextran by kidney‐shaped structures after 30 min and 6 h. Scale bar, 25 µm. Data is representative of three independent experiments. Image collected and cropped by CiteAb from the following open publication (https://pubmed.ncbi.nlm.nih.gov/35315252), licensed under a CC-BY license. Not internally tested by R&D Systems.Applications for Mouse Nephrin Antibody
Application
Recommended Usage
Immunohistochemistry
5-15 µg/mL
Sample: Perfusion fixed frozen sections of mouse kidney
Sample: Perfusion fixed frozen sections of mouse kidney
Reviewed Applications
Read 2 reviews rated 5 using AF3159 in the following applications:
Formulation, Preparation, and Storage
Purification
Antigen Affinity-purified
Reconstitution
Reconstitute at 0.2 mg/mL in sterile PBS. For liquid material, refer to CoA for concentration.
Loading...
Formulation
Lyophilized from a 0.2 μm filtered solution in PBS with Trehalose. *Small pack size (SP) is supplied either lyophilized or as a 0.2 µm filtered solution in PBS.
Shipping
Lyophilized product is shipped at ambient temperature. Liquid small pack size (-SP) is shipped with polar packs. Upon receipt, store immediately at the temperature recommended below.
Stability & Storage
Use a manual defrost freezer and avoid repeated freeze-thaw cycles.
- 12 months from date of receipt, -20 to -70 °C as supplied.
- 1 month, 2 to 8 °C under sterile conditions after reconstitution.
- 6 months, -20 to -70 °C under sterile conditions after reconstitution.
Calculators
Background: Nephrin
References
- Kawachi, H. et al. (2006) Nephrology 11:274.
- Holzman, L.B. et al. (1999) Kidney Int. 56:1481.
- Putaala, H. et al. (2000) J. Am. Soc. Nephrol. 11:991.
- Beltcheva, O. et al. (2003) J. Am. Soc. Nephrol. 14:352.
- Putaala, H. et al. (2001) Hum. Mol. Genet. 10:1.
- Khoshnoodi, J. et al. (2003) Am. J. Pathol. 163:2337.
- Ruotsalainen, V. et al. (2000) Am. J. Pathol. 157:1905.
- Barletta, G.M. et al. (2003) J. Biol. Chem. 278:19266.
- Huber, T.B. et al. (2001) J. Biol. Chem. 276:41543.
- Lehtonen, S. et al. (2004) Am. J. Pathol. 165:923.
- Lehtonen, S. et al. (2005) Proc. Natl. Acad. Sci. USA 102:9814.
- Verma, R. et al. (2006) J. Clin. Invest. 116:1346.
- Foster, R.R. et al. (2005) Am. J. Physiol. Renal Physiol. 288:F48.
- Coward, R.J. et al. (2007) Diabetes 56:1127.
- Cooper, M.E. et al. (2002) Semin. Nephrol. 22:393.
Alternate Names
CNF, NPHS1
Gene Symbol
NPHS1
UniProt
Additional Nephrin Products
Product Documents for Mouse Nephrin Antibody
Certificate of Analysis
To download a Certificate of Analysis, please enter a lot or batch number in the search box below.
Note: Certificate of Analysis not available for kit components.
Product Specific Notices for Mouse Nephrin Antibody
For research use only
Related Research Areas
Citations for Mouse Nephrin Antibody
 Powered by Bioz
Customer Reviews for Mouse Nephrin Antibody (2)
5 out of 5
2 Customer Ratings
Have you used Mouse Nephrin Antibody?
Submit a review and receive an Amazon gift card!
$25/€18/£15/$25CAN/¥2500 Yen for a review with an image
$10/€7/£6/$10CAN/¥1110 Yen for a review without an image
Submit a review
Customer Images
Showing
1
-
2 of
2 reviews
Showing All
Filter By:
-
Application: ImmunohistochemistrySample Tested: Kidney (cortex) tissueSpecies: MouseVerified Customer | Posted 06/15/2017

-
Application: Western BlotSample Tested: Kidney tissueSpecies: MouseVerified Customer | Posted 08/26/2016
There are no reviews that match your criteria.
Protocols
Find general support by application which include: protocols, troubleshooting, illustrated assays, videos and webinars.
- Antigen Retrieval Protocol (PIER)
- Antigen Retrieval for Frozen Sections Protocol
- Appropriate Fixation of IHC/ICC Samples
- Cellular Response to Hypoxia Protocols
- Chromogenic IHC Staining of Formalin-Fixed Paraffin-Embedded (FFPE) Tissue Protocol
- Chromogenic Immunohistochemistry Staining of Frozen Tissue
- ClariTSA™ Fluorophore Kits
- Detection & Visualization of Antibody Binding
- Fluorescent IHC Staining of Frozen Tissue Protocol
- Graphic Protocol for Heat-induced Epitope Retrieval
- Graphic Protocol for the Preparation and Fluorescent IHC Staining of Frozen Tissue Sections
- Graphic Protocol for the Preparation and Fluorescent IHC Staining of Paraffin-embedded Tissue Sections
- Graphic Protocol for the Preparation of Gelatin-coated Slides for Histological Tissue Sections
- IHC Sample Preparation (Frozen sections vs Paraffin)
- Immunofluorescent IHC Staining of Formalin-Fixed Paraffin-Embedded (FFPE) Tissue Protocol
- Immunohistochemistry (IHC) and Immunocytochemistry (ICC) Protocols
- Immunohistochemistry Frozen Troubleshooting
- Immunohistochemistry Paraffin Troubleshooting
- Preparing Samples for IHC/ICC Experiments
- Preventing Non-Specific Staining (Non-Specific Binding)
- Primary Antibody Selection & Optimization
- Protocol for Heat-Induced Epitope Retrieval (HIER)
- Protocol for Making a 4% Formaldehyde Solution in PBS
- Protocol for VisUCyte™ HRP Polymer Detection Reagent
- Protocol for the Preparation & Fixation of Cells on Coverslips
- Protocol for the Preparation and Chromogenic IHC Staining of Frozen Tissue Sections
- Protocol for the Preparation and Chromogenic IHC Staining of Frozen Tissue Sections - Graphic
- Protocol for the Preparation and Chromogenic IHC Staining of Paraffin-embedded Tissue Sections
- Protocol for the Preparation and Chromogenic IHC Staining of Paraffin-embedded Tissue Sections - Graphic
- Protocol for the Preparation and Fluorescent IHC Staining of Frozen Tissue Sections
- Protocol for the Preparation and Fluorescent IHC Staining of Paraffin-embedded Tissue Sections
- Protocol for the Preparation of Gelatin-coated Slides for Histological Tissue Sections
- TUNEL and Active Caspase-3 Detection by IHC/ICC Protocol
- The Importance of IHC/ICC Controls
- Troubleshooting Guide: Immunohistochemistry
- View all Protocols, Troubleshooting, Illustrated assays and Webinars
Loading...