
Key Product Details
Species Reactivity
Validated:
Mouse
Cited:
Human, Mouse, Rat, Transgenic Mouse, Xenograft
Applications
Validated:
Immunohistochemistry, Western Blot, Flow Cytometry, CyTOF-ready
Cited:
Immunohistochemistry, Immunohistochemistry-Paraffin, Immunohistochemistry-Frozen, Western Blot, Immunocytochemistry, IHC-F
Label
Unconjugated
Antibody Source
Polyclonal Goat IgG
Loading...
Product Specifications
Immunogen
Mouse myeloma cell line NS0-derived recombinant mouse Podocalyxin
Ser21-Arg402
Accession # Q9R0M4
Ser21-Arg402
Accession # Q9R0M4
Specificity
Detects mouse Podocalyxin in direct ELISAs and Western blots. In direct ELISAs and Western blots, less than 1% cross‑reactivity with recombinant human (rh) Podocalyxin and rhEndoglycan is observed.
Clonality
Polyclonal
Host
Goat
Isotype
IgG
Scientific Data Images for Mouse Podocalyxin Antibody
Detection of Mouse Podocalyxin by Western Blot.
Western blot shows lysates of mouse kidney tissue. PVDF membrane was probed with 1 µg/mL of Goat Anti-Mouse Podocalyxin Antigen Affinity-purified Polyclonal Antibody (Catalog # AF1556) followed by HRP-conjugated Anti-Goat IgG Secondary Antibody (HAF109). A specific band was detected for Podocalyxin at approximately 130 kDa (as indicated). This experiment was conducted under reducing conditions and using Immunoblot Buffer Group 1.
Podocalyxin in Mouse Thymus.
Podocalyxin was detected in perfusion fixed frozen sections of mouse thymus using Goat Anti-Mouse Podocalyxin Antigen Affinity-purified Polyclonal Antibody (Catalog # AF1556) at 15 µg/mL overnight at 4 °C. Tissue was stained using the Anti-Goat HRP-DAB Cell & Tissue Staining Kit (brown; CTS008) and counterstained with hematoxylin (blue). Lower panel shows a lack of labeling when primary antibodies are omitted and tissue is stained only with secondary antibody followed by incubation with detection reagents. Specific staining was localized to high endothelial venules. View our protocol for Chromogenic IHC Staining of Frozen Tissue Sections.
Detection of Mouse Podocalyxin Like by Immunocytochemistry/Immunofluorescence
Defects in TRAF3IP1 mutants are mediated by MAP4.(a) Lateral views of WT zebrafish embryos injected with map4 morpholino at 48 hpf and phenotype distribution in WT embryos injected with control or map4 morpholino. (b) Lateral views of elipsa zebrafish embryos injected with map4 morpholino at 48 hpf and phenotype distribution in elipsa mutant embryos injected with control or map4 morpholino (data shown as combined result of n=3 independent experiments). Scale bars, 1 mm. (c) Relative expression of Map4 normalized to that of Hprt was analysed by qPCR in control and Traf3ip1-KD mIMCD3 cells stably expressing GFP or GFP-IFT54 mutants and Map4 shRNA. (d) Control and Traf3ip1-KD/ Map4-KD mIMCD3 cells expressing either GFP or IFT54-GFP fusions were fixed in MeOH and stained for acetylated alpha -tubulin (red) and gamma -tubulin (light blue). Scale bar, 10 μm. (e) Six hours after Ca2+ switch, mIMCD3 cells grown until confluence on filters were fixed with 4% PFA and stained for the apical marker Gp135 (red). Scale bar, 10 μm. (f) Percentage of normal spheroids of control and Traf3ip1-KD/ Map4-KD mIMCD3 cells expressing either GFP or IFT54-GFP fusions grown on Matrigel for 5 days (mean ± s.d., n≥100 spheroids from 3 independent experiments, ***P≤0,0001, *P<0.012, Bonferonni's multiple-comparison test). Image collected and cropped by CiteAb from the following publication (https://www.nature.com/articles/ncomms9666), licensed under a CC-BY license. Not internally tested by R&D Systems.
Detection of Mouse Podocalyxin Like by Immunocytochemistry/Immunofluorescence
Gdf2 deletion decreases tumor perfusion and maturation in the E0771 mammary cancer model. E0771 cells were injected in the 4th mammary gland of WT and Gdf2−/− mice and tumor vascularization was analyzed 9 days after tumor detection. a Representative images of the tumors stained for podocalyxin (red), lectin (green) and cell nuclei (blue, Hoechst). Scale bar 50 μm. b Vascular density quantified by podocalyxin positive area (% of tumor area) and (c) assessment of vessel diameter using Ferret’s theorem (WT n = 7, Gdf2−/−n = 13, 1 representative experiment out of 2). d Quantification of vessel perfusion by lectin staining (% area of lectin/podocalyxin) (WT n = 8, Gdf2−/− n = 7, 1 representative experiment out of 3). e Representative images of the tumors stained for podocalyxin (red), alpha -smooth muscle actin ( alpha -SMA) (green) and cell nuclei (blue, Hoechst). Scale bar 100 μm. f alpha -SMA staining quantification (% area of alpha -SMA/podocalyxin) (WT n = 8, Gdf2−/− n = 7, 1 representative experiment out of 3). b, c, d, f Data are the median ± interquartile range. Statistical analysis: Mann-Whitney test. *p ≤ 0.05 and **p ≤ 0.01 significantly different Image collected and cropped by CiteAb from the following publication (https://pubmed.ncbi.nlm.nih.gov/30165893), licensed under a CC-BY license. Not internally tested by R&D Systems.
Detection of Mouse Podocalyxin Like by Immunocytochemistry/Immunofluorescence
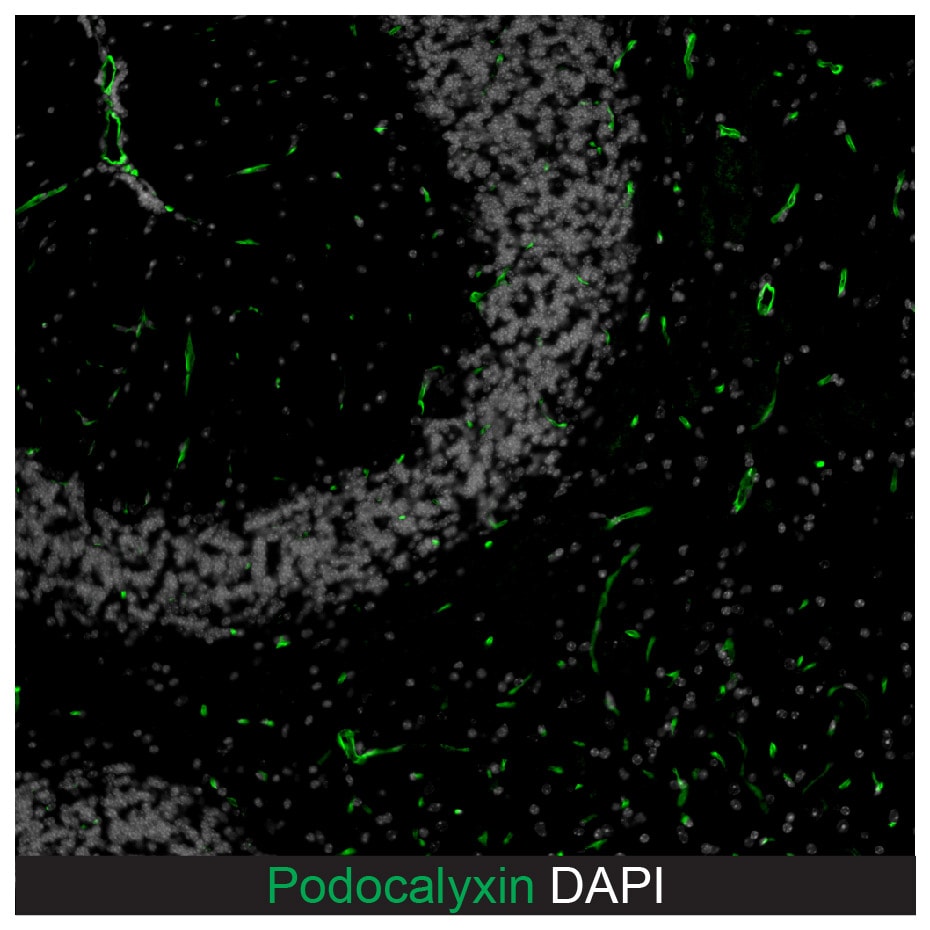
Confocal ExM images of mouse kidney labeled with antibodies or fluorescent proteins. (a–c) Single focal plane of glomerulus immunostained for podocin (a), agrin (b), podocalyxin (Podxl c), and merge (d) of (a–c). (e–g) Confocal maximum intensity projections of glomerulus immunostained for synaptopodin (Synpo, e), acetylated tubulin (acTub, f), podocin (g) highlighting secondary FPs, primary FPs, and slit diaphragms/FP boundaries, respectively. (h) Merge of (e–h). (i–k) Confocal maximum intensity projections of glomerulus immunostained for collagen IV (Coll IV, i), podocalyxin (Podxl, j), and alpha smooth muscle actin ( alpha SMA, k) and highlighting Bowman’s capsule and the mesangium, podocytes, and arterioles and the mesangium, respectively. (l) Merge of (i–k). (m–p) Single focal plane of glomerulus showing native fluorescence from confetti mouse expressing YFP (m) and RFP (o) in separate podocyte cell bodies and FPs as well as GFP (n) in various podocyte nuclei. (p) Merge of (m–o). (q) Zoomed-in view of region highlighted in (p). (r) Further zoomed-in view (top) and cross-sectional profile (bottom) of boxed region highlighted in (q). All distances and scale bars are in pre-expansion units. Scale bars, 2 µm (a–h,q), 25 µm (i–l), 5 µm (m–p). Image collected and cropped by CiteAb from the following publication (https://pubmed.ncbi.nlm.nih.gov/29991751), licensed under a CC-BY license. Not internally tested by R&D Systems.
Detection of Mouse Podocalyxin Like by Immunocytochemistry/Immunofluorescence
Endothelial beta -catenin GOF does not affect the ECM of astrocytic endfeet and ECs within the subfornical organ (SFO).Striatal BBB-vessel showing a polarized distribution of Lama2 and Aqp4 in AC endfeet. Lumen is stained by Podxl (asterisk) (A). Coronal overview of the subfornical organ (SFO) (B); rectangular inset demarcates area for higher magnification in (C). Striatal BBB-vessel showing a polarized distribution of ColIV (green) but no Meca32 (white) in ECs (D). Coronal overview SFO, rectangular inset demarcates area for higher magnification in F (E); white dashed lines show Meca32+, red dashed lines show Meca32 vessels (F). Dashed lines outline SFO vessels; scale bars show 2 µm (A), 50 µm (B), 10 µm (C), 2.5 µm (D), 50 µm (E), 10 µm (F). Image collected and cropped by CiteAb from the following publication (https://pubmed.ncbi.nlm.nih.gov/30932814), licensed under a CC-BY license. Not internally tested by R&D Systems.
Detection of Mouse Podocalyxin Like by Immunocytochemistry/Immunofluorescence
TRAF3IP1 mutations lead to epithelialization and polarity defects.(a) mIMCD3 cells grown until confluence on filters were subjected to Ca2+-free medium to disrupt the tight junctions. Six hours after Ca2+ addition, cells were analysed by immunofluorescence using the apical marker Gp135 (red) and beta -catenin (light blue) to stain the cell junctions. Scale bar, 10 μm. (b) Following Ca2+ switch, tight junction re-formation was assessed by measurement of trans-epithelial resistance (TER) at different time points (mean ± s.e.m. of n=5 independent experiments, two-way ANOVA; NS: not-significant, ***P<0.001 at 6 h). (c) Height of mIMCD3 cells grown on filters measured as the distance from the base to the top of the cells (GFP staining, not shown; mean ± s.d. of n≥20, from 3 independent experiments, ***P<0.001, Bonferonni's multiple-comparison test). (d) Expression of the apical marker Gp135 was analysed by Western blot with alpha -tubulin as a loading control. (e) mIMCD3 cells grown in matrigel 3D matrix to form spheroids were stained for ZO1 (tight junctions, red) and analysed by confocal microscopy. Arrows indicate ZO-1 at the apical junctions, while arrow heads point to mislocalized ZO-1. Equatorial sections of representative spheres are shown for each cell line. Scale bars, 10 μm. (f) Percentage of abnormal spheroids (no/small lumen filled with cells) (mean ± s.d., n=80 spheroids from 2 independent experiments, ***P≤0,001, **P<0.002, Bonferonni's multiple-comparison test). Image collected and cropped by CiteAb from the following publication (https://www.nature.com/articles/ncomms9666), licensed under a CC-BY license. Not internally tested by R&D Systems.
Detection of Mouse Podocalyxin Like by Immunocytochemistry/Immunofluorescence
Bmp10 conditional deletion has no impact on tumor growth, angiogenesis and lung metastasis in the E0771 mammary cancer model. a Schematic representation of the experimental protocol for Bmp10 specific deletion and E0771 cells implantation. Tamoxifen was injected in all 3-week-old mice; 3 weeks later, E0771 cells were injected and tumor growth was analyzed for 3 weeks. b Plasmatic levels of BMP10 in control (CTL, n = 15) and Bmp10 conditional KO (Bmp10-cKO, n = 15) mice assessed by ELISA at the end of the experiment. c Tumor growth was assessed by caliper measurement every 2 to 3 days after tumor detection (CTL n = 7, Bmp10-cKO n = 8, 1 representative experiment out of 3). d Representative images of the tumors stained for podocalyxin (red), lectin (green) and cell nuclei (blue, Hoechst). Scale bar 50 μm. e Vascular density quantified by podocalyxin surface area (% of tumor area) and (f) Quantification of vessel perfusion by lectin staining (% area of lectin/podocalyxin) (CTL n = 7, Bmp10-cKO n = 8, 1 representative experiment out of 3). g Total area, (h) number and (i) mean size of lung metastases per mice bearing metastases (CTL n = 10, Bmp10-cKO n = 9, 2 experiments). c Data are the mean ± SEM. Statistical analysis: Two-way matched ANOVA. b, e, f, g, h, i Data are the median ± interquartile range. Statistical analysis: Mann-Whitney test. ****p ≤ 0.001 significantly different Image collected and cropped by CiteAb from the following publication (https://pubmed.ncbi.nlm.nih.gov/30165893), licensed under a CC-BY license. Not internally tested by R&D Systems.
Detection of Mouse Podocalyxin Like by Immunocytochemistry/Immunofluorescence
Endothelial beta -catenin GOF does not affect astrocytic endfoot polarization of alpha -dystroglycan ( alpha -Dag) and Kir4.1 within the subfornical organ (SFO).Striatal BBB-vessel showing a polarized distribution of alpha -Dag and Kir4.1 in AC endfeet. Lumen is stained by Podxl (asterisk) (A). Coronal overview of the subfornical organ (SFO) (B); rectangular inset demarcates area for higher magnification in (C). Dashed lines outline SFO vessels. Scale bar show 2 µm (A), 50 µm (B), 10 µm (C). Image collected and cropped by CiteAb from the following publication (https://pubmed.ncbi.nlm.nih.gov/30932814), licensed under a CC-BY license. Not internally tested by R&D Systems.
Detection of Mouse Podocalyxin Like by Western Blot
TRAF3IP1 mutations lead to epithelialization and polarity defects.(a) mIMCD3 cells grown until confluence on filters were subjected to Ca2+-free medium to disrupt the tight junctions. Six hours after Ca2+ addition, cells were analysed by immunofluorescence using the apical marker Gp135 (red) and beta -catenin (light blue) to stain the cell junctions. Scale bar, 10 μm. (b) Following Ca2+ switch, tight junction re-formation was assessed by measurement of trans-epithelial resistance (TER) at different time points (mean ± s.e.m. of n=5 independent experiments, two-way ANOVA; NS: not-significant, ***P<0.001 at 6 h). (c) Height of mIMCD3 cells grown on filters measured as the distance from the base to the top of the cells (GFP staining, not shown; mean ± s.d. of n≥20, from 3 independent experiments, ***P<0.001, Bonferonni's multiple-comparison test). (d) Expression of the apical marker Gp135 was analysed by Western blot with alpha -tubulin as a loading control. (e) mIMCD3 cells grown in matrigel 3D matrix to form spheroids were stained for ZO1 (tight junctions, red) and analysed by confocal microscopy. Arrows indicate ZO-1 at the apical junctions, while arrow heads point to mislocalized ZO-1. Equatorial sections of representative spheres are shown for each cell line. Scale bars, 10 μm. (f) Percentage of abnormal spheroids (no/small lumen filled with cells) (mean ± s.d., n=80 spheroids from 2 independent experiments, ***P≤0,001, **P<0.002, Bonferonni's multiple-comparison test). Image collected and cropped by CiteAb from the following publication (https://www.nature.com/articles/ncomms9666), licensed under a CC-BY license. Not internally tested by R&D Systems.
Detection of Mouse Podocalyxin Like by Immunocytochemistry/Immunofluorescence
Gdf2 deletion decreases tumor perfusion and maturation in the E0771 mammary cancer model. E0771 cells were injected in the 4th mammary gland of WT and Gdf2−/− mice and tumor vascularization was analyzed 9 days after tumor detection. a Representative images of the tumors stained for podocalyxin (red), lectin (green) and cell nuclei (blue, Hoechst). Scale bar 50 μm. b Vascular density quantified by podocalyxin positive area (% of tumor area) and (c) assessment of vessel diameter using Ferret’s theorem (WT n = 7, Gdf2−/−n = 13, 1 representative experiment out of 2). d Quantification of vessel perfusion by lectin staining (% area of lectin/podocalyxin) (WT n = 8, Gdf2−/− n = 7, 1 representative experiment out of 3). e Representative images of the tumors stained for podocalyxin (red), alpha -smooth muscle actin ( alpha -SMA) (green) and cell nuclei (blue, Hoechst). Scale bar 100 μm. f alpha -SMA staining quantification (% area of alpha -SMA/podocalyxin) (WT n = 8, Gdf2−/− n = 7, 1 representative experiment out of 3). b, c, d, f Data are the median ± interquartile range. Statistical analysis: Mann-Whitney test. *p ≤ 0.05 and **p ≤ 0.01 significantly different Image collected and cropped by CiteAb from the following publication (https://pubmed.ncbi.nlm.nih.gov/30165893), licensed under a CC-BY license. Not internally tested by R&D Systems.
Detection of Podocalyxin in Neuro-2A cells by Flow Cytometry
Neuro-2A cells were stained with Goat Anti-Mouse Podocalyxin Antigen Affinity-purified Polyclonal Antibody (Catalog # AF1556, filled histogram) or isotype control antibody (Catalog # 4-001-A, open histogram) followed by Allophycocyanin-conjugated Anti-Goat IgG Secondary Antibody (Catalog # F0108). View our protocol for Staining Membrane-associated Proteins.
Detection of Mouse Mouse Podocalyxin Antibody by Immunohistochemistry
TRAF3IP1 mutations lead to epithelialization and polarity defects.(a) mIMCD3 cells grown until confluence on filters were subjected to Ca2+-free medium to disrupt the tight junctions. Six hours after Ca2+ addition, cells were analysed by immunofluorescence using the apical marker Gp135 (red) and beta -catenin (light blue) to stain the cell junctions. Scale bar, 10 μm. (b) Following Ca2+ switch, tight junction re-formation was assessed by measurement of trans-epithelial resistance (TER) at different time points (mean ± s.e.m. of n=5 independent experiments, two-way ANOVA; NS: not-significant, ***P<0.001 at 6 h). (c) Height of mIMCD3 cells grown on filters measured as the distance from the base to the top of the cells (GFP staining, not shown; mean ± s.d. of n≥20, from 3 independent experiments, ***P<0.001, Bonferonni's multiple-comparison test). (d) Expression of the apical marker Gp135 was analysed by Western blot with alpha -tubulin as a loading control. (e) mIMCD3 cells grown in matrigel 3D matrix to form spheroids were stained for ZO1 (tight junctions, red) and analysed by confocal microscopy. Arrows indicate ZO-1 at the apical junctions, while arrow heads point to mislocalized ZO-1. Equatorial sections of representative spheres are shown for each cell line. Scale bars, 10 μm. (f) Percentage of abnormal spheroids (no/small lumen filled with cells) (mean ± s.d., n=80 spheroids from 2 independent experiments, ***P≤0,001, **P<0.002, Bonferonni's multiple-comparison test). Image collected and cropped by CiteAb from the following publication (https://pubmed.ncbi.nlm.nih.gov/26487268), licensed under a CC-BY license. Not internally tested by R&D Systems.
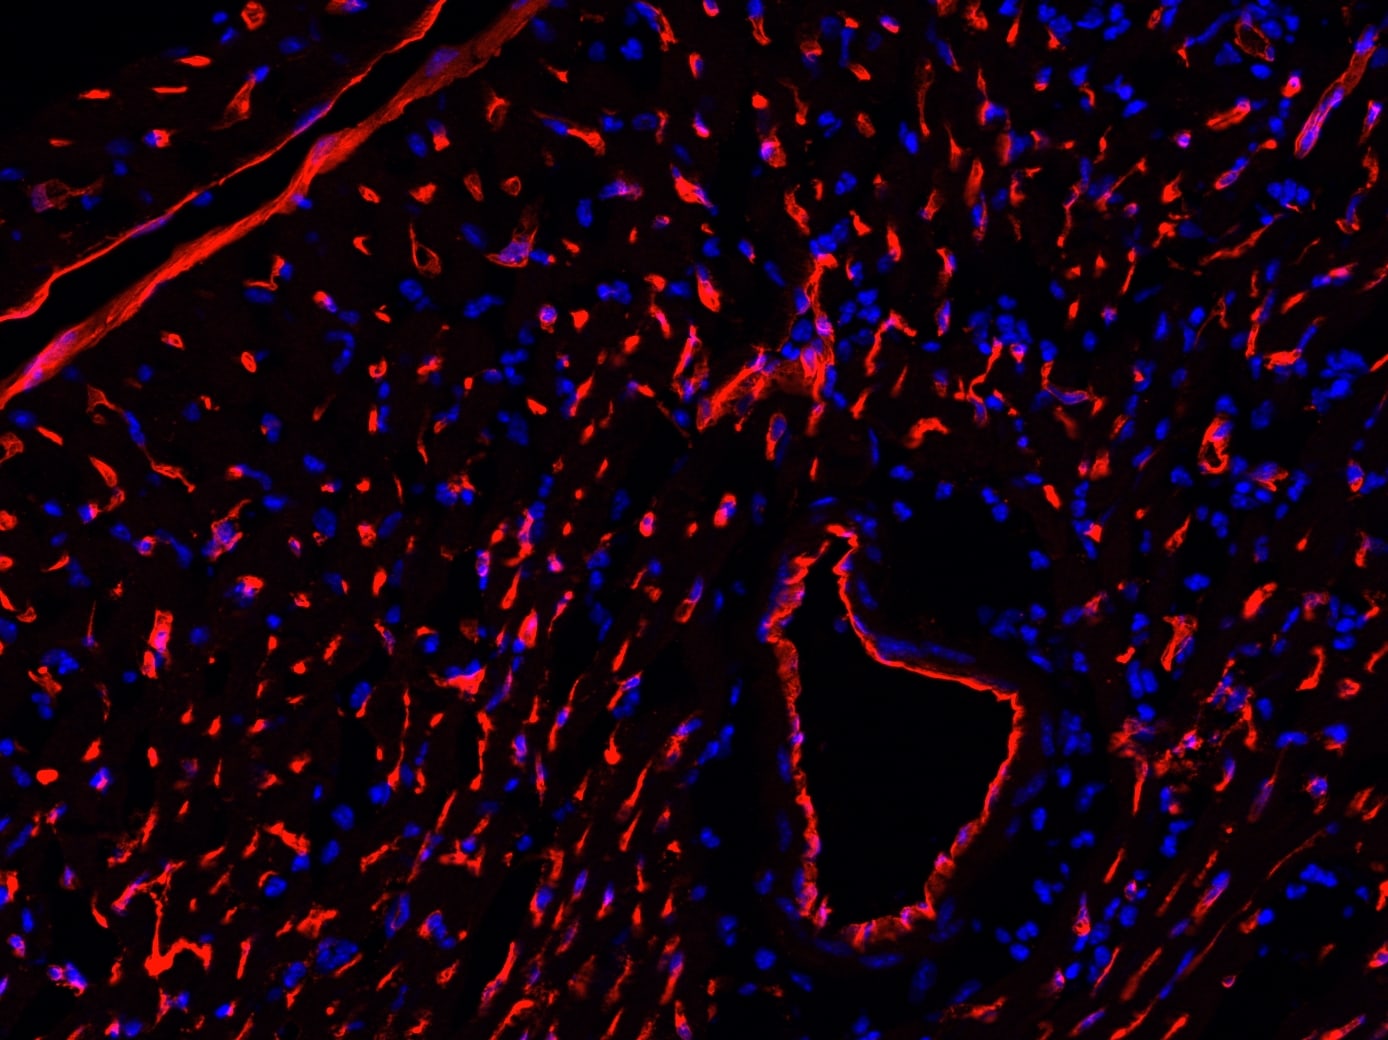
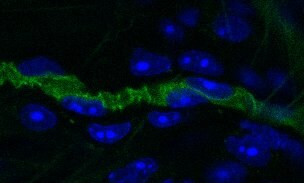
Detection of Mouse Podocalyxin Like by Immunohistochemistry
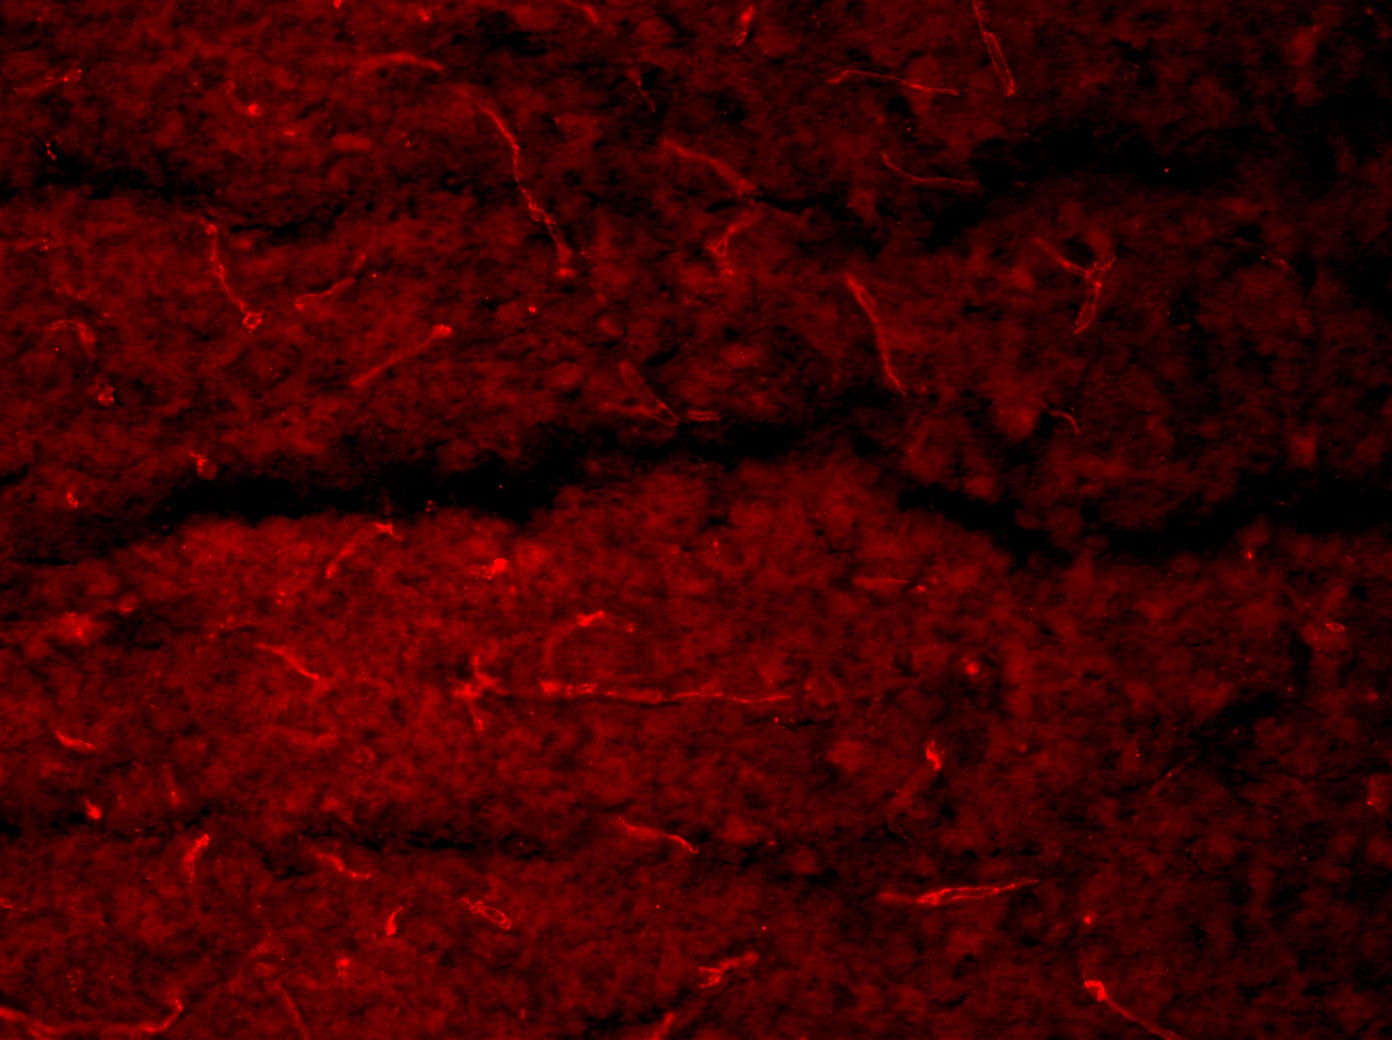
Improved survival&blood–brain barrier function post pneumococcal infection in mice by anti-HIF-1 alpha treatment using echinomycin. e Immunofluorescence staining for HIF-1 alpha, BBB permeability&junctional markers in the echinomycin&vehicle groups at the survival end point. Left panel shows that echinomycin treatment leads to a reduction in HIF-1 alpha -positive nuclei including in ECs co-stained for podocalyxin, a vascular marker which was unchanged by the treatment. Middle panel displays reduced vascular permeability to fibrinogen in the echinomycin group as indicated by stronger intravascular signal compared to the vehicle-treated mice. Increased expression of tight junction proteins—occludin (middle panel)&claudin-5 (right top panel)—in echinomycin-treated mice indicate improved BBB function. Tight junction-associated ZO-1, adherens junction marker VE-Cadherin,&endothelial cell adhesion molecule CD31 unchanged (middle, bottom right panel). There was also no difference in S. pneumoniae (Spn) staining (right top panel) between the two groups. Scale bar 10 μm. Image collected & cropped by CiteAb from the following open publication (https://pubmed.ncbi.nlm.nih.gov/32529267), licensed under a CC-BY license. Not internally tested by R&D Systems.
Detection of Podocalyxin by Western Blot
miR-671-5p aggravates beta -catenin-induced podocyte injury while miR-671-5p inhibitor ameliorates it in vitro. (A–C) Representative Western blot (A) and graphic presentations of WT1 (B) and podocalyxin (C) were presented. MPC5 cells were transfected with miR-671-5p mimics (miR-671-5p) or/and beta -catenin expression plasmid (pDel-beta -cat) for 24 h *p < 0.05 versus pcDNA3 controls; †p < 0.05 versus pDel-beta -cat (n = 3). (D–H) Representative Western blot (D) and graphic presentations of podocalyxin (E), nephrin (F), ZO-1 (G) and WT1 (H) were presented. MPC5 cells were transfected with beta -catenin expression plasmid (pDel-beta -cat) or/and miR-671-5p inhibitor (AntimiR-671-5p) for 24 h *p < 0.05 (n = 3). (I) Representative micrographs show the expression of ZO-1 in different groups as indicated. MPC5 cells were transfected with beta -catenin expression plasmid (pDel-beta -cat) and miR-671-5p mimics (miR-671-5p)/miR-671-5p inhibitor (AntimiR-671-5p) for 24 h, respectively. Scale bar, 50 µm. Image collected and cropped by CiteAb from the following open publication (https://pubmed.ncbi.nlm.nih.gov/35111054), licensed under a CC-BY license. Not internally tested by R&D Systems.
Detection of Podocalyxin by Western Blot
Overexpression of miR-671-5p impairs but knockdown of miR-671-5p protects podocyte integrity in vitro. Mouse podocytes (MPC5) were transfected with miR-671-5p mimics (miR-671-5p) or negative control (miR-Ctrl) for 24 h. (A) qRT-PCR analysis shows the relative levels of miR-671-5p after transfection. *p < 0.05 (n = 3). (B–E) Representative Western blot (B) and graphic presentations of WT1 (C), ZO-1 (D) and podocalyxin (E) were presented. *p < 0.05 (n = 3). (F) Representative micrographs show the expression and distribution of ZO-1 in podocytes after miR-671-5p overexpression. Scale bar, 50 µm. (G–K) Inhibition of miR-671-5p protects podocyte integrity. MPC5 cells were transfected with miR-671-5p inhibitor (AntimiR-671-5p) or control (AntimiR-Ctrl) or for 24 h. Representative Western blot (G) and graphic presentations of WT1 (H), nephrin (I), podocalyxin (J) and ZO-1 (K) were presented. *p < 0.05 (n = 3). Image collected and cropped by CiteAb from the following open publication (https://pubmed.ncbi.nlm.nih.gov/35111054), licensed under a CC-BY license. Not internally tested by R&D Systems.
Detection of Podocalyxin by Western Blot
miR-671-5p aggravates beta -catenin-induced podocyte injury while miR-671-5p inhibitor ameliorates it in vitro. (A–C) Representative Western blot (A) and graphic presentations of WT1 (B) and podocalyxin (C) were presented. MPC5 cells were transfected with miR-671-5p mimics (miR-671-5p) or/and beta -catenin expression plasmid (pDel-beta -cat) for 24 h *p < 0.05 versus pcDNA3 controls; †p < 0.05 versus pDel-beta -cat (n = 3). (D–H) Representative Western blot (D) and graphic presentations of podocalyxin (E), nephrin (F), ZO-1 (G) and WT1 (H) were presented. MPC5 cells were transfected with beta -catenin expression plasmid (pDel-beta -cat) or/and miR-671-5p inhibitor (AntimiR-671-5p) for 24 h *p < 0.05 (n = 3). (I) Representative micrographs show the expression of ZO-1 in different groups as indicated. MPC5 cells were transfected with beta -catenin expression plasmid (pDel-beta -cat) and miR-671-5p mimics (miR-671-5p)/miR-671-5p inhibitor (AntimiR-671-5p) for 24 h, respectively. Scale bar, 50 µm. Image collected and cropped by CiteAb from the following open publication (https://pubmed.ncbi.nlm.nih.gov/35111054), licensed under a CC-BY license. Not internally tested by R&D Systems.
Detection of Podocalyxin by Western Blot
Inhibition of miR-671-5p reduces proteinuria and renal fibrotic lesions in ADR nephropathy. (A) Experimental design. Red Arrows indicate the time of ADR injection. Green arrows indicate the different time points of antagomir injections. (B) qRT-PCR analysis shows that miR-671-5p level was increased in ADR group compared with control, and injections of antimiR-671-5p decreased miR-671-5p level. *p < 0.05 versus normal controls; †p < 0.05 versus ADR (n = 5–6). (C) Inhibition of miR-671-5p reduces proteinuria in ADR nephropathy. Urinary albumin levels were assessed in mice at 2 weeks after ADR injection and expressed as mg/mg creatinine. *p < 0.05 versus normal controls; †p < 0.05 versus ADR (n = 5–6). (D–G) Representative Western blots (D) and graphic presentations of WT1 (E), podocalyxin (F) and nephrin (G) were presented. *p < 0.05 versus normal controls, †p < 0.05 versus ADR alone (n = 5–6). (H) Immunofluorescence staining shows that antimiR-671-5p preserved renal podocalyxin expression in ADR nephropathy. Arrow indicate positive staining. Scale bar, 20 µm. (I,J) Representative Western blots (I) and graphic presentations of fibronectin and alpha -SMA (J) were presented. *p < 0.05 versus normal controls, †p < 0.05 versus ADR alone (n = 5–6). (K) Representative micrographs show that antimiR-671-5p inhibited alpha -SMA expression (upper panel) and renal fibrotic lesions (bottom panel) in different groups as indicated. Scale bar, 50 µm. Image collected and cropped by CiteAb from the following open publication (https://pubmed.ncbi.nlm.nih.gov/35111054), licensed under a CC-BY license. Not internally tested by R&D Systems.Applications for Mouse Podocalyxin Antibody
Application
Recommended Usage
CyTOF-ready
Ready to be labeled using established conjugation methods. No BSA or other carrier proteins that could interfere with conjugation.
Flow Cytometry
0.25 µg/106 cells
Sample: D3 mouse embryonic stem cell line; Neuro-2A mouse neuroblastoma cell line
Sample: D3 mouse embryonic stem cell line; Neuro-2A mouse neuroblastoma cell line
Immunohistochemistry
5-15 µg/mL
Sample: Perfusion fixed frozen sections of mouse thymus
Sample: Perfusion fixed frozen sections of mouse thymus
Western Blot
1 µg/mL
Sample: Mouse kidney tissue
Sample: Mouse kidney tissue
Reviewed Applications
Read 8 reviews rated 4.5 using AF1556 in the following applications:
Flow Cytometry Panel Builder
Bio-Techne Knows Flow Cytometry
Save time and reduce costly mistakes by quickly finding compatible reagents using the Panel Builder Tool.
Advanced Features
- Spectra Viewer - Custom analysis of spectra from multiple fluorochromes
- Spillover Popups - Visualize the spectra of individual fluorochromes
- Antigen Density Selector - Match fluorochrome brightness with antigen density

Formulation, Preparation, and Storage
Purification
Antigen Affinity-purified
Reconstitution
Reconstitute at 0.2 mg/mL in sterile PBS. For liquid material, refer to CoA for concentration.
Loading...
Formulation
Lyophilized from a 0.2 μm filtered solution in PBS with Trehalose. See Certificate of Analysis for details.
*Small pack size (-SP) is supplied either lyophilized or as a 0.2 µm filtered solution in PBS.
*Small pack size (-SP) is supplied either lyophilized or as a 0.2 µm filtered solution in PBS.
Shipping
Lyophilized product is shipped at ambient temperature. Liquid small pack size (-SP) is shipped with polar packs. Upon receipt, store immediately at the temperature recommended below.
Stability & Storage
Use a manual defrost freezer and avoid repeated freeze-thaw cycles.
- 12 months from date of receipt, -20 to -70 °C as supplied.
- 1 month, 2 to 8 °C under sterile conditions after reconstitution.
- 6 months, -20 to -70 °C under sterile conditions after reconstitution.
Calculators
Background: Podocalyxin
References
- Li, J. et al. (2001) DNA Seq. 12(5):407.
- Hara, T. et al. (1999) Immunity 11(5):567.
Alternate Names
GCTM, PCLP, POD XL, PODXL
Gene Symbol
PODXL
UniProt
Additional Podocalyxin Products
Product Documents for Mouse Podocalyxin Antibody
Certificate of Analysis
To download a Certificate of Analysis, please enter a lot or batch number in the search box below.
Note: Certificate of Analysis not available for kit components.
Product Specific Notices for Mouse Podocalyxin Antibody
For research use only
Related Research Areas
Citations for Mouse Podocalyxin Antibody
 Powered by Bioz
Customer Reviews for Mouse Podocalyxin Antibody (8)
4.5 out of 5
8 Customer Ratings
Have you used Mouse Podocalyxin Antibody?
Submit a review and receive an Amazon gift card!
$25/€18/£15/$25CAN/¥2500 Yen for a review with an image
$10/€7/£6/$10CAN/¥1110 Yen for a review without an image
Submit a review
Customer Images
Showing
1
-
5 of
8 reviews
Showing All
Filter By:
-
Application: Immunocytochemistry/ImmunofluorescenceSample Tested: Brain (cerebellum) tissueSpecies: MouseVerified Customer | Posted 03/22/2023

-
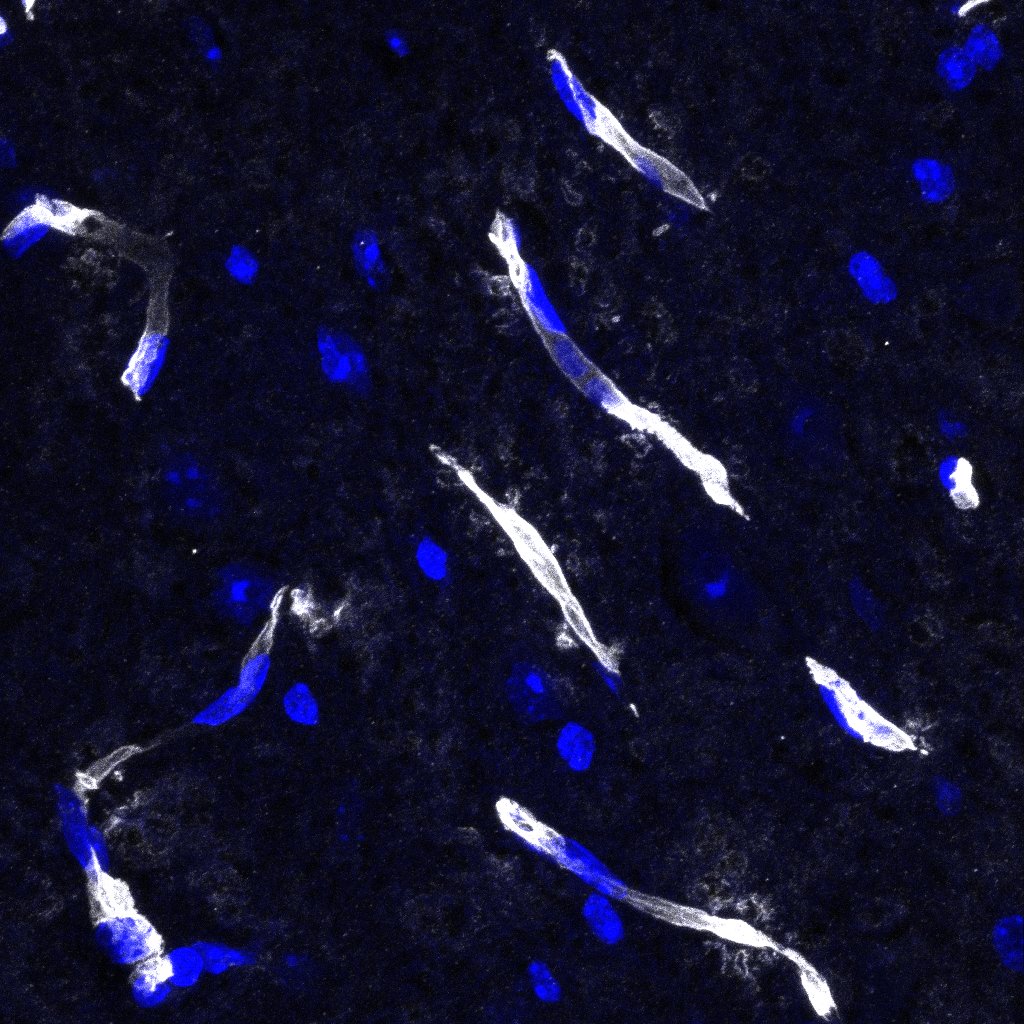
Application: ImmunohistochemistrySample Tested: Brain (vasculature)Species: MouseVerified Customer | Posted 03/08/2023Podocalyxin detection in formalin fixed paraffin embedded sections of mouse brain using Goat Anti-Mouse Podocalyxin Antigen Affinity-purified Polyclonal Antibody (Catalog # AF1556) at a dilution of 1:500 overnight at 4 °C. DAPI and Hoechst 33342 were used together for nuclear stain. The podocalyxin staining denoted micro vessels in brain sections for endothelial cell barrier disruption analysis by probing for serum protein deposition proximal to brain microvasculature. This image was taken on a Zeiss LSM 710 Confocal Microscope (META) with Zeiss Plan Apo 63x/1.40 oil
-
Application: Immunocytochemistry/ImmunofluorescenceSample Tested: Adult brainSpecies: MouseVerified Customer | Posted 05/04/2021Dilution 1:200
-
Application: ImmunohistochemistrySample Tested: Adult heartSpecies: MouseVerified Customer | Posted 02/20/201710um think hearts sections. Fixed with 4% PFA at RT for 10mins, permeabilized using 0.3% triton for 30mins at RT followed by 1% BSA block. Incubated with Goat Podocalyxin (1/100 concentration) at 4’C – O/N. Washed using 1xPBS, Detected using Donkey anti-goat alexa 568 (1/200 concentration). Washed and mounted using prolong antifade reagent with DAPI
-
Sample Tested: Tracheal whole mountSpecies: MouseVerified Customer | Posted 04/22/2016Immunofluorescence staining of whole mount tracheal blood vessels. 1:200 dilution
-
Application: Immunohistochemistry-ParaffinSample Tested: See PMID 24100472Species: RatVerified Customer | Posted 01/05/2015
-
Application: ImmunofluorescenceSample Tested: See PMID 23338608Species: MouseVerified Customer | Posted 01/05/2015
-
Application: ImmunocytochemistrySample Tested: See PMID 24306541Species: HumanVerified Customer | Posted 01/05/2015
There are no reviews that match your criteria.
Protocols
Find general support by application which include: protocols, troubleshooting, illustrated assays, videos and webinars.
- 7-Amino Actinomycin D (7-AAD) Cell Viability Flow Cytometry Protocol
- Antigen Retrieval Protocol (PIER)
- Antigen Retrieval for Frozen Sections Protocol
- Appropriate Fixation of IHC/ICC Samples
- Cellular Response to Hypoxia Protocols
- Chromogenic IHC Staining of Formalin-Fixed Paraffin-Embedded (FFPE) Tissue Protocol
- Chromogenic Immunohistochemistry Staining of Frozen Tissue
- ClariTSA™ Fluorophore Kits
- Detection & Visualization of Antibody Binding
- Extracellular Membrane Flow Cytometry Protocol
- Flow Cytometry Protocol for Cell Surface Markers
- Flow Cytometry Protocol for Staining Membrane Associated Proteins
- Flow Cytometry Staining Protocols
- Flow Cytometry Troubleshooting Guide
- Fluorescent IHC Staining of Frozen Tissue Protocol
- Graphic Protocol for Heat-induced Epitope Retrieval
- Graphic Protocol for the Preparation and Fluorescent IHC Staining of Frozen Tissue Sections
- Graphic Protocol for the Preparation and Fluorescent IHC Staining of Paraffin-embedded Tissue Sections
- Graphic Protocol for the Preparation of Gelatin-coated Slides for Histological Tissue Sections
- IHC Sample Preparation (Frozen sections vs Paraffin)
- Immunofluorescent IHC Staining of Formalin-Fixed Paraffin-Embedded (FFPE) Tissue Protocol
- Immunohistochemistry (IHC) and Immunocytochemistry (ICC) Protocols
- Immunohistochemistry Frozen Troubleshooting
- Immunohistochemistry Paraffin Troubleshooting
- Intracellular Flow Cytometry Protocol Using Alcohol (Methanol)
- Intracellular Flow Cytometry Protocol Using Detergents
- Intracellular Nuclear Staining Flow Cytometry Protocol Using Detergents
- Intracellular Staining Flow Cytometry Protocol Using Alcohol Permeabilization
- Intracellular Staining Flow Cytometry Protocol Using Detergents to Permeabilize Cells
- Preparing Samples for IHC/ICC Experiments
- Preventing Non-Specific Staining (Non-Specific Binding)
- Primary Antibody Selection & Optimization
- Propidium Iodide Cell Viability Flow Cytometry Protocol
- Protocol for Heat-Induced Epitope Retrieval (HIER)
- Protocol for Liperfluo
- Protocol for Making a 4% Formaldehyde Solution in PBS
- Protocol for VisUCyte™ HRP Polymer Detection Reagent
- Protocol for the Characterization of Human Th22 Cells
- Protocol for the Characterization of Human Th9 Cells
- Protocol for the Preparation & Fixation of Cells on Coverslips
- Protocol for the Preparation and Chromogenic IHC Staining of Frozen Tissue Sections
- Protocol for the Preparation and Chromogenic IHC Staining of Frozen Tissue Sections - Graphic
- Protocol for the Preparation and Chromogenic IHC Staining of Paraffin-embedded Tissue Sections
- Protocol for the Preparation and Chromogenic IHC Staining of Paraffin-embedded Tissue Sections - Graphic
- Protocol for the Preparation and Fluorescent IHC Staining of Frozen Tissue Sections
- Protocol for the Preparation and Fluorescent IHC Staining of Paraffin-embedded Tissue Sections
- Protocol for the Preparation of Gelatin-coated Slides for Histological Tissue Sections
- Protocol: Annexin V and PI Staining by Flow Cytometry
- Protocol: Annexin V and PI Staining for Apoptosis by Flow Cytometry
- R&D Systems Quality Control Western Blot Protocol
- TUNEL and Active Caspase-3 Detection by IHC/ICC Protocol
- The Importance of IHC/ICC Controls
- Troubleshooting Guide: Fluorokine Flow Cytometry Kits
- Troubleshooting Guide: Immunohistochemistry
- Troubleshooting Guide: Western Blot Figures
- Western Blot Conditions
- Western Blot Protocol
- Western Blot Protocol for Cell Lysates
- Western Blot Troubleshooting
- Western Blot Troubleshooting Guide
- View all Protocols, Troubleshooting, Illustrated assays and Webinars
Loading...