p62/SQSTM1 Antibody - BSA Free
Novus Biologicals | Catalog # NBP1-48320
![Immunocytochemistry/ Immunofluorescence: p62/SQSTM1 Antibody - BSA Free [NBP1-48320]](https://resources.rndsystems.com/images/products/p62-SQSTM1-Antibody-Immunocytochemistry-Immunofluorescence-NBP1-48320-img0008.jpg "Immunocytochemistry/ Immunofluorescence: p62/SQSTM1 Antibody - BSA Free [NBP1-48320]")
Key Product Details
Validated by
Biological Validation
Species Reactivity
Validated:
Human, Mouse, Rat, Chicken
Cited:
Human, Mouse, Rat, Porcine, Avian - Chicken
Predicted:
Bovine (97%), Canine (91%), Chinese Hamster (98%), Invertebrate (97%), Porcine (96%), Sheep (98%). Backed by our 100% Guarantee.
Applications
Validated:
Immunohistochemistry, Immunohistochemistry-Paraffin, Immunohistochemistry-Frozen, Immunohistochemistry Free-Floating, Western Blot, Flow Cytometry, Immunocytochemistry/ Immunofluorescence, Simple Western
Cited:
Immunohistochemistry-Paraffin, Immunohistochemistry-Frozen, Immunohistochemistry Free-Floating, Western Blot, Block/Neutralize, Flow Cytometry, Immunocytochemistry, Immunocytochemistry/ Immunofluorescence, Simple Western, IF/IHC
Label
Unconjugated
Antibody Source
Polyclonal Rabbit IgG
Format
BSA Free
Loading...
Product Specifications
Immunogen
Partial recombinant protein made to the C terminal of the human p62/SQSTM1 protein (within residues 300-440). [Swiss-Prot Q13501]
Reactivity Notes
Use in Chicken reported in scientific literature (PMID:33360697) Immunogen sequence is 100% identical to several non-human primates/monkey species. Immunogen displays the following percentage of sequence identity for non-tested species: Chinese hamster (98%), Sheep (98%), Bovine (97%), Porcine (96%), Canine (91%), Daphnia magna, a cladoceran/crustaceans invertebrate (97%) and Duck and several other Birds (84%).
Localization
Cytoplasm. Late endosome. Nucleus.
Clonality
Polyclonal
Host
Rabbit
Isotype
IgG
Scientific Data Images for p62/SQSTM1 Antibody - BSA Free
Immunocytochemistry/ Immunofluorescence: p62/SQSTM1 Antibody - BSA Free [NBP1-48320]
Immunocytochemistry/Immunofluorescence: p62/SQSTM1 Antibody - BSA Free [NBP1-48320] - p62/SQSTM1 Antibody [NBP1-48320] - HeLa cells were treated overnight with 50uM CQ, then fixed for 10 minutes using 10% formalin and then permeabilized for 5 minutes using 1X TBS + 0.5% Triton X-100. The cells were incubated with anti-p628/SQSTM1 at a 1:200 dilution overnight at 4C and detected with an anti-rabbit Dylight 488 (Green) at a 1:500 dilution. Alpha tubulin (DM1A) NB100-690 was used as a co-stain at a 1:1000 dilution and detected with an anti-mouse DyLight 550 (Red) at a 1:500 dilution. Nuclei were counterstained with DAPI (Blue). Cells were imaged using a 40X objective.![Simple Western: p62/SQSTM1 AntibodyBSA Free [NBP1-48320]](https://resources.rndsystems.com/images/products/p62-SQSTM1-Antibody-Simple-Western-NBP1-48320-img0005.jpg "Simple Western: p62/SQSTM1 AntibodyBSA Free [NBP1-48320]")
Simple Western: p62/SQSTM1 AntibodyBSA Free [NBP1-48320]
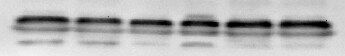
Simple Western: p62/SQSTM1 Antibody - BSA Free [NBP1-48320] - p62/SQSTM1 Antibody [NBP1-48320] - Lane view shows a specific band for p62/SQSTM1 in 1.0 mg/ml of HeLa lysate. This experiment was performed under reducing conditions using the 12-230 kDa separation system.![Western Blot: p62/SQSTM1 AntibodyBSA Free [NBP1-48320]](https://resources.rndsystems.com/images/products/p62-SQSTM1-Antibody-Western-Blot-NBP1-48320-img0006.jpg "Western Blot: p62/SQSTM1 AntibodyBSA Free [NBP1-48320]")
Western Blot: p62/SQSTM1 AntibodyBSA Free [NBP1-48320]
Western Blot: p62/SQSTM1 Antibody - BSA Free [NBP1-48320] - p62/SQSTM1 Antibody [NBP1-48320] - Cultured HeLa cells were treated with or without 50 uM chloriquine for 24 hours as indicated. Cell lysates were prepared and separated on a 12% gel by SDS-PAGE. Protein was transferred to PVDF membrane and blocked in 5% non-fat milk. The membrane was then probed with 1 ug/ml anti-p62/SQSMT1 in 1% milk and dectected with an anti-rabbit HRP secondary antibody using chemiluminescence. Note the upregulation of p62 (arrowhead) in response to chloroquine treatment and the blockage of autophagy.![Western Blot: p62/SQSTM1 AntibodyBSA Free [NBP1-48320]](https://resources.rndsystems.com/images/products/p62-SQSTM1-Antibody-Western-Blot-NBP1-48320-img0012.jpg "Western Blot: p62/SQSTM1 AntibodyBSA Free [NBP1-48320]")
![Immunocytochemistry/ Immunofluorescence: p62/SQSTM1 Antibody - BSA Free [NBP1-48320]](https://resources.rndsystems.com/images/products/p62-SQSTM1-Antibody-Immunocytochemistry-Immunofluorescence-NBP1-48320-img0009.jpg "Immunocytochemistry/ Immunofluorescence: p62/SQSTM1 Antibody - BSA Free [NBP1-48320]")
Immunocytochemistry/ Immunofluorescence: p62/SQSTM1 Antibody - BSA Free [NBP1-48320]
Immunocytochemistry/Immunofluorescence: p62/SQSTM1 Antibody - BSA Free [NBP1-48320] - p62/SQSTM1 Antibody [NBP1-48320] - Untreated HeLa cells were fixed for 10 minutes using 10% formalin and then permeabilized for 5 minutes using 1X TBS + 0.5% Triton X-100. The cells were incubated with anti-p628/SQSTM1 at a 1:200 dilution overnight at 4C and detected with an anti-rabbit DyLight 488 (Green) at a 1:500 dilution. Alpha tubulin (DM1A) NB100-690 was used as a co-stain at a 1:1000 dilution and detected with an anti-mouse DyLight 550 (Red) at a 1:500 dilution. Nuclei were counterstained with DAPI (Blue). Cells were imaged using a 40X objective.![Western Blot: p62/SQSTM1 AntibodyBSA Free [NBP1-48320]](https://resources.rndsystems.com/images/products/p62-SQSTM1-Antibody-Western-Blot-NBP1-48320-img0010.jpg "Western Blot: p62/SQSTM1 AntibodyBSA Free [NBP1-48320]")
Western Blot: p62/SQSTM1 AntibodyBSA Free [NBP1-48320]
Western Blot: p62/SQSTM1 Antibody - BSA Free [NBP1-48320] - p62/SQSTM1 Antibody [NBP1-48320] - Vacuolin-1 analogues identified via virtual screening inhibited autophagic flux in HeLa cells. (A) Treatment of HeLa cells with vacuolin-1 analogues (10 M) and BAF (100 nM) failed to further increase the accumulation of both LC3B-II and SQSTM1 as compared to either drug alone. (B) Vacuolin-1 (10 M) or VS6 (10 M) induced the accumulation of yellow LC3B-II puncta in RFP-GFP-LC3B expressing HeLa cells. Scale bar = 10 m. Identification of Novel Vacuolin-1 Analogues as Autophagy Inhibitors by Virtual Drug Screening and Chemical Synthesis. Molecules (2017)![Western Blot: p62/SQSTM1 AntibodyBSA Free [NBP1-48320]](https://resources.rndsystems.com/images/products/p62-SQSTM1-Antibody-Western-Blot-NBP1-48320-img0011.jpg "Western Blot: p62/SQSTM1 AntibodyBSA Free [NBP1-48320]")
Western Blot: p62/SQSTM1 AntibodyBSA Free [NBP1-48320]
Western Blot: p62/SQSTM1 Antibody - BSA Free [NBP1-48320] - p62/SQSTM1 Antibody [NBP1-48320] - Vacuolin-1 analogues identified via virtual screening induced the accumulation of both LC3B-II and SQSTM1 in HeLa cells in a dose dependent manner after a 6 h treatment. Identification of Novel Vacuolin-1 Analogues as Autophagy Inhibitors by Virtual Drug Screening and Chemical Synthesis. Molecules (2017)
Simple Western: p62/SQSTM1 Antibody - BSA Free [NBP1-48320] -
Simple Western: p62/SQSTM1 Antibody - BSA Free [NBP1-48320] - Drp1+/- mice is protective against autophagy impairment induced by Mn. (A) Representative images of the coronal mouse midbrain section (20um) co-immunostained for DA neurons (TH, red) in the SNpc and GABA neurons (GAD67, green) in the SNpr. Both of these brain regions were removed by laser microdissection for immunoblotting of p62 (top panels) in DA neurons (B) and GABA neurons (C). Total proteins per lane (bottom panels) were used as loading control. (D) Quantified levels of p62 were significantly increased in DA neurons (P = 0.0013), but not in the GABA neurons (P = 0.5457), of the Mn-treated WT mice. Mn did not significantly increase p62 in DA neurons of the Drp1+/- mice (P = 0.8660) No significant baseline level differences between the two genotypes were observed (P = 0.5664 for TH neurons and P = 0.7675 for GABA neurons. Data represent mean +- SEM, n = 5 for WT control, n = 6 for other groups), two-way ANOVA followed by Tukey post-hoc test. (E) Representative confocal images of mitochondrial morphology of DA neurons after TOM20 immunostaining (upper panels), then skeletonized (middle panels) for subsequent analysis. Scale bar 20um. (F, G) Various parameters of mitochondrial morphology were quantified using Fiji MiNA plugin. Data represents mean +- SEM (n = 6 mice per group), analyzed by one-way ANOVA, followed by Tukey post-hoc test Image collected and cropped by CiteAb from the following publication (https://molecularneurodegeneration.biomedcentral.com/articles/10.1186/s… ), licensed under a CC-BY license. Not internally tested by Novus Biologicals.
Immunocytochemistry/ Immunofluorescence: p62/SQSTM1 Antibody - BSA Free [NBP1-48320] -
Autophagy associated protein immunoreactivity in HIV-infected brain tissue. (A) Representative images from five randomly selected fields of cells each examined in duplicate frontal lobe white matter sections for the indicated subject groups. The indicated proteins were labeled red & microglia with the cell-type-specific marker Iba1 (green). Blue staining indicates cell nuclei. Arrow heads indicate examples of higher Iba1 immunoreactivity whereas arrows indicate more focal (punctal) vs. diffuse (filamentous) patterns of autophagy associated protein expression. Scale bar = 10 μm. (B) Quantification of relative Iba1 immunoreactivity from (A). F(3,20) = 6.450, p = 0.0031; ∗p < 0.05 when compared to all other subject groups. Error bars show the SEM for the average values of 2–6 regions from each subject group across the six autophagy associated proteins examined. (C) Quantification of the indicated autophagy associated protein relative immunoreactivity from (A). Beclin 1: F(3,12) = 11.29, p = 0.0008; LC3B: F(3,12) = 1.994, p = 0.1687; APG7/ATG7: F(3,12) = 84.20, p = < 0.0001; ATG5: F(3,12) = 6.218, p = 0.0086; p62/SQSTM1: F(3,12) = 87.04, p = < 0.0001; LAMP1: F(3,12) = 8.317, p = 0.0029. ∗p < 0.05 when compared to HIV-negative; #p < 0.05 when compared to HIV-positive; & Ωp < 0.05 when compared to HIV-positive/NCI subjects. Error bars show the SEM for four regions from each subject group. Image collected & cropped by CiteAb from the following publication (http://journal.frontiersin.org/Article/10.3389/fmicb.2015.00653/abstract), licensed under a CC-BY license. Not internally tested by Novus Biologicals.
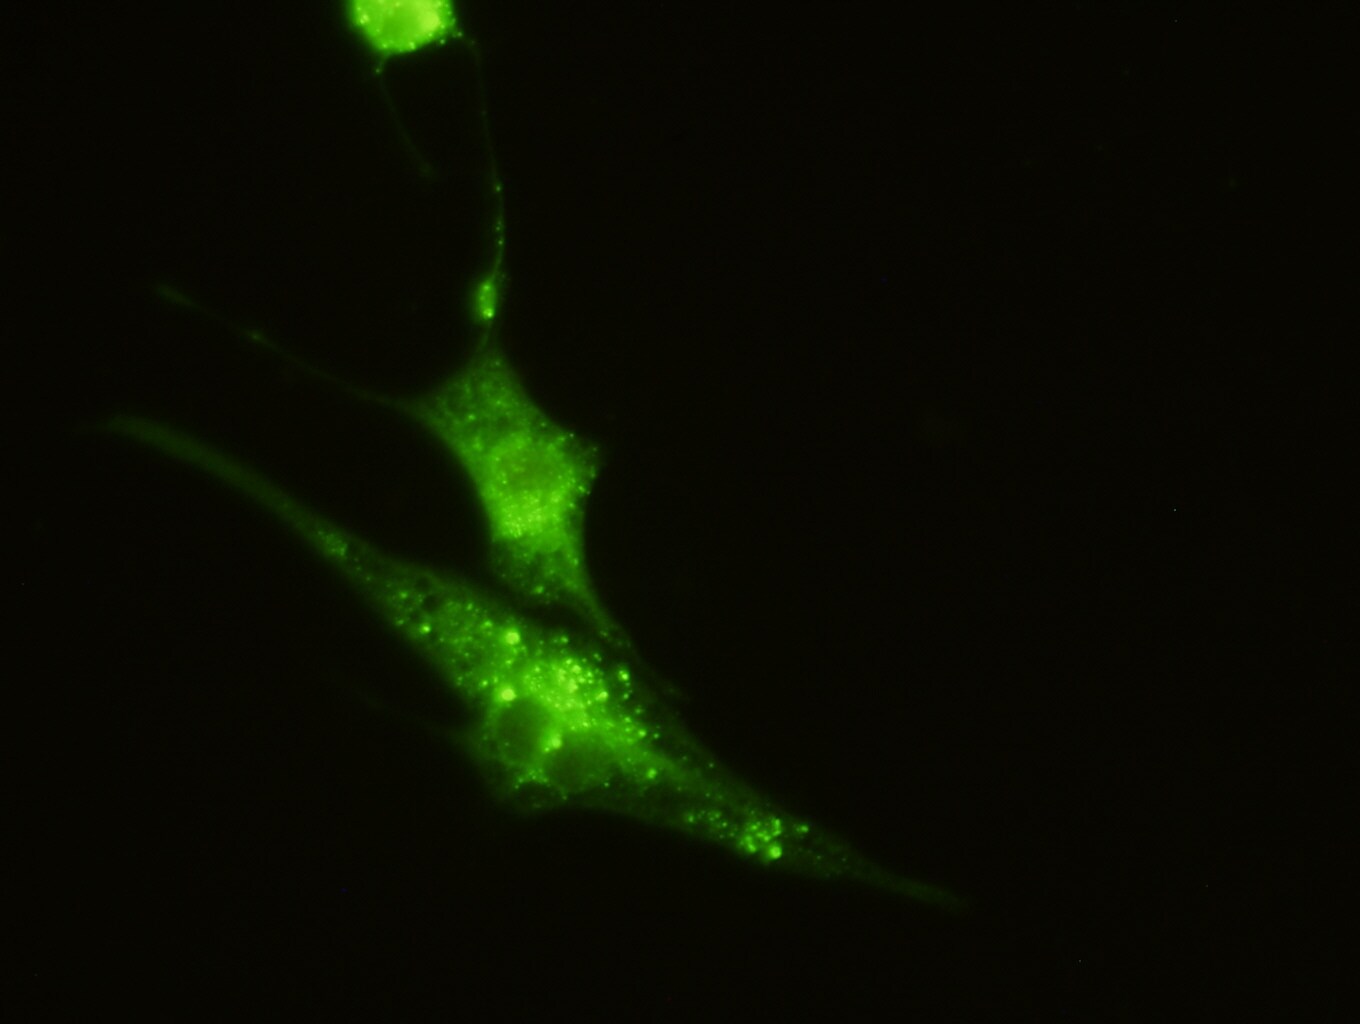
Immunocytochemistry/ Immunofluorescence: p62/SQSTM1 Antibody - BSA Free [NBP1-48320] -
Immunocytochemistry/ Immunofluorescence: p62/SQSTM1 Antibody - BSA Free [NBP1-48320] - Effects on autophagic activity & dendritic length of neurons exposed to supernatant from HIV-1-infected microglia in combination with morphine. (A) Representative images of neurons with the indicated treatments. Sup, supernatant from uninfected [HIV(-)] & HIV-1-infected [HIV(+)] microglia. Cells were immunolabeled with antibodies to the autophagic activity marker p62/SQSTM1 (red) & the neuronal cell-type-specific marker MAP2 (green). DAPI (blue) staining indicates cell nuclei. (B) Quantification of p62/SQSTM1 immunoreactivity from (A). Data are presented as the percentage of control cells which was set at 100; F(5,24) = 5.882, p = 0.0011; ∗p < 0.05 when compared to HIV(+)Sup + morphine treatment. (C) Western blotting analysis of p62/SQSTM1 & LAMP1 expression levels for the indicated treatments. GAPDH was used as a loading control. Blots are representative of three independent experiments. (D) Measurement of dendrite length from (A). F(5,24) = 26.15, p = < 0.0001; Φp < 0.05 when compared to morphine; Ψp < 0.05 when compared to HIV(-)Sup; Ωp < 0.05 when compared to HIV(-)Sup + morphine; #p < 0.05 when compared to HIV(+)Sup; & ∗p < 0.05 when compared to HIV(+)Sup + morphine treatment. Error bars show the SEM for five randomly selected fields totaling at least 100 cells from each group. Image collected & cropped by CiteAb from the following publication (http://journal.frontiersin.org/Article/10.3389/fmicb.2015.00653/abstract), licensed under a CC-BY license. Not internally tested by Novus Biologicals.
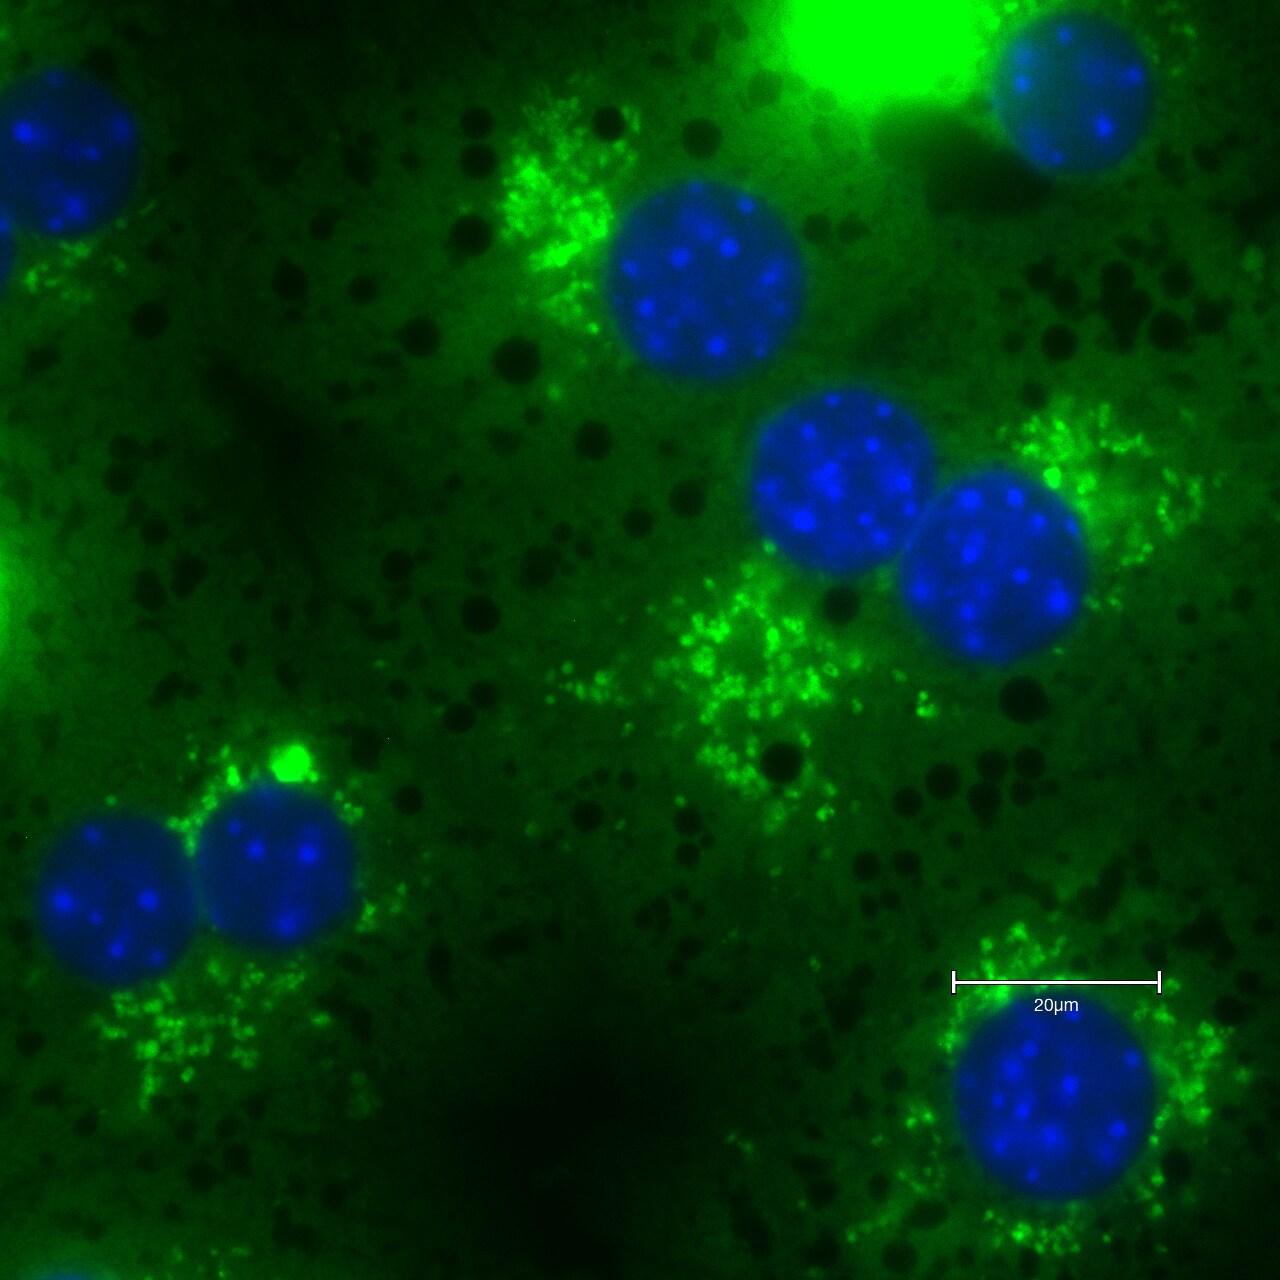
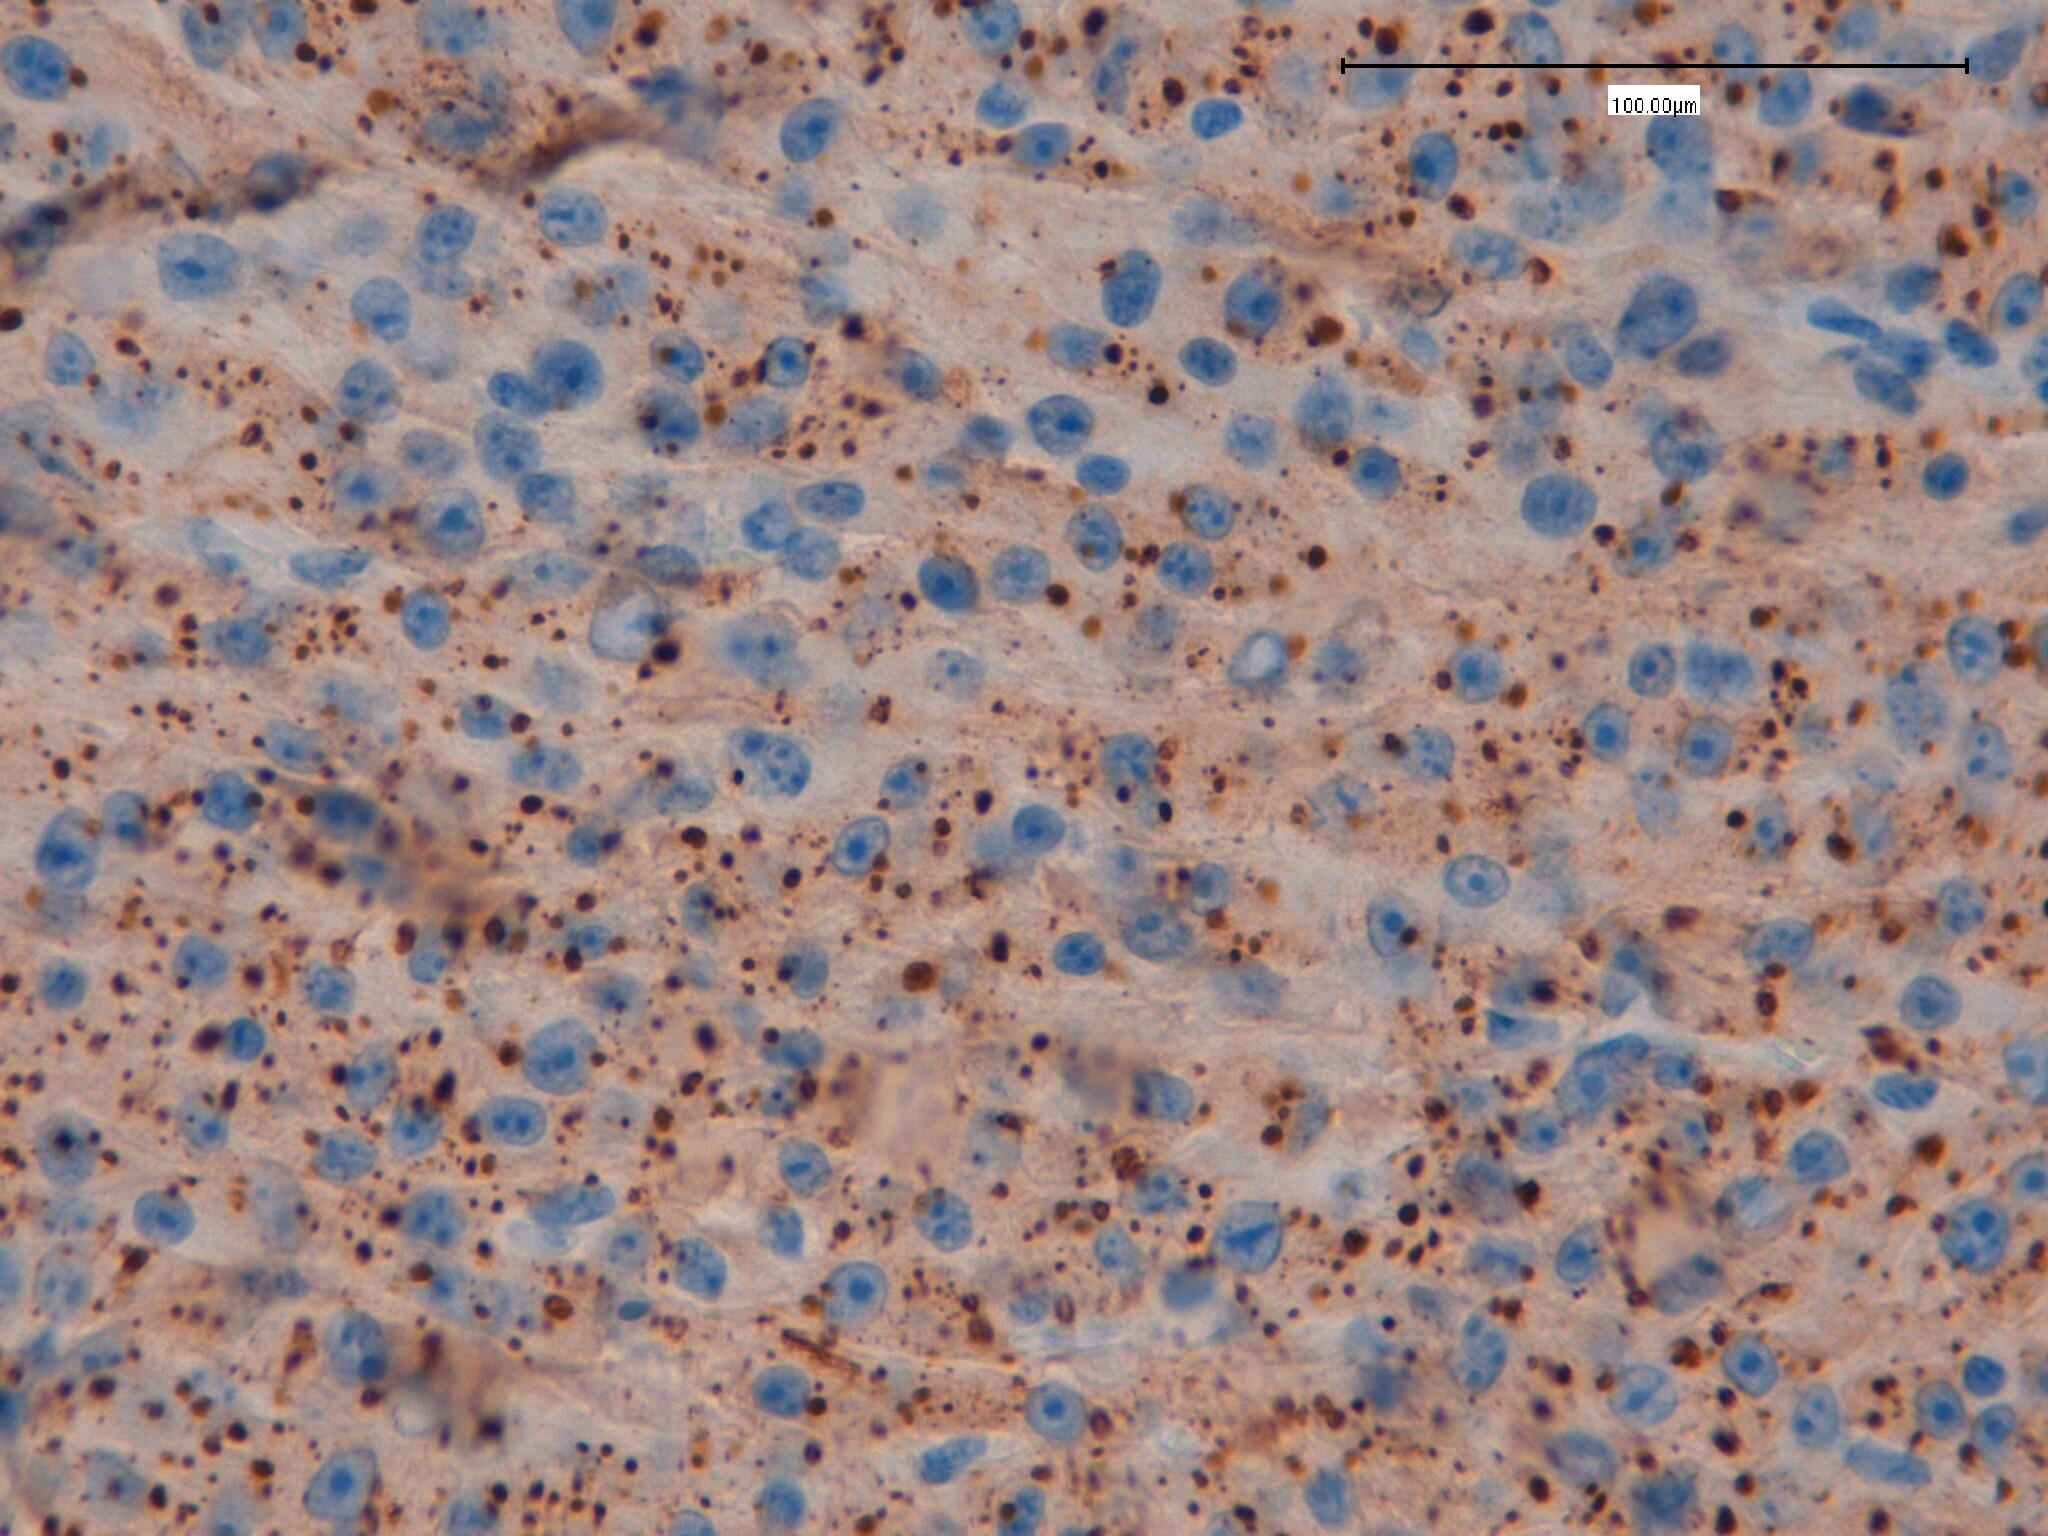
Immunocytochemistry/Immunofluorescence: Rabbit Polyclonal p62/SQSTM1 Antibody [NBP1-48320]
Immunocytochemistry/Immunofluorescence: Rabbit Polyclonal p62/SQSTM1 Antibody [NBP1-48320] - Mice hepatocytes stained with p62/SQSTM1 Antibody. Image from a verified customer review.Applications for p62/SQSTM1 Antibody - BSA Free
Application
Recommended Usage
Immunocytochemistry/ Immunofluorescence
1:25-1:200
Immunohistochemistry Free-Floating
reported in scientific literature (PMID 35389045)
Simple Western
1:25
Western Blot
1:4000
Reviewed Applications
Read 8 reviews rated 4.8 using NBP1-48320 in the following applications:
Flow Cytometry Panel Builder
Bio-Techne Knows Flow Cytometry
Save time and reduce costly mistakes by quickly finding compatible reagents using the Panel Builder Tool.
Advanced Features
- Spectra Viewer - Custom analysis of spectra from multiple fluorochromes
- Spillover Popups - Visualize the spectra of individual fluorochromes
- Antigen Density Selector - Match fluorochrome brightness with antigen density

Formulation, Preparation, and Storage
Purification
Immunogen affinity purified
Formulation
PBS
Format
BSA Free
Preservative
0.02% Sodium Azide
Concentration
1.0 mg/ml
Shipping
The product is shipped with polar packs. Upon receipt, store it immediately at the temperature recommended below.
Stability & Storage
Store at -20C. Avoid freeze-thaw cycles.
Background: p62/SQSTM1
Abnormal function of p62/SQSTM1 is associated with a range of disease states such as neurodegeneration, cancer, and metabolic disorders (2). Mutations in the p62/SQSTM1 sequence have been linked to Paget's disease of the bone, amyotrophic lateral sclerosis, and frontotemporal lobar degeneration. In Parkinson's disease, p62/SQSTM1 has been linked to microglia activation and subsequent neuroinflammation (3). Functionally, p62/SQSTM1 is involved in a broad range of cellular processes such as amino acid sensing by interaction with mTORC1, oxidative stress response through interaction with Keap1, and targeting cargo for autophagy by interacting with ubiquitin labeled proteins (1).
To induce selective autophagy, p62/SQSTM1 forms long oligomers or helical filaments which interact with LC3 and ubiquitin labeled proteins and lead to the initiation of the autophagosome formation (2). p62/SQSTM1 is not only a selective autophagy receptor but also an autophagy substrate, as its engulfed by the autophagosome and degraded by the autophagolysosome. Monitoring LC3 levels is the standard for assessing autophagic flux, however monitoring p62/SQSTM1 levels by Western blot in the presence and absence of autophagy inhibitors (e.g., Chloroquine) is also a common practice (4). Besides its activity as a selective autophagy receptor, p62/SQSTM1 also plays a role as an adaptor in signaling cascades leading to NFkB activation downstream of TNF-R, IL-1 beta R, TrkA and p75NTR. Briefly, for NFkB signaling downstream of the TNF-R activation, p62/SQSTM1 engages RIP1 kinase and PKC iota/lambda through the ZZ and PB1 domains, respectively (5).
References
1.Katsuragi, Y., Ichimura, Y., & Komatsu, M. (2015). P62/SQSTM1 functions as a signaling hub and an autophagy adaptor. FEBS Journal. https://doi.org/10.1111/febs.13540
2. Sanchez-Martin, P., & Komatsu, M. (2018). p62/SQSTM1 - Steering the cell through health and disease. Journal of Cell Science. https://doi.org/10.1242/jcs.222836
3. Yao, L., Zhu, Z., Wu, J., Zhang, Y., Zhang, H., Sun, X.,... Lu, G. (2019). MicroRNA-124 regulates the expression of p62/p38 and promotes autophagy in the inflammatory pathogenesis of Parkinson's disease. The FASEB Journal. https://doi.org/10.1096/fj.201900363r
4 Klionsky, D. J., Abdelmohsen, K., Abe, A., Abedin, M. J., Abeliovich, H., Arozena, A. A.,... Zughaier, S. M. (2016). Guidelines for the use and interpretation of assays for monitoring autophagy (3rd edition). Autophagy. https://doi.org/10.1080/15548627.2015.1100356
5. Bitto, A., Lerner, C. A., Nacarelli, T., Crowe, E., Torres, C., & Sell, C. (2014). p62/SQSTM1 at the interface of aging, autophagy, and disease. Age. https://doi.org/10.1007/s11357-014-9626-3
Long Name
Sequestosome 1
Alternate Names
A170, EBIAP, ORCA, OSIL, PDB3, Sequestosome 1, SQSTM1, ZIP3
Gene Symbol
SQSTM1
UniProt
Additional p62/SQSTM1 Products
Product Documents for p62/SQSTM1 Antibody - BSA Free
Certificate of Analysis
To download a Certificate of Analysis, please enter a lot or batch number in the search box below.
Product Specific Notices for p62/SQSTM1 Antibody - BSA Free
This product is for research use only and is not approved for use in humans or in clinical diagnosis. Primary Antibodies are guaranteed for 1 year from date of receipt.
Related Research Areas
Citations for p62/SQSTM1 Antibody - BSA Free
 Powered by Bioz
Customer Reviews for p62/SQSTM1 Antibody - BSA Free (8)
4.8 out of 5
8 Customer Ratings
Have you used p62/SQSTM1 Antibody - BSA Free?
Submit a review and receive an Amazon gift card!
$25/€18/£15/$25CAN/¥2500 Yen for a review with an image
$10/€7/£6/$10CAN/¥1110 Yen for a review without an image
Submit a review
Customer Images
Showing
1
-
5 of
8 reviews
Showing All
Filter By:
-
Application: ImmunofluorescenceSample Tested: Primary mouse hepatocytesSpecies: MouseVerified Customer | Posted 11/19/2024Mice hepatocytes stained with NBP1-48320

-
Application: Western BlotSample Tested: Brain tissueSpecies: HumanVerified Customer | Posted 12/11/2017
-
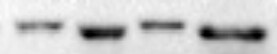
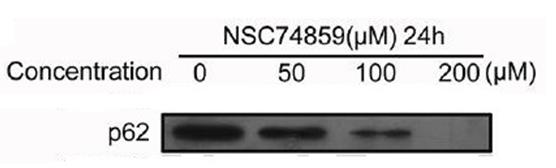
Application: Western BlotSample Tested: head and neck squamous cell carcinoma and Human HNSCC cell lines CAL27Species: HumanVerified Customer | Posted 10/30/2017CAL27 cells were treated with different concentration of NSC74859 for 24 h, then detected p62 by western blot analysis
-
Application: ImmunocytochemistrySample Tested: U87MG cells treated with chloroquineSpecies: HumanVerified Customer | Posted 09/01/2017
-
Application: Immunohistochemistry-ParaffinSample Tested: human U87MG glioblastoma cells xenograft following cloroquine treatmentSpecies: HumanVerified Customer | Posted 09/01/2017
-
Application: Western BlotSample Tested: See PMID 23931340Species: HumanVerified Customer | Posted 12/23/2014
-
Application: Western BlotSample Tested:Species: MouseVerified Customer | Posted 11/15/2013
-
Application: Western BlotSample Tested: HumanSpecies: HumanVerified Customer | Posted 12/23/2011
There are no reviews that match your criteria.
Protocols
View specific protocols for p62/SQSTM1 Antibody - BSA Free (NBP1-48320):
Immunocytochemistry Protocol
Culture cells to appropriate density in 35 mm culture dishes or 6-well plates.
1. Remove culture medium and wash the cells briefly in PBS. Add 10% formalin to the dish and fix at room temperature for 10 minutes.
2. Remove the formalin and wash the cells in PBS.
3. Permeablize the cells with 0.1% Triton X100 or other suitable detergent for 10 min.
4. Remove the permeablization buffer and wash three times for 10 minutes each in PBS. Be sure to not let the specimen dry out.
5. To block nonspecific antibody binding, incubate in 10% normal goat serum from 1 hour to overnight at room temperature.
6. Add primary antibody at appropriate dilution and incubate overnight at 4C.
7. Remove primary antibody and replace with PBS. Wash three times for 10 minutes each.
8. Add secondary antibody at appropriate dilution. Incubate for 1 hour at room temperature.
9. Remove secondary antibody and replace with PBS. Wash three times for 10 minutes each.
10. Counter stain DNA with DAPi if required.
Immunohistochemistry-Paraffin Embedded Sections
Antigen Unmasking:
Bring slides to a boil in 10 mM sodium citrate buffer (pH 6.0) then maintain at a sub-boiling temperature for 10 minutes. Cool slides on bench-top for 30 minutes (keep slides in the sodium citrate buffer at all times).
Staining:
1. Wash sections in deionized water three times for 5 minutes each.
2. Wash sections in PBS for 5 minutes.
3. Block each section with 100-400 ul blocking solution (1% BSA in PBS) for 1 hour at room temperature.
4. Remove blocking solution and add 100-400 ul diluted primary antibody. Incubate overnight at 4 C.
5. Remove antibody solution and wash sections in wash buffer three times for 5 minutes each.
6. Add 100-400 ul HRP polymer conjugated secondary antibody. Incubate 30 minutes at room temperature.
7. Wash sections three times in wash buffer for 5 minutes each.
8. Add 100-400 ul DAB substrate to each section and monitor staining closely.
9. As soon as the sections develop, immerse slides in deionized water.
10. Counterstain sections in hematoxylin.
11. Wash sections in deionized water two times for 5 minutes each.
12. Dehydrate sections.
13. Mount coverslips.
Western Blot Protocol
1. Perform SDS-PAGE on samples to be analyzed, loading 10-25 ug of total protein per lane.
2. Transfer proteins to PVDF membrane according to the instructions provided by the manufacturer of the membrane and transfer apparatus.
3. Stain the membrane with Ponceau S (or similar product) to assess transfer success, and mark molecular weight standards where appropriate.
4. Rinse the blot TBS -0.05% Tween 20 (TBST).
5. Block the membrane in 5% Non-fat milk in TBST (blocking buffer) for at least 1 hour.
6. Wash the membrane in TBST three times for 10 minutes each.
7. Dilute primary antibody in blocking buffer and incubate overnight at 4C with gentle rocking.
8. Wash the membrane in TBST three times for 10 minutes each.
9. Incubate the membrane in diluted HRP conjugated secondary antibody in blocking buffer (as per manufacturer's instructions) for 1 hour at room temperature.
10. Wash the blot in TBST three times for 10 minutes each (this step can be repeated as required to reduce background).
11. Apply the detection reagent of choice in accordance with the manufacturer's instructions.
Find general support by application which include: protocols, troubleshooting, illustrated assays, videos and webinars.
- 7-Amino Actinomycin D (7-AAD) Cell Viability Flow Cytometry Protocol
- Antigen Retrieval Protocol (PIER)
- Antigen Retrieval for Frozen Sections Protocol
- Appropriate Fixation of IHC/ICC Samples
- Cellular Response to Hypoxia Protocols
- Chromogenic IHC Staining of Formalin-Fixed Paraffin-Embedded (FFPE) Tissue Protocol
- Chromogenic Immunohistochemistry Staining of Frozen Tissue
- ClariTSA™ Fluorophore Kits
- Detection & Visualization of Antibody Binding
- Extracellular Membrane Flow Cytometry Protocol
- Flow Cytometry Protocol for Cell Surface Markers
- Flow Cytometry Protocol for Staining Membrane Associated Proteins
- Flow Cytometry Staining Protocols
- Flow Cytometry Troubleshooting Guide
- Fluorescent IHC Staining of Frozen Tissue Protocol
- Graphic Protocol for Heat-induced Epitope Retrieval
- Graphic Protocol for the Preparation and Fluorescent IHC Staining of Frozen Tissue Sections
- Graphic Protocol for the Preparation and Fluorescent IHC Staining of Paraffin-embedded Tissue Sections
- Graphic Protocol for the Preparation of Gelatin-coated Slides for Histological Tissue Sections
- ICC Cell Smear Protocol for Suspension Cells
- ICC Immunocytochemistry Protocol Videos
- ICC for Adherent Cells
- IHC Sample Preparation (Frozen sections vs Paraffin)
- Immunocytochemistry (ICC) Protocol
- Immunocytochemistry Troubleshooting
- Immunofluorescence of Organoids Embedded in Cultrex Basement Membrane Extract
- Immunofluorescent IHC Staining of Formalin-Fixed Paraffin-Embedded (FFPE) Tissue Protocol
- Immunohistochemistry (IHC) and Immunocytochemistry (ICC) Protocols
- Immunohistochemistry Frozen Troubleshooting
- Immunohistochemistry Paraffin Troubleshooting
- Intracellular Flow Cytometry Protocol Using Alcohol (Methanol)
- Intracellular Flow Cytometry Protocol Using Detergents
- Intracellular Nuclear Staining Flow Cytometry Protocol Using Detergents
- Intracellular Staining Flow Cytometry Protocol Using Alcohol Permeabilization
- Intracellular Staining Flow Cytometry Protocol Using Detergents to Permeabilize Cells
- Preparing Samples for IHC/ICC Experiments
- Preventing Non-Specific Staining (Non-Specific Binding)
- Primary Antibody Selection & Optimization
- Propidium Iodide Cell Viability Flow Cytometry Protocol
- Protocol for Heat-Induced Epitope Retrieval (HIER)
- Protocol for Liperfluo
- Protocol for Making a 4% Formaldehyde Solution in PBS
- Protocol for VisUCyte™ HRP Polymer Detection Reagent
- Protocol for the Characterization of Human Th22 Cells
- Protocol for the Characterization of Human Th9 Cells
- Protocol for the Fluorescent ICC Staining of Cell Smears - Graphic
- Protocol for the Fluorescent ICC Staining of Cultured Cells on Coverslips - Graphic
- Protocol for the Preparation & Fixation of Cells on Coverslips
- Protocol for the Preparation and Chromogenic IHC Staining of Frozen Tissue Sections
- Protocol for the Preparation and Chromogenic IHC Staining of Frozen Tissue Sections - Graphic
- Protocol for the Preparation and Chromogenic IHC Staining of Paraffin-embedded Tissue Sections
- Protocol for the Preparation and Chromogenic IHC Staining of Paraffin-embedded Tissue Sections - Graphic
- Protocol for the Preparation and Fluorescent ICC Staining of Cells on Coverslips
- Protocol for the Preparation and Fluorescent ICC Staining of Non-adherent Cells
- Protocol for the Preparation and Fluorescent ICC Staining of Stem Cells on Coverslips
- Protocol for the Preparation and Fluorescent IHC Staining of Frozen Tissue Sections
- Protocol for the Preparation and Fluorescent IHC Staining of Paraffin-embedded Tissue Sections
- Protocol for the Preparation of Gelatin-coated Slides for Histological Tissue Sections
- Protocol for the Preparation of a Cell Smear for Non-adherent Cell ICC - Graphic
- Protocol: Annexin V and PI Staining by Flow Cytometry
- Protocol: Annexin V and PI Staining for Apoptosis by Flow Cytometry
- R&D Systems Quality Control Western Blot Protocol
- TUNEL and Active Caspase-3 Detection by IHC/ICC Protocol
- The Importance of IHC/ICC Controls
- Troubleshooting Guide: Fluorokine Flow Cytometry Kits
- Troubleshooting Guide: Immunohistochemistry
- Troubleshooting Guide: Western Blot Figures
- Western Blot Conditions
- Western Blot Protocol
- Western Blot Protocol for Cell Lysates
- Western Blot Troubleshooting
- Western Blot Troubleshooting Guide
- View all Protocols, Troubleshooting, Illustrated assays and Webinars
FAQs for p62/SQSTM1 Antibody - BSA Free
Showing
1
-
1 of
1 FAQ
Showing All
-
Q: This technical query is related to Cat. No.: NBP1-48320. Technical Concern: As per the technical data sheet, p62/ SQSTM1 band is seen at ~47 kDa. We expect the band to be seen at 62 KDa for the domain p62/ SQSTM1, however only a ~47kDa band is visible in our blot, is there any explanation for this observation?
A: Regarding your concern with the performance of our p62 antibody (NBP1-48320), it is expected to see multiple bands depending on what form of p62 is present in the testing sample. According to uniprot, p62 has two different isoforms at 47kDa and 38kDa, however due to the interaction of p62 with other proteins and some possible modifications, a 62kDa band is usually observed on the blot. There is an abundance of supporting literature suggesting this antibody is performing well. p62 is considered to be the marker for Autophagy and the protein undergoes massive post translational modifications which can explain size increase. There are 13 phosphorylation sites on this protein. Here is the uniprot link for p62 (Q13501 reference 30); (PubMed 15592455).
Loading...