Cytokine Multiplex Assay Kits allow researchers to simultaneously detect the levels of multiple cytokines in a single sample. This is particularly useful for identifying the wide array of changes that can be associated with different pathological conditions. For multianalyte cytokine detection, we offer membrane-based Proteome Profiler Cytokine Antibody Arrays, bead-based Luminex® Assays, and Simple Plex automated ELISAs. For our antibody arrays, we offer human, mouse, or rat XL Cytokine Antibody Arrays that detect 105, 111, or 79 analytes respectively, including interleukins, interferons, chemokines, and members of the tumor necrosis factor superfamily. Our standard Luminex Assays for human, mouse, rat, porcine, and non-human primate (NHP) may also be used to detect many of these same analytes. With a menu of more than 490 analytes to select from, multiplexing with our Luminex assays provides the ability to simultaneously assess up to 50 analytes using magnetic microparticles. Experience consistent biomarker detection and ultra-sensitive results in less than 90 minutes with Ella, our automated benchtop ELISA. Simple Plex offers an extensive selection of over 250 fully validated assays essential to complete your cytokine research. Whether you want a stocked panel, ready to ship in just 2 days, a custom panel with up to 8 assays specific to your research, or a single assay cartridge for up to 72 samples ran simultaneously, Simple Plex has the solution to your research needs.
Proteome Profiler Mouse Cytokine Array Kit, Panel A
R&D Systems | Catalog # ARY006

Key Product Details
Species
Product Summary for Proteome Profiler Mouse Cytokine Array Kit, Panel A
Kit Summary
A membrane-based antibody array for the parallel determination of the relative levels of selected mouse cytokines and chemokines. Validated for analyte detection in cell culture supernates, cell lysates, tissue lysates, serum, and plasma.
Key Benefits
- Detects 40 mouse cytokines, chemokines, and acute phase proteins simultaneously
- Requires no specialized equipment
- Compatible with LI-COR* and chemiluminescence detection
Principle of the Assay
The Proteome Profiler Mouse Cytokine Array Kit, Panel A is a membrane-based sandwich immunoassay. Samples are mixed with a cocktail of biotinylated detection antibodies (Step 1) and then incubated with the array membrane which is spotted in duplicate with capture antibodies to specific target proteins (Step 2). Captured proteins are visualized using chemiluminescent detection reagents (Step 3). The signal produced is proportional to the amount of analyte bound.
Why Use an Antibody Array to Detect Multiple Cytokines?
Determining the expression of multiple cytokines in a single sample can be expensive, time consuming and can require specialized equipment. Performing multiple immunoprecipitations and Western blots requires time, labor, and reagents. The use of a multiplex antibody array to detect multiple cytokines in a single sample can be cost-effective and also save time and sample.
- Rectangular 4-Well Multi-dish
- 4 Mouse Cytokine Array, Panel A nitrocellulose membranes spotted with 40 different antibodies to mouse cytokines, chemokines, and acute phase proteins
- Array Buffer 4
- Array Buffer 6
- Chemi Reagent 1
- Chemi Reagent 2
- Detection Antibody Cocktail, Mouse Cytokine Array, Panel A
- Streptavidin-HRP
- Transparency Overlay Template
- Wash Buffer Concentrate (25X)
For a complete list of the kit contents and necessary materials, please see the Materials Provided/Other Supplies Required sections of the product datasheet.
Stability and Storage
Store the unopened kit at 2 °C to 8 °C. Do not use past kit expiration date.
| Simultaneously detect the levels of these cytokines, chemokines, and acute phase proteins in a single sample. | ||
|---|---|---|
| CXCL13/BLC/BCA-1 | IL-5 | M-CSF |
| C5a | IL-6 | CCL2/JE/MCP-1 |
| G-CSF | IL-7 | CCL12/MCP-5 |
| GM-CSF | IL-10 | CXCL9/MIG |
| CCL1/I-309 | IL-12 p70 | CCL3/MIP-1 alpha |
| CCL11/Eotaxin | IL-13 | CCL4/MIP-1 beta |
| ICAM-1 | IL-16 | CXCL2/MIP-2 |
| IFN-gamma | IL-17 | CCL5/RANTES |
| IL-1 alpha/IL-1F1 | IL-23 | CXCL12/SDF-1 |
| IL-1 beta/IL-1F2 | IL-27 | CCL17/TARC |
| IL-1ra/IL-1F3 | CXCL10/IP-10 | TIMP-1 |
| IL-2 | CXCL11/I-TAC | TNF-alpha |
| IL-3 | CXCL1/KC | TREM-1 |
| IL-4 | ||
Assays for Analytes represented in the Mouse Cytokine Array Kit, Panel A
| Analyte | Quantikine® ELISA Kits | DuoSet® ELISA Development Systems |
|---|---|---|
| CXCL13/BLC/BCA-1 | MCX130 | DY470 |
| C5a | DY2150 | |
| G-CSF | MCS00 | DY414 |
| GM-CSF | MGM00 | DY415 |
| CCL1/I-309/TCA-3 | DY845 | |
| CCL11/Eotaxin | MME00 | DY420 |
| ICAM-1 | MIC100 | DY796 |
| IFN-gamma | MIF00 | DY485 |
| IL-1 alpha | MLA00 | DY400 |
| IL-1 beta | MLB00B | DY401 |
| IL-1ra | MRA00 | DY480 |
| IL-2 | M2000 | DY402 |
| IL-3 | M3000 | DY403 |
| IL-4 | M4000B | DY404 |
| IL-5 | M5000 | DY405 |
| IL-6 | M6000B | DY406 |
| IL-7 | M7000 | DY407 |
| IL-10 | M1000b | DY417 |
| IL-12 p70 | M1270 | DY419 |
| IL-13 | M1300CB | DY413 |
| IL-16 | ||
| IL-17 | M1700 | DY421 |
| IL-23 | M2300 | DY1887 |
| IL-27 | M2728 | |
| CXCL10/IP-10/CRG-2 | MCX100 | DY466 |
| CXCL11/I-TAC | DY572 | |
| CXCL1/KC | MKC00B | DY453 |
| M-CSF | MMC00 | DY416 |
| CCL2/MCP-1/JE | MJE00 | DY479 |
| CCL12/MCP-5 | MCC120 | DY428 |
| CXCL9/MIG | MCX900 | DY492 |
| CCL3/MIP-1 alpha | MMA00 | DY450 |
| CCL4/MIP-1 beta | MMB00 | DY451 |
| CXCL2/MIP-2 | MM200 | DY452 |
| CCL5/RANTES | MMR00 | DY478 |
| CXCL12/SDF-1 | MCX120 | DY460 |
| CCL17/TARC | DY529 | |
| TIMP-1 | MTM100 | DY980 |
| TNF-alpha | MTA00 | DY410 |
| TREM-1 | MTRM10 | DY1187 |
Scientific Data Images for Proteome Profiler Mouse Cytokine Array Kit, Panel A
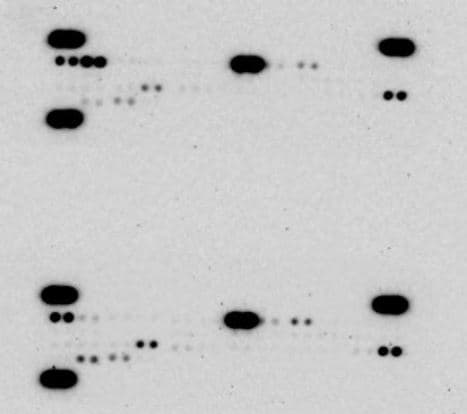
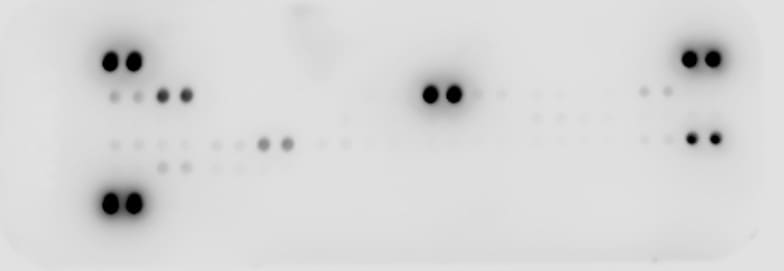
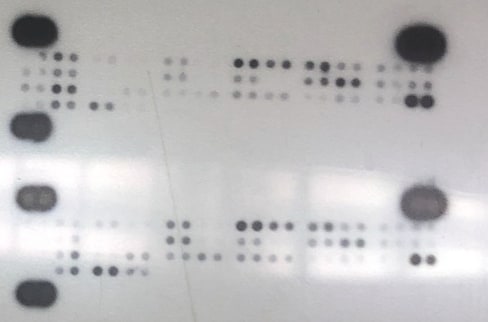
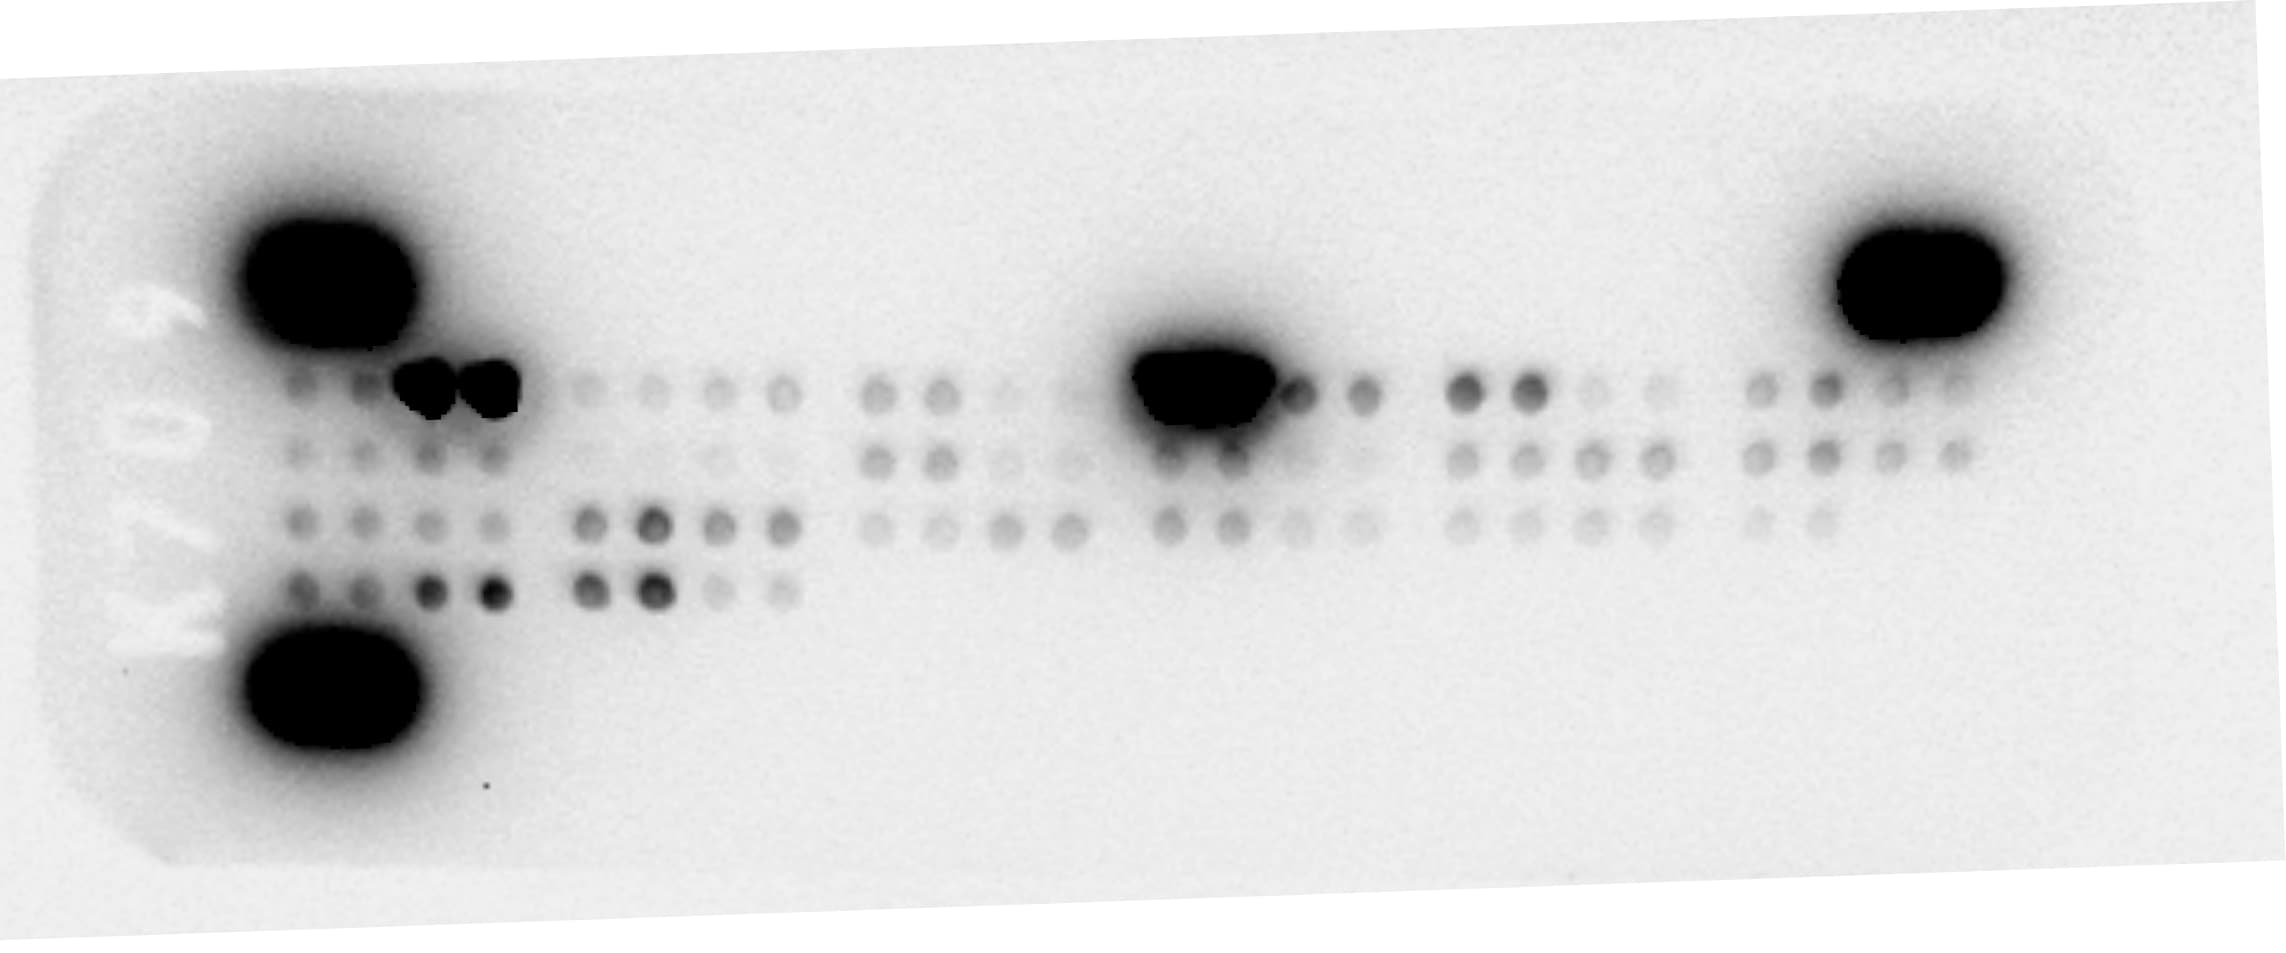
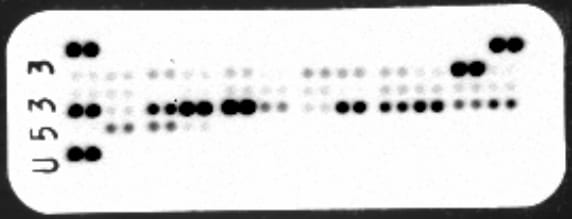
The Mouse Cytokine Array, Panel A utilizes capture antibodies spotted onto a nitrocellulose membrane to allow high-throughput multi-analyte profiling of 40 cytokines, chemokines, and more in a single sample.
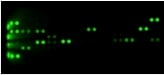
Mouse splenocytes treated with 100 ng/mL LPS for 20 hours were mixed with a cocktail of biotinylated detection antibodies, and then incubated with the Mouse Cytokine Array. The array was then incubated with streptavidin-horseradish peroxidase followed by chemiluminescent detection. After detection, the array data were quantitated to generate a protein profile (histogram). The table shows the analytes detected and their location on the membrane.
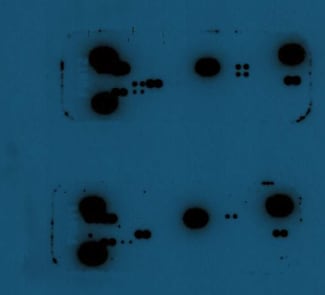
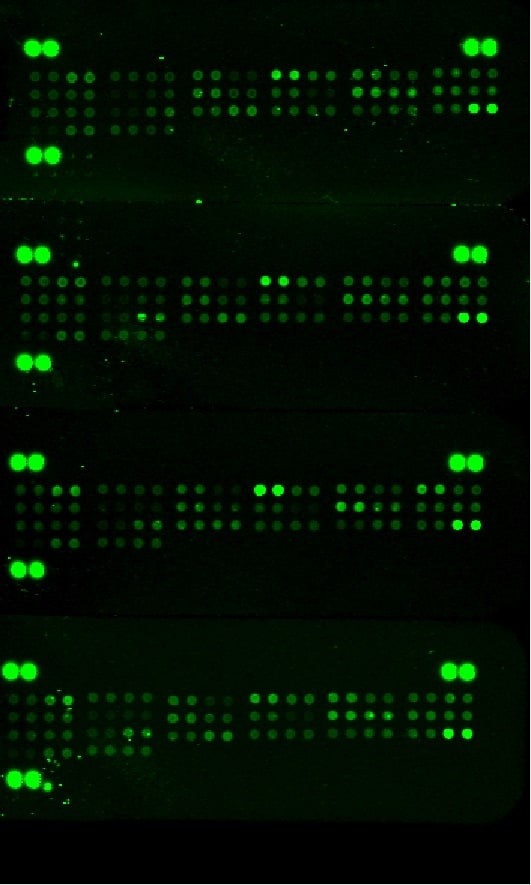
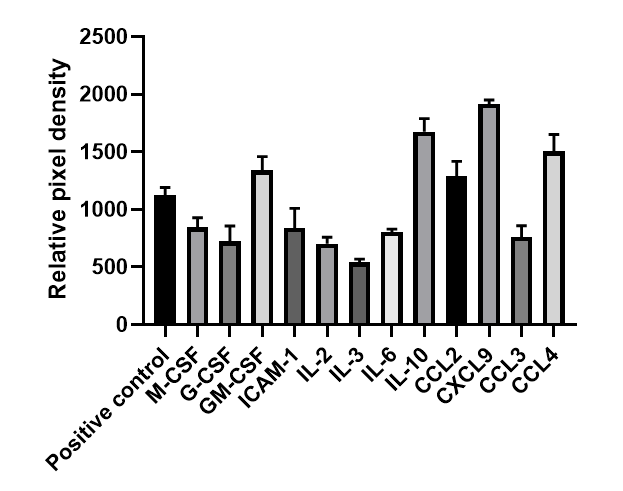
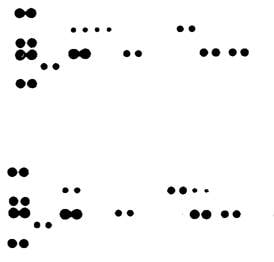
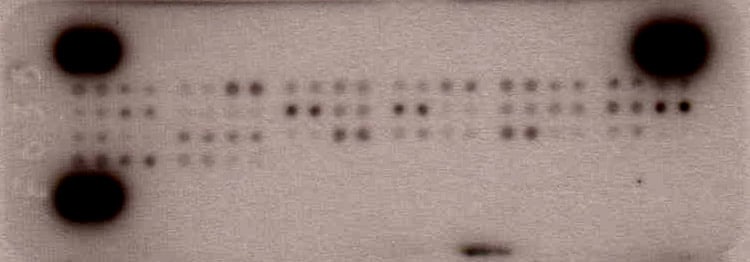
The Mouse Cytokine Array detects multiple analytes in cell culture lysates and supernates.
(A. and B.) Lysates of RAW264.7 mouse monocyte/macrophage cell line untreated or treated with 100 ng/mL LPS for 24 hours. 100 µg of lysate was used for each array shown. (C. and D.) Supernates of RAW264.7 mouse monocyte/macrophage cell line untreated or treated with 100 ng/mL LPS for 24 hours. 100 µL of supernate was used for each array shown. Array images were collected and analyzed using the LI-COR Odyssey Infrared Imaging System.
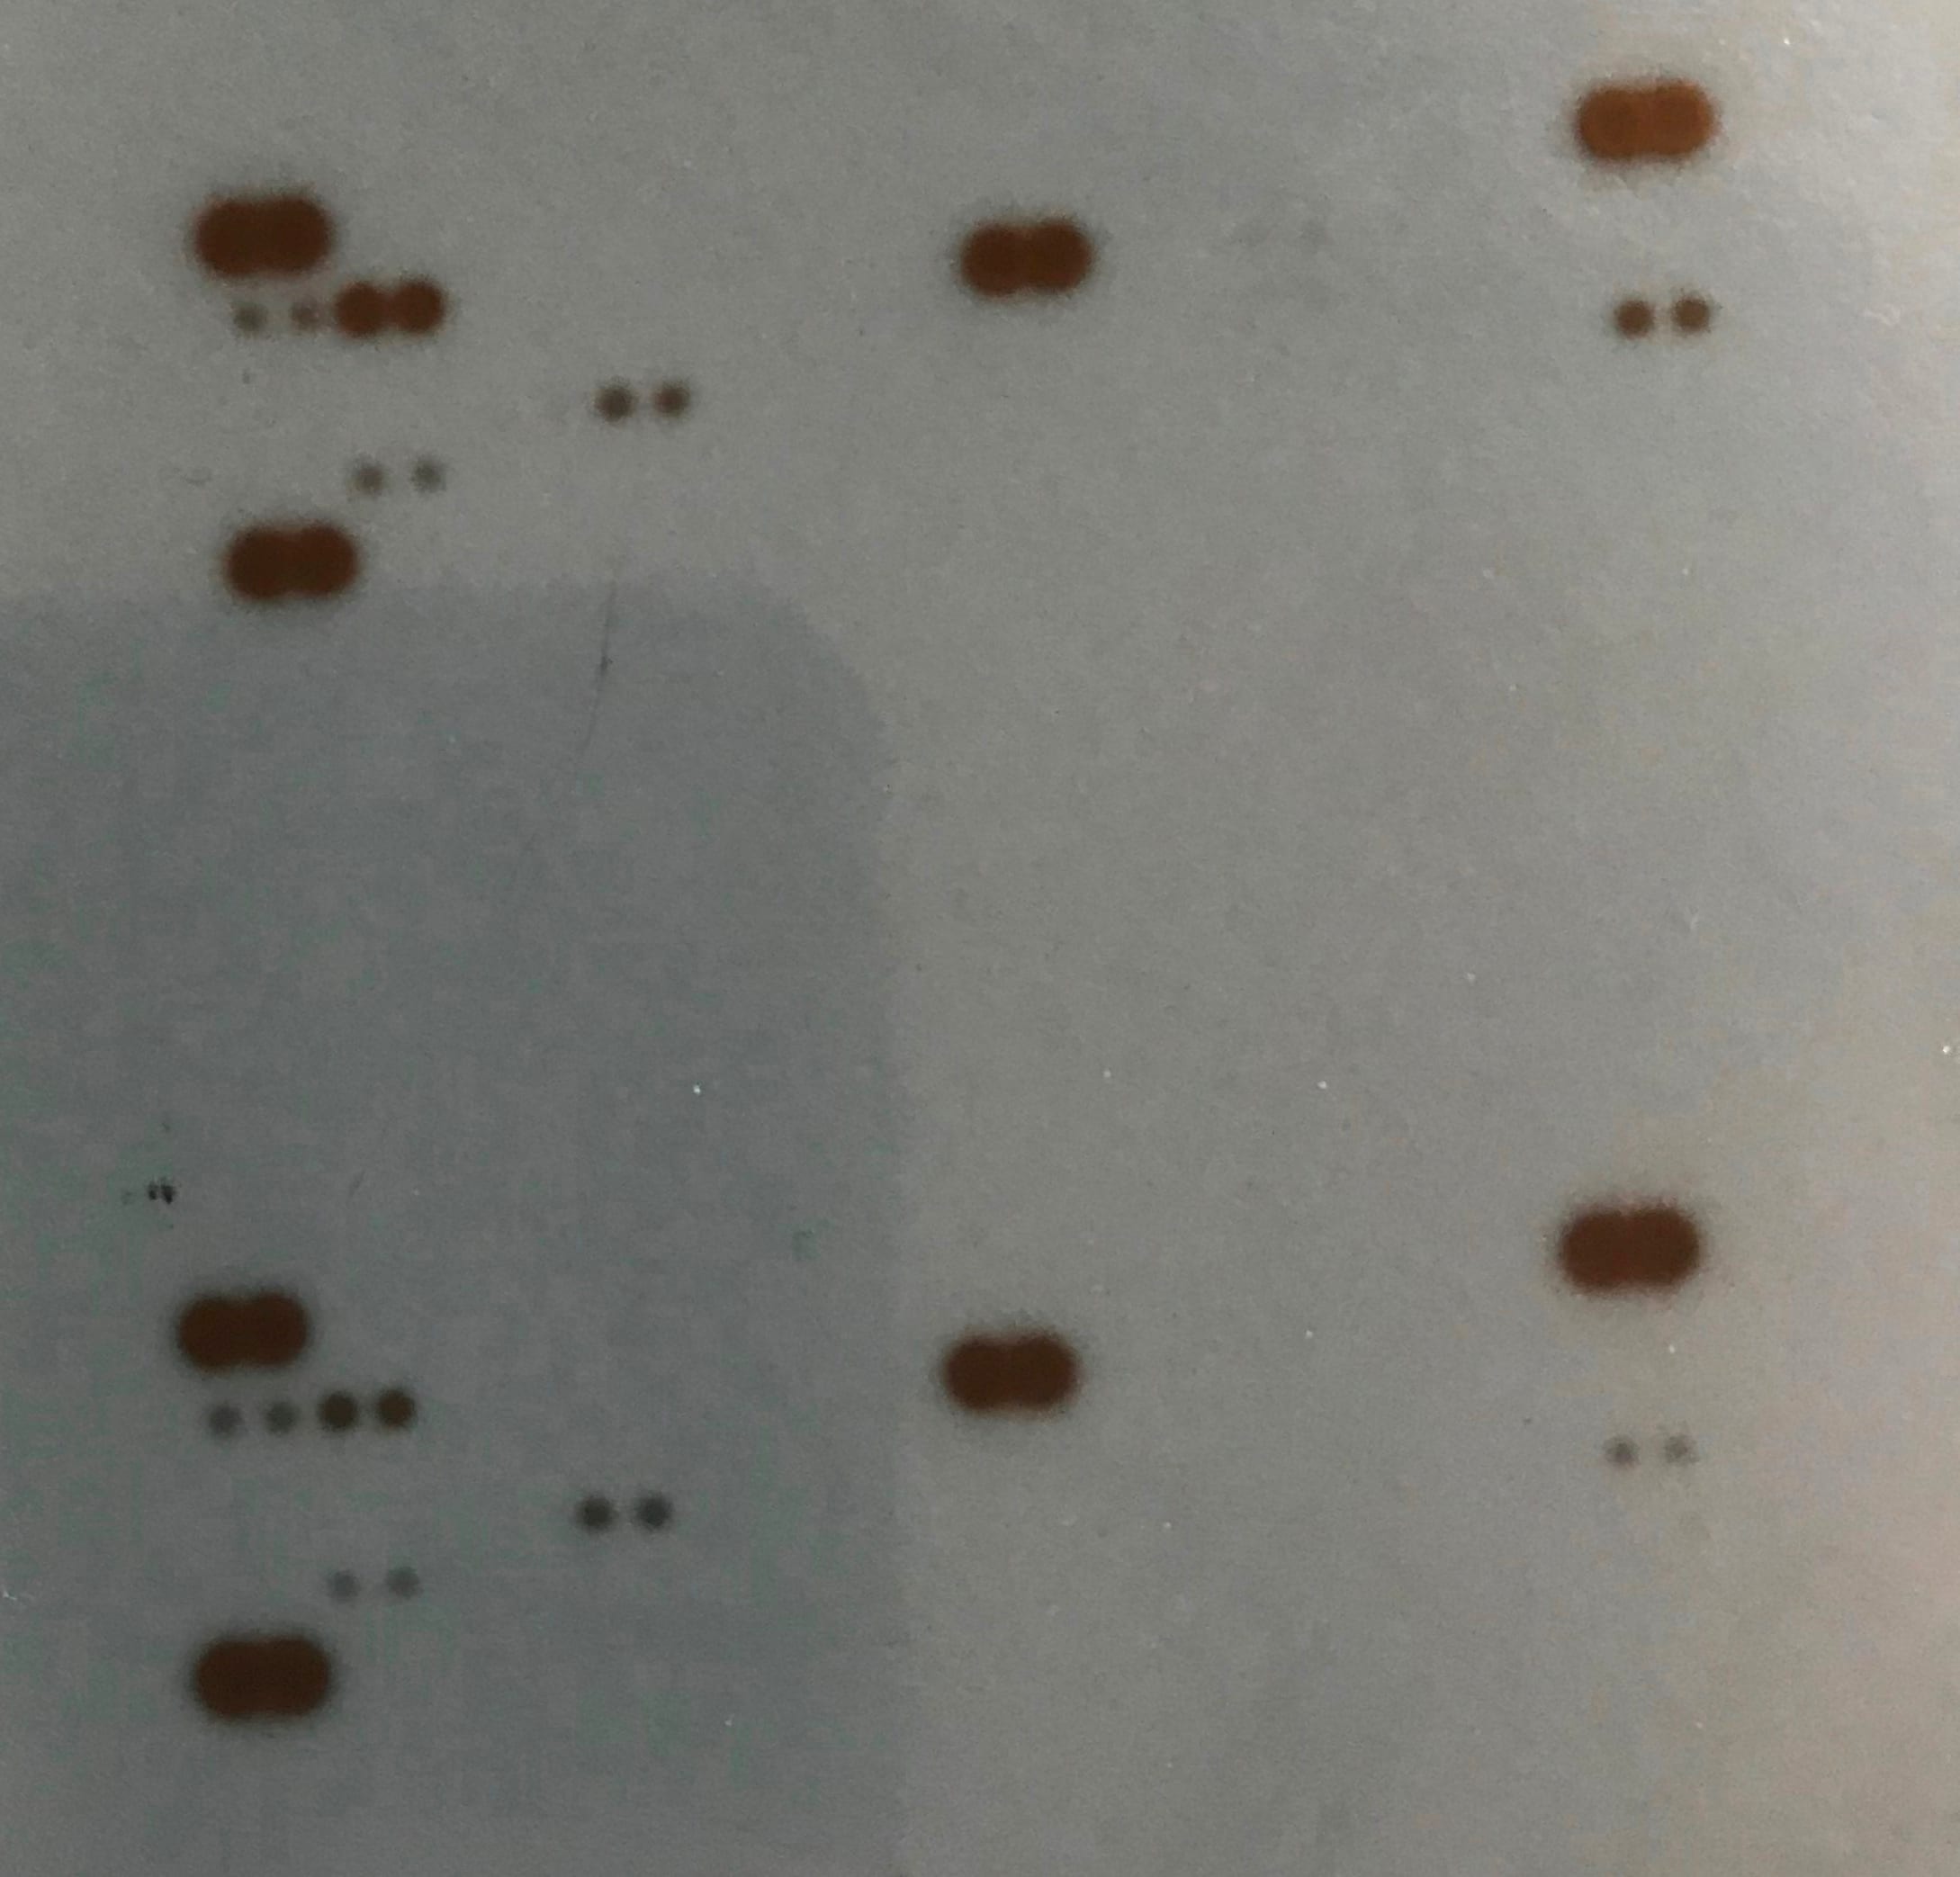
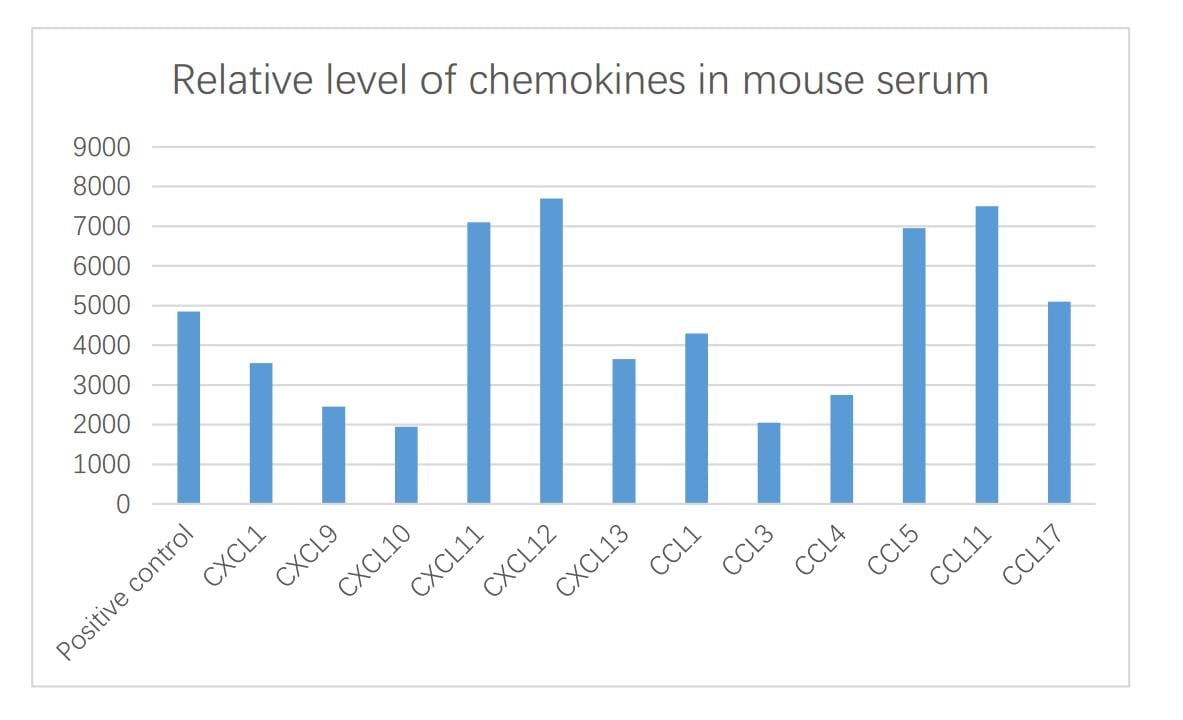
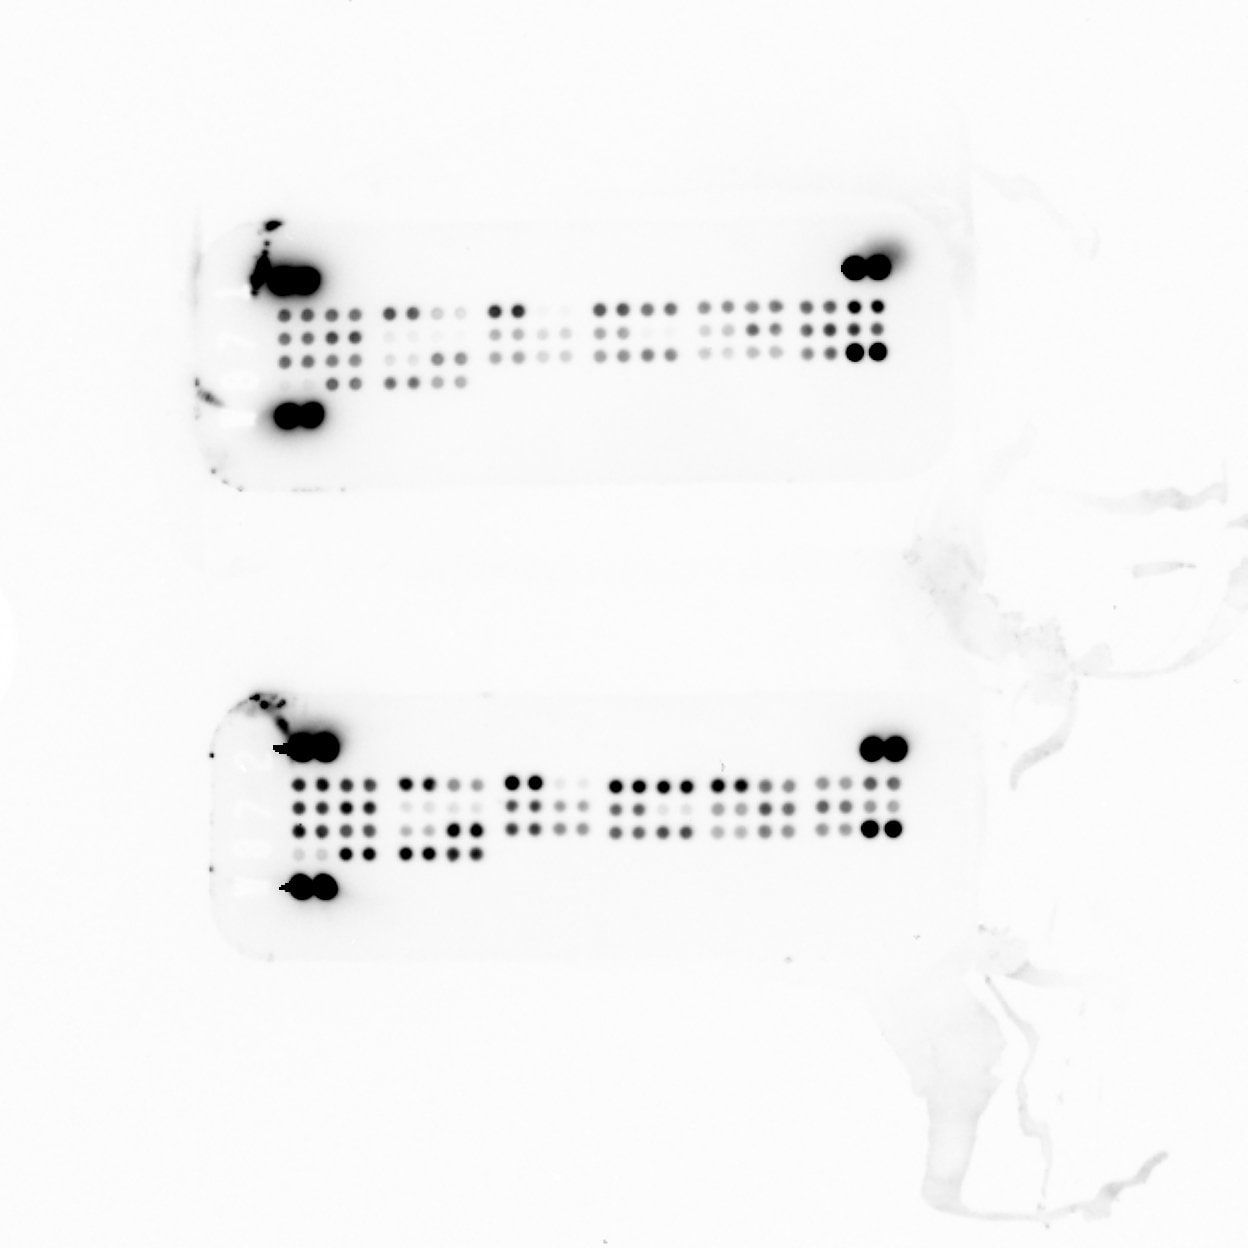
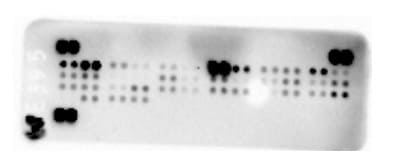
The Mouse Cytokine Array detects multiple analytes in mouse serum and tissue lysates.
(A and B.) Samples of mouse serum from two different vendors. 200 µL of serum was used for each array shown. (C. and D.) Lysates of mouse lung tissue and mouse stomach tissue. 200 µg of lysate was used for each array shown. Array images were collected and analyzed using the LI-COR Odyssey Infrared Imaging System.Formulation, Preparation, and Storage
Shipping
Storage
Background: Multiplex Cytokine Assay Kits
Additional Multiplex Cytokine Assay Kits Products
Product Documents for Proteome Profiler Mouse Cytokine Array Kit, Panel A
Certificate of Analysis
To download a Certificate of Analysis, please enter a lot or batch number in the search box below.
Note: Certificate of Analysis not available for kit components.
Product Specific Notices for Proteome Profiler Mouse Cytokine Array Kit, Panel A
For research use only
Citations for Proteome Profiler Mouse Cytokine Array Kit, Panel A
 Powered by Bioz
Customer Reviews for Proteome Profiler Mouse Cytokine Array Kit, Panel A (37)
Have you used Proteome Profiler Mouse Cytokine Array Kit, Panel A?
Submit a review and receive an Amazon gift card!
$25/€18/£15/$25CAN/¥2500 Yen for a review with an image
$10/€7/£6/$10CAN/¥1110 Yen for a review without an image
Submit a review
Customer Images

-
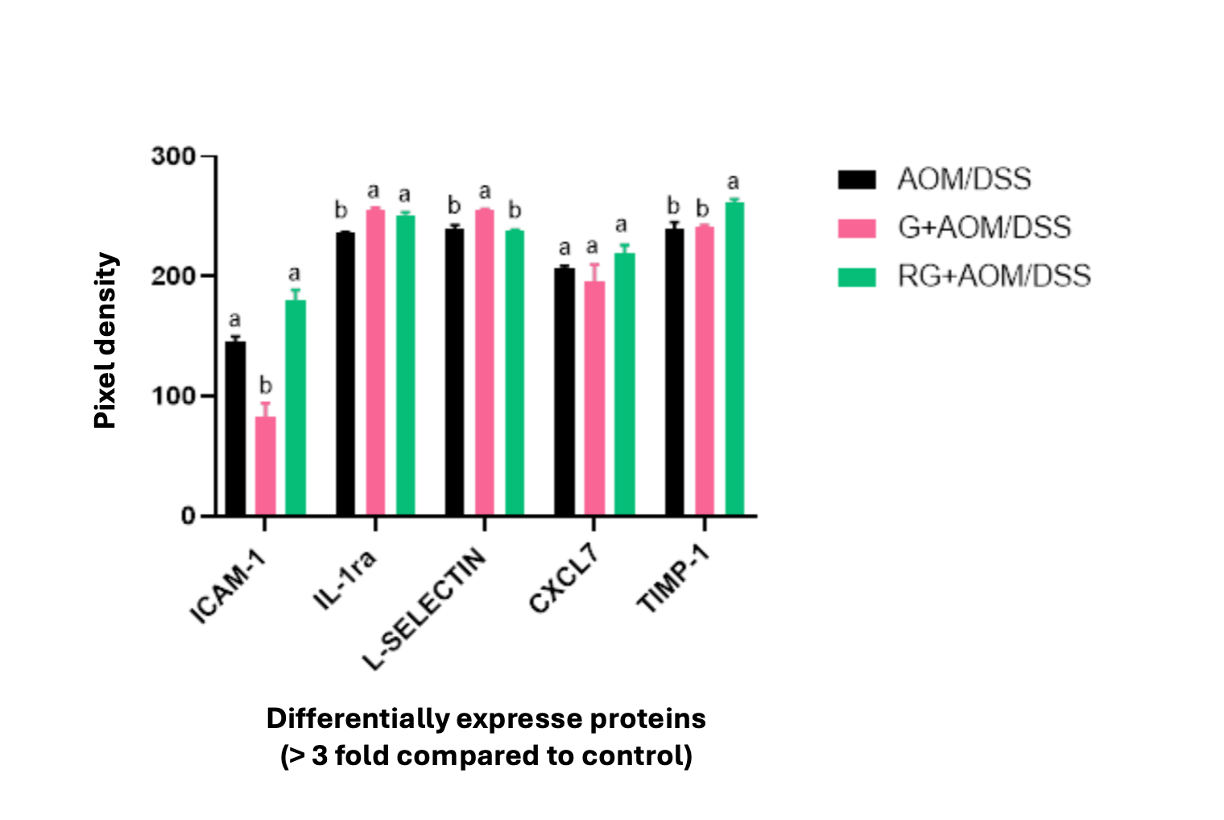
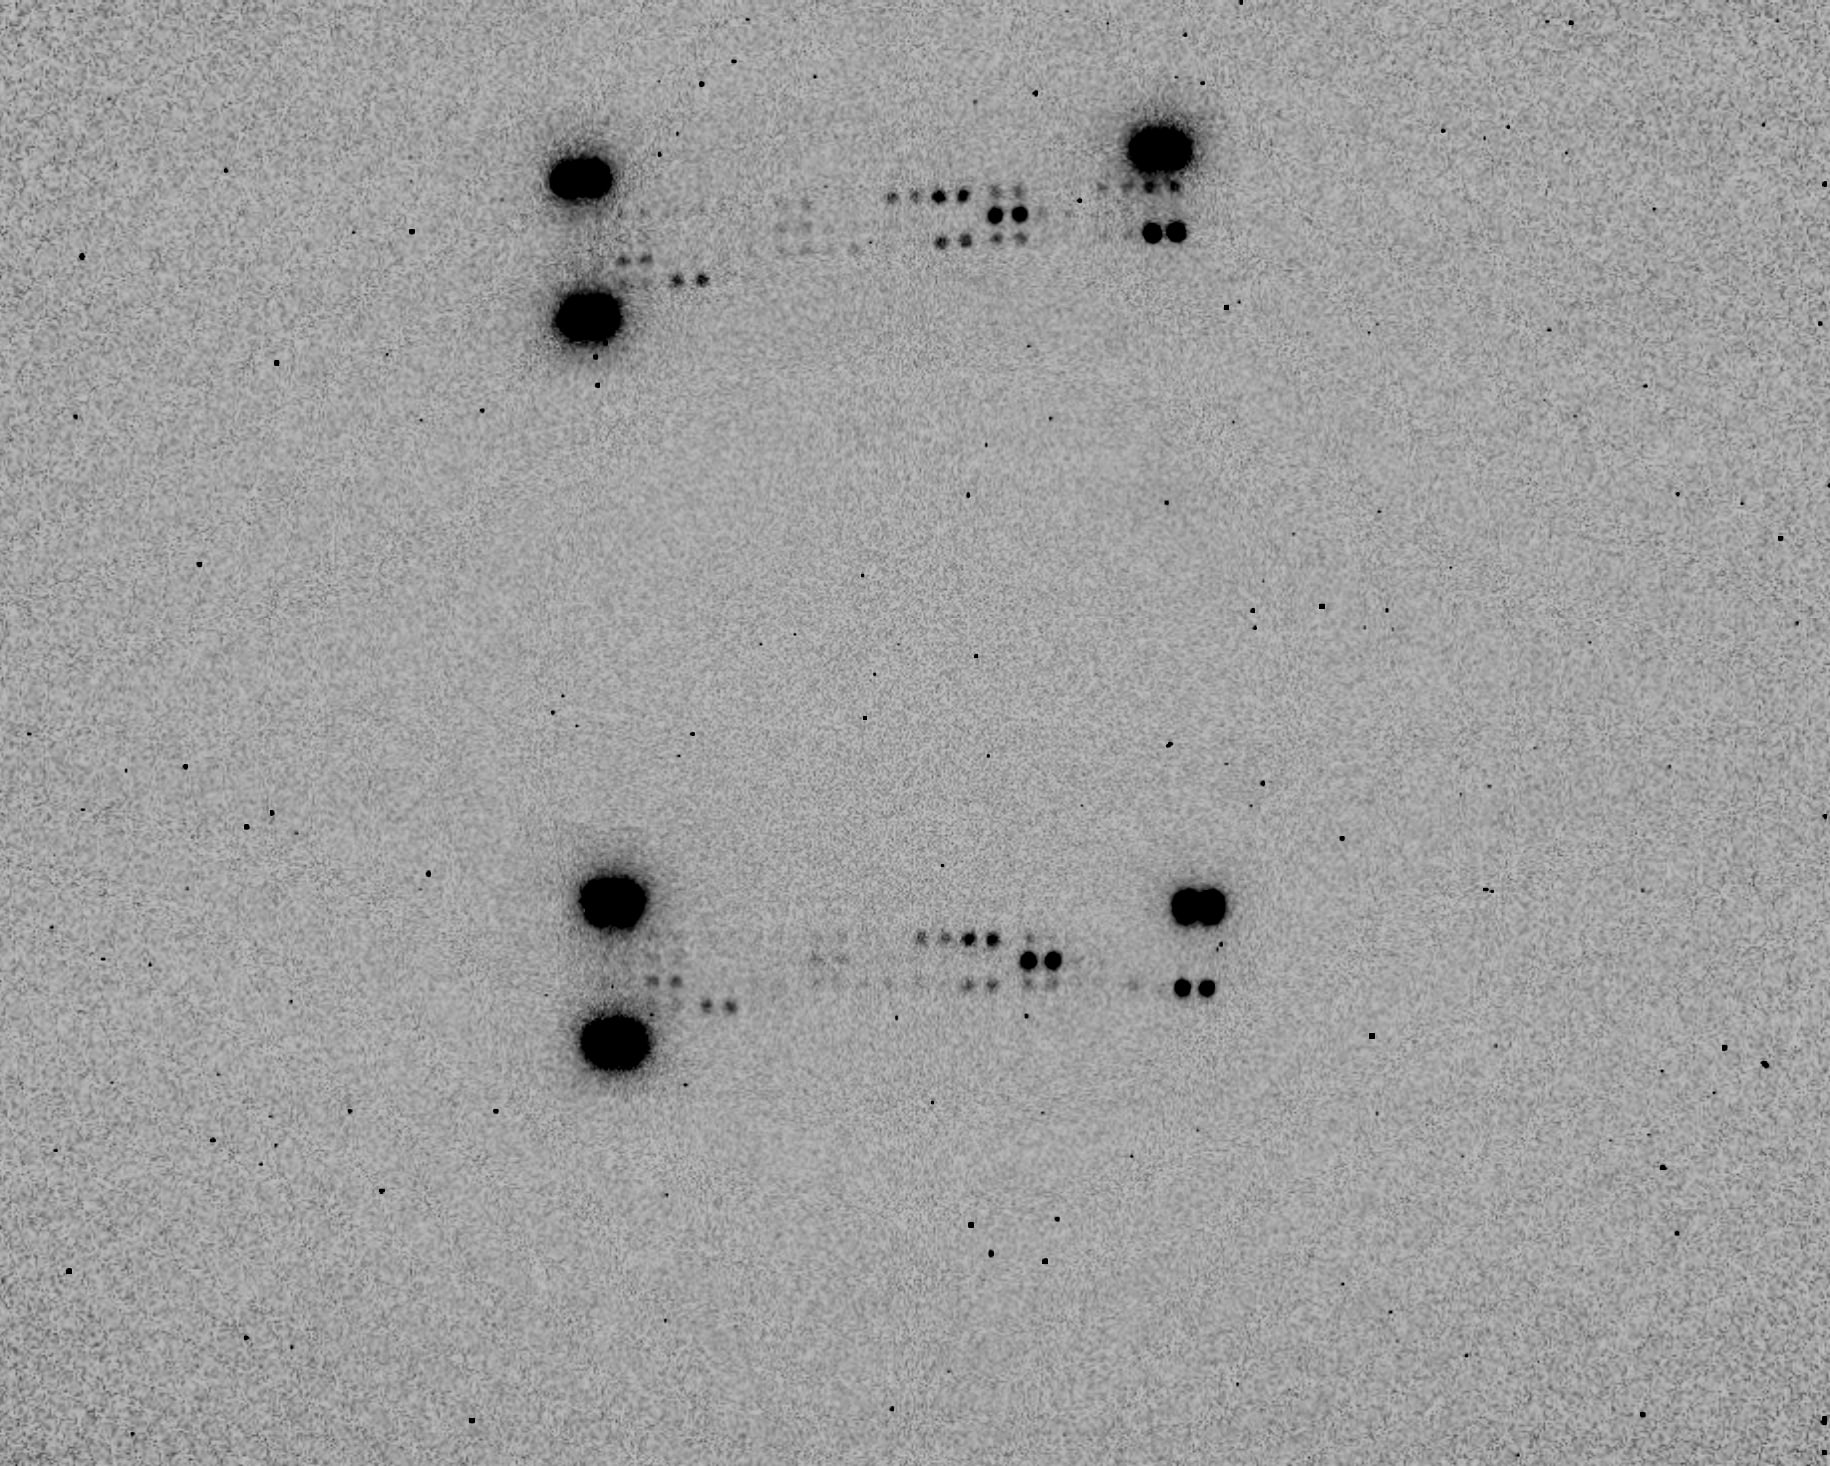
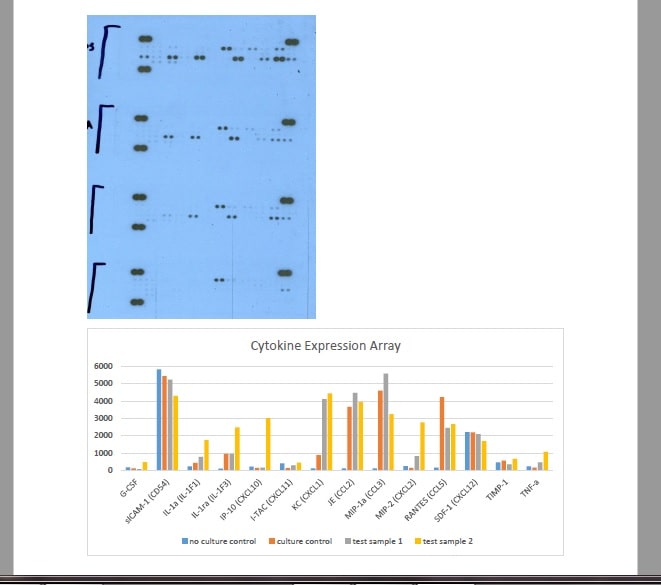
Verified Customer | Posted 12/28/2024Mice colonic tissues were subjected to protein extraction, and lysates were used to test the expression of different proteins in these tissues. In the picture, only those proteins exhibiting a differential expression >3.0 fold (compared to untreated animals) were presented. Animals were experimentally subjected to several treatments to induce colon cancer (AOM/DSS group) chemically, and two different groups consuming high-fiber samples (G+AOM/DSS and RG+AOM/DSS) were also tested. Results were very repeatable, considering the low SD values between the samples (different samples for each group), and the procedure was very easy to follow. We highly recommend using this protein array in mice colonic tissues.

-
Verified Customer | Posted 04/12/2024Performed well for mammary tumor lysates
-
Verified Customer | Posted 08/15/2023The kit works very well
-
Verified Customer | Posted 02/25/2023
-
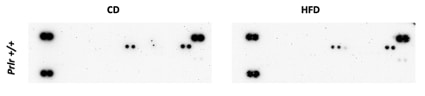
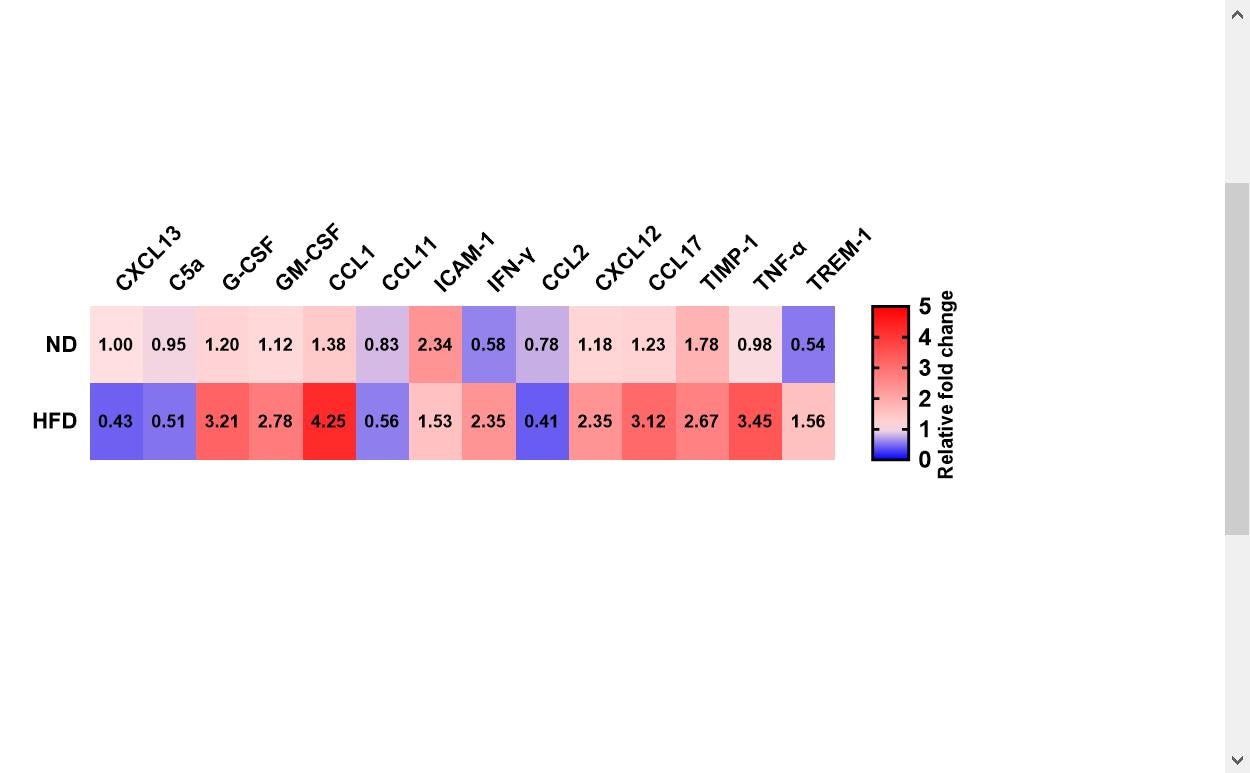
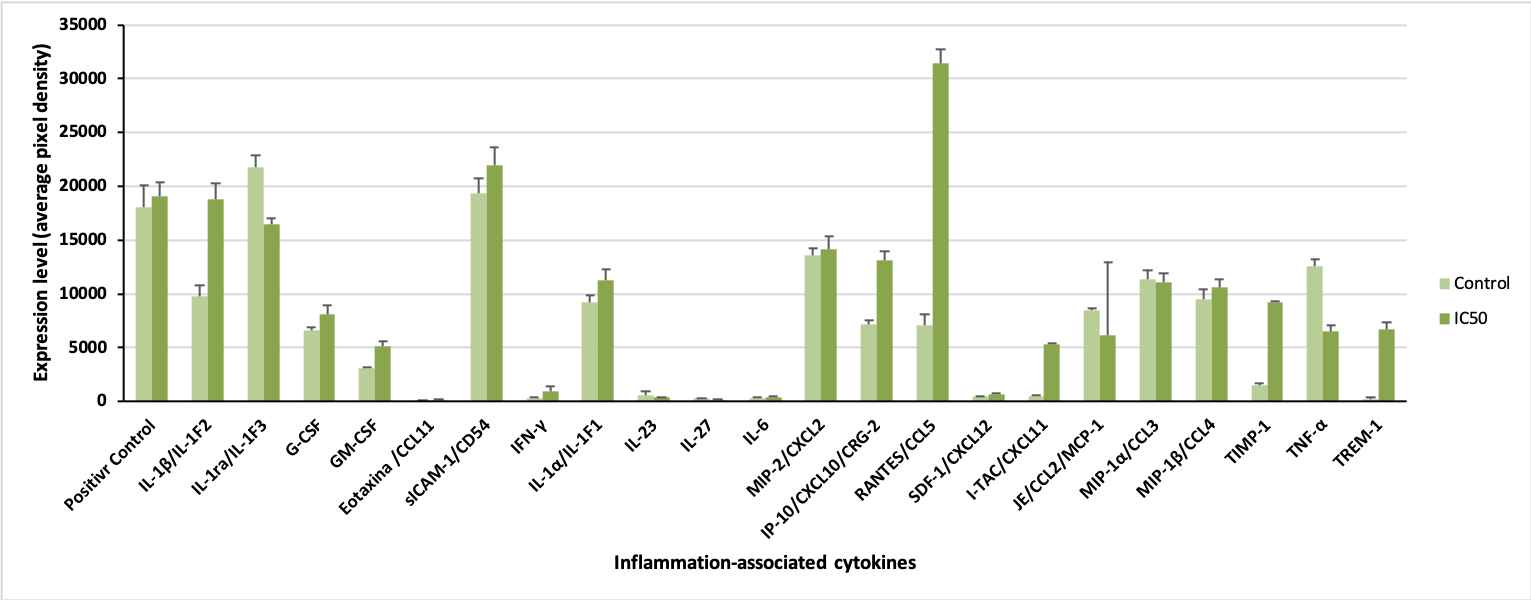
Verified Customer | Posted 10/11/2022Mouse Cytokine Antibody Array was used in serum from Prolactin Receptor wild type baby mice after the mother's high-fat diet feeding for 21 days of lactation, and results were compared with Control Diet (CD). A low-level pro-inflammatory mechanism could be confirmed due to the modulation of inflammation-associated cytokines.
-
Verified Customer | Posted 03/01/2022
-
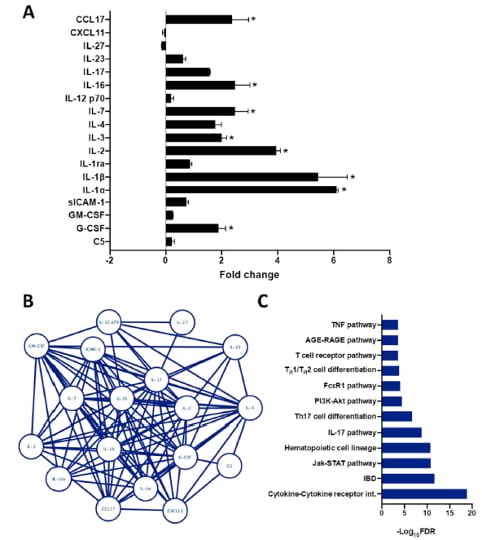
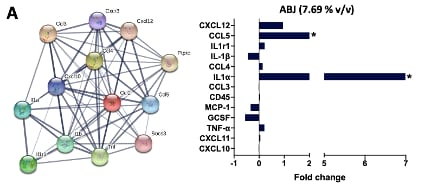
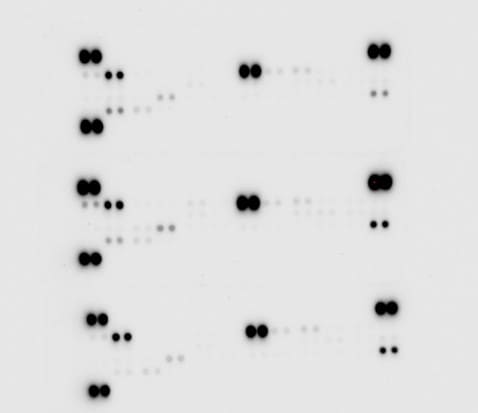
Verified Customer | Posted 10/01/2021The array was used to test the anti-inflammatory potential from Octopus vulgaris ink extracts on LPS-stimulated RAW 264.7 cells. Results obtained were in agreement with other biochemical and in vitro test. We have used this kit in several LPS-challenged murine macrophages. Fig. A shows the expression level of each cytokine against the control (LPS only-treated macrophages); B shows a bioinformatic arrangement of the modulated cytokines, and C shows a predictive analysis from the results obtained in this kit.
-
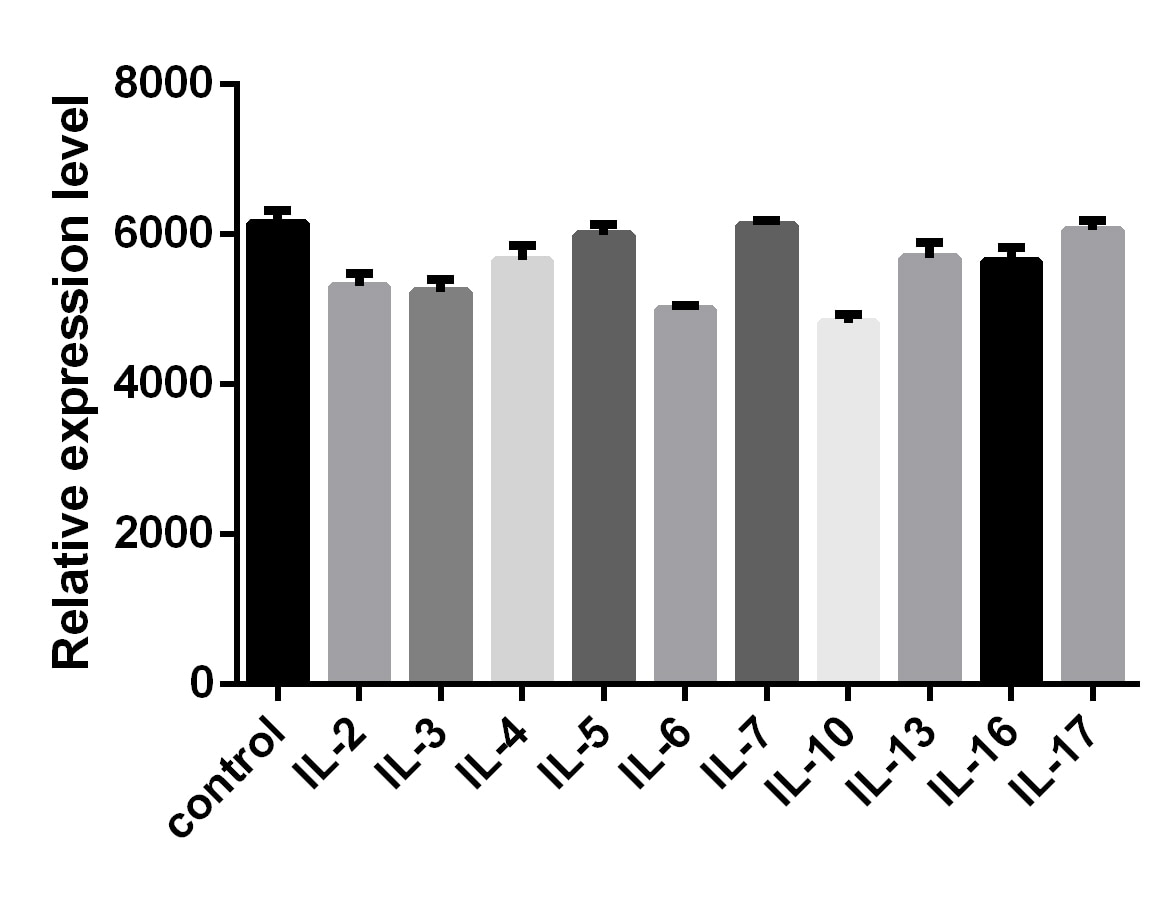
Verified Customer | Posted 09/23/2021Pro and anti-inflammatory cytokines were evaluated in RAW264.7 macrophages treated with LPS (1 microgram/mL) and a South American berry (ABJ). Results obtained showed the modulation of several cytokines indicated in this kit. We have conducted several evaluations of these cytokines using this kit and results never disappoint. What we like the most is that this assay allows the evaluation of several cytokines that would take a lot of time by conventional techniques such as ELISA or Western Blot.
-
Verified Customer | Posted 09/23/202120 ul serum was used to perform the experiment.
-
Verified Customer | Posted 08/31/2021
-
Verified Customer | Posted 08/25/2021mouse serum 200ul used for cancer model
-
Verified Customer | Posted 08/17/2021Used serum to see the role of gene in pavreatic cancer
-
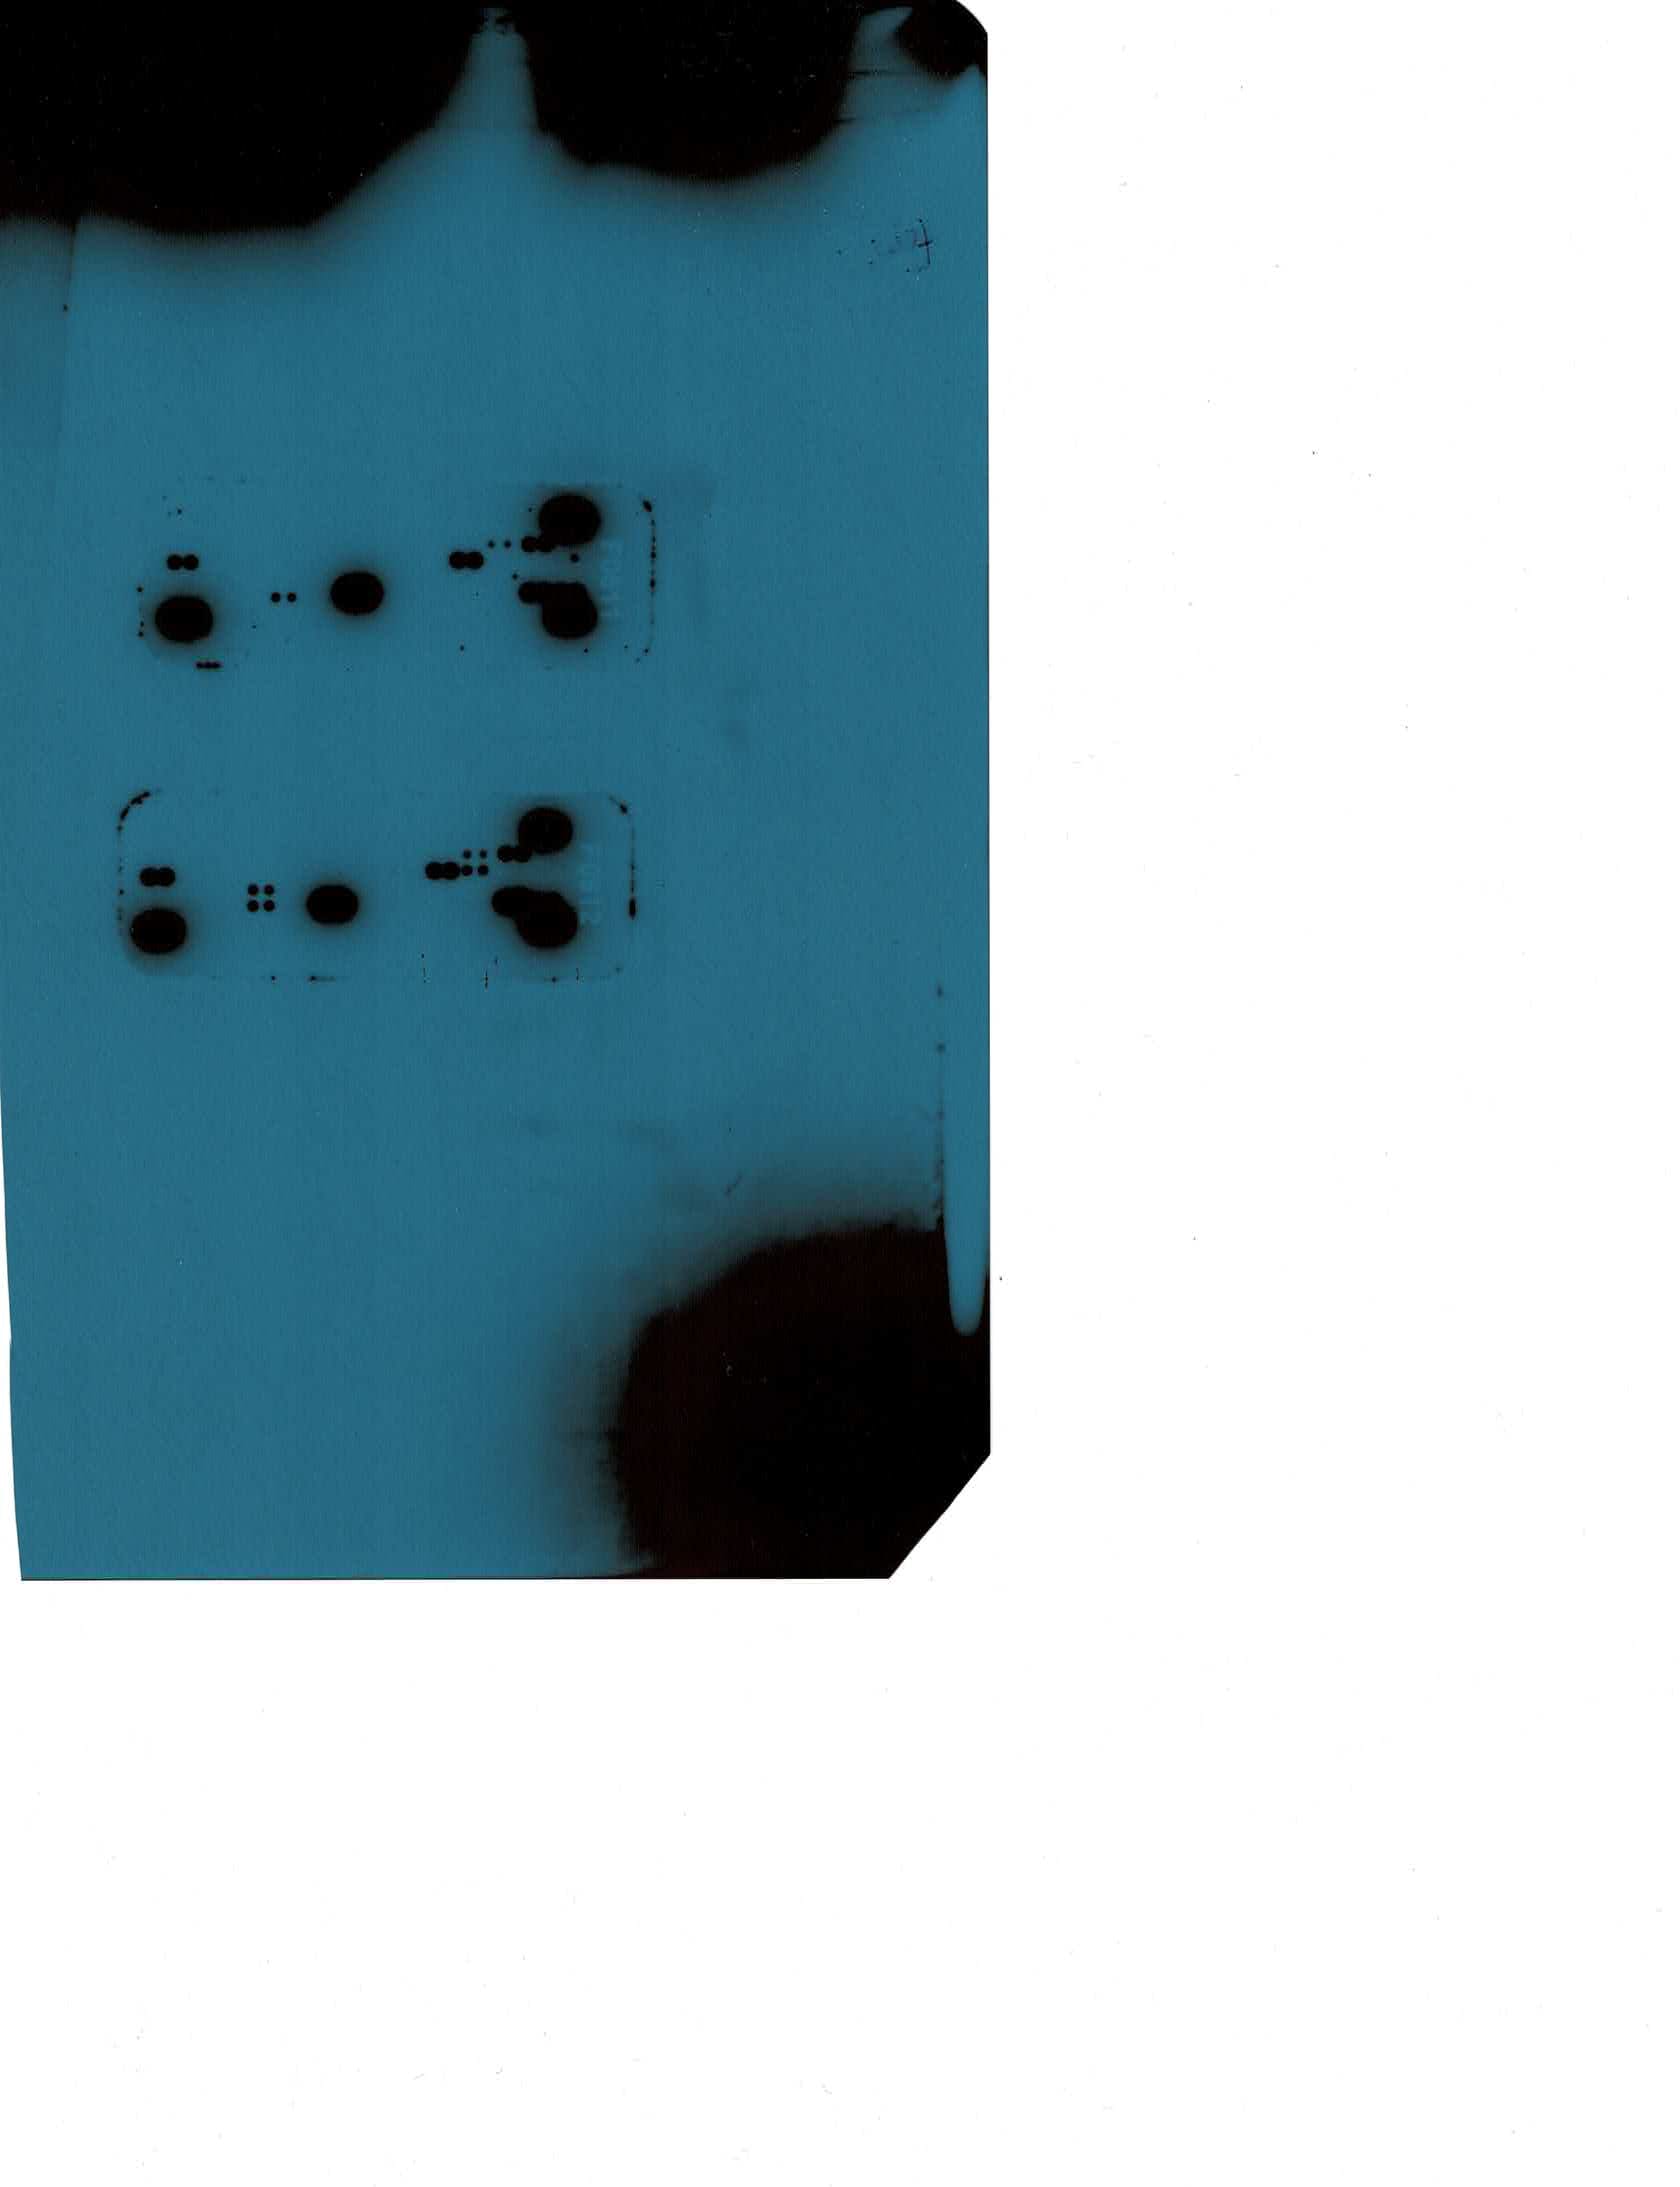
Verified Customer | Posted 05/10/2021Phenomenal results, consistent performance and excellent translation to use with Streptavidin-800. On step 11, I swapped the Streptavidin-HRP for a 1:2,000 ratio of Streptavidin-800. Then followed with the wash steps and the result is as posted.
-
Verified Customer | Posted 03/06/2021
-
Verified Customer | Posted 02/24/2020150UL SERUM WAS USED
-
Verified Customer | Posted 02/12/2020mouse tissues
-
Verified Customer | Posted 02/12/2020serum from knock-out mice
-
Verified Customer | Posted 02/08/2020
-
Verified Customer | Posted 12/10/2019Followed protocol exactly, 10 min exposure on film wasn't great, boosted to 20 min exposure, still not good. 5 min on digital imager and positive control spots were saturated! Much more sensitive!
-
Verified Customer | Posted 06/06/2019T cells isolated and stimulated with various agonists.
-
Verified Customer | Posted 04/05/2019good!
-
Verified Customer | Posted 03/13/2019This array was used to measure the modulation of inflammation-associated cytokines in LPS-stimulated RAW264.7 macrophages treated with several doses of the non-digestible fraction from a corn/bean snack.
-
Verified Customer | Posted 02/07/2019
-
Verified Customer | Posted 12/26/2018
-
Verified Customer | Posted 12/11/2018
-
Verified Customer | Posted 11/11/2018High quality results with simple and straightforward protocol. No optimization needed.
-
Verified Customer | Posted 07/19/2018instructions easy to follow. I needed a little longer than the 10 minute exposure due to low protein concentrations from my very small tissues.
-
Verified Customer | Posted 04/26/2018
-
Verified Customer | Posted 10/20/2017
-
Verified Customer | Posted 09/27/2017Very sensitive cytokine assay!
-
Verified Customer | Posted 07/14/2017performed on cell conditoned media from mouse fibroblasts
-
Verified Customer | Posted 05/10/2017
-
Verified Customer | Posted 03/15/2017Assay tested in 200 ug of protein from pool of intestines of 10 dpf zebrafish larvae.
-
Verified Customer | Posted 02/27/2017Mouse BALF samples from pooled control and treatment groups in 2 separate arrays to determine the altered cytokine response.
-
Verified Customer | Posted 01/27/2017Bronchoalveolar lavage fluid from C57BL/6J mouse
-
Verified Customer | Posted 10/06/2016
-
Verified Customer | Posted 09/29/2016
There are no reviews that match your criteria.
FAQs for Proteome Profiler Mouse Cytokine Array Kit, Panel A
-
Q: Will the Array identification number stamped on the Array membrane interfere with detection if it is not cut-off before the membrane is blocked?
A: The dye used for printing the Array identification number on the membranes will fluoresce and interfere with the LI-COR detection. It is critical that the number is cut off before beginning the experiment.