
The p53 tumor suppressor protein is a multi-functional transcription factor that regulates cellular decisions regarding proliferation, cell cycle checkpoints, and apoptosis. The importance of p53 is underscored by its mutation in over 50% of human cancers. Mice that lack one or both copies of p53 also showed an increased incidence of tumors, which makes the p53 deficient mouse a model system for studying cancer generation and progression.


Scientific images may be resized, cropped, or adjusted for brightness or contrast for presentation purposes. These updates are limited to presentation and do not affect the underlying scientific interpretation of the data. Where available, additional source data may be provided upon request.
Key Product Details
Validated by
Biological Validation
Species Reactivity
Validated:
Human, Mouse, Rat
Cited:
Human, Mouse, Bacteria - Escherichia coli, Xenograft
Applications
Validated:
Western Blot, Immunocytochemistry, Immunoprecipitation
Cited:
Immunohistochemistry, Western Blot, Simple Western, Ubiquitination
Label
Unconjugated
Antibody Source
Monoclonal Mouse IgG2B Clone # 184721
Loading...
Product Specifications
Immunogen
E. coli-derived recombinant human p53
Asp7-Asp393
Accession # P04637
Asp7-Asp393
Accession # P04637
Specificity
Detects human, mouse, and rat p53.
Clonality
Monoclonal
Host
Mouse
Isotype
IgG2B
Scientific Data Images for p53 Antibody (184721)
Detection of Human p53 by Western Blot.
Western blot shows lysates of MCF-7 human breast cancer cell line mock-treated (-) or treated (+) with 1 µM camptothecin (CPT) for 1 hour. Human p53 was immunoprecipitated using Mouse Anti-Human/Mouse/Rat p53 Monoclonal Antibody (Catalog # MAB1355). PVDF membrane was probed with HRP-conjugated Anti-Human/Mouse/Rat Polyclonal Antibody (Catalog # HAF1355). A specific band for p53 was detected at approximately 53 kDa (as indicated). This experiment was conducted under reducing conditions and using Immunoblot Buffer Group 1.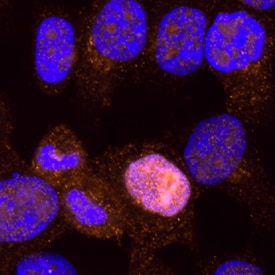
p53 in HeLa Human Cell Line.
p53 was detected in immersion fixed HeLa human cervical epithelial carcinoma cell line using Mouse Anti-Human/Mouse/Rat p53 Monoclonal Antibody (Catalog # MAB1355) at 3 µg/mL for 3 hours at room temperature. Cells were stained using the NorthernLights™ 557-conjugated Anti-Mouse IgG Secondary Antibody (red; Catalog # NL007) and counterstained with DAPI (blue). Specific staining was localized to cytoplasm and nuclei. View our protocol for Fluorescent ICC Staining of Cells on Coverslips.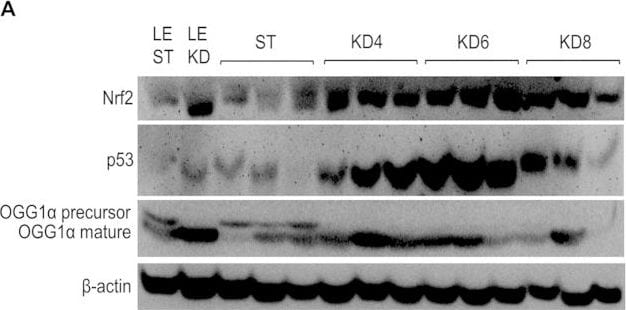
Detection of Rat p53 by Western Blot
Immunoblot analysis of kidney lysates.(A) Blot membranes were incubated with the antibodies against Nrf2, p53 and 8-oxoguanine glycosylase alpha (OGG1 alpha ). The mean integrated optical density is related to actin for Nrf2 (B), p53 (C) and mature 8-oxoguanine glycosylase alpha (D) levels. Results are given as a mean ± S.E.M. KD4, KD6, KD8 – groups of Eker rats (Tsc2+/−) treated with HFKD for four, six or eight mo., respectively; ST – Eker rats fed with a standard diet; LE ST – wild-type Long Evans rats treated with a standard diet; LE KD – wild-type Long Evans rats treated with a ketogenic diet similarly to the KD6 group. *P < 0.05, **p < 0.01, ***p < 0.001 as compared to ST unless otherwise stated (horizontal line) for ANOVA with a Fisher post hoc test. Image collected and cropped by CiteAb from the following publication (https://pubmed.ncbi.nlm.nih.gov/26892894), licensed under a CC-BY license. Not internally tested by R&D Systems.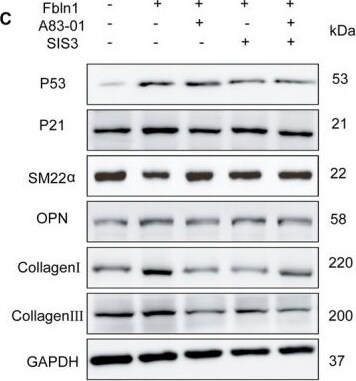
Detection of p53 by Western Blot
Inhibition of the TGF‐ beta /smad3 signaling pathway relieves the facilitating effect of Fbln1 on VSMCs. After treatment with recombinant Fibulin‐1 protein, the TGF‐ beta /Smad3 signaling pathway in VSMCs was blocked by adding the TGF‐ beta receptor inhibitor A83‐01 and the Smad3 phosphorylation inhibitor SIS3. A–B: Detection of VSMC senescence by senescence‐associated beta ‐galactosidase (SA‐ beta ‐gal) staining. C–I: Western Blot was used to detect the expression levels of p53, p21, SM22 alpha, OPN, collagenI and collagenIII. n ≥ 5, *p < 0.05, **p < 0.01, ***p < 0.001. Image collected and cropped by CiteAb from the following open publication (https://pubmed.ncbi.nlm.nih.gov/41816936), licensed under a CC-BY license. Not internally tested by R&D Systems.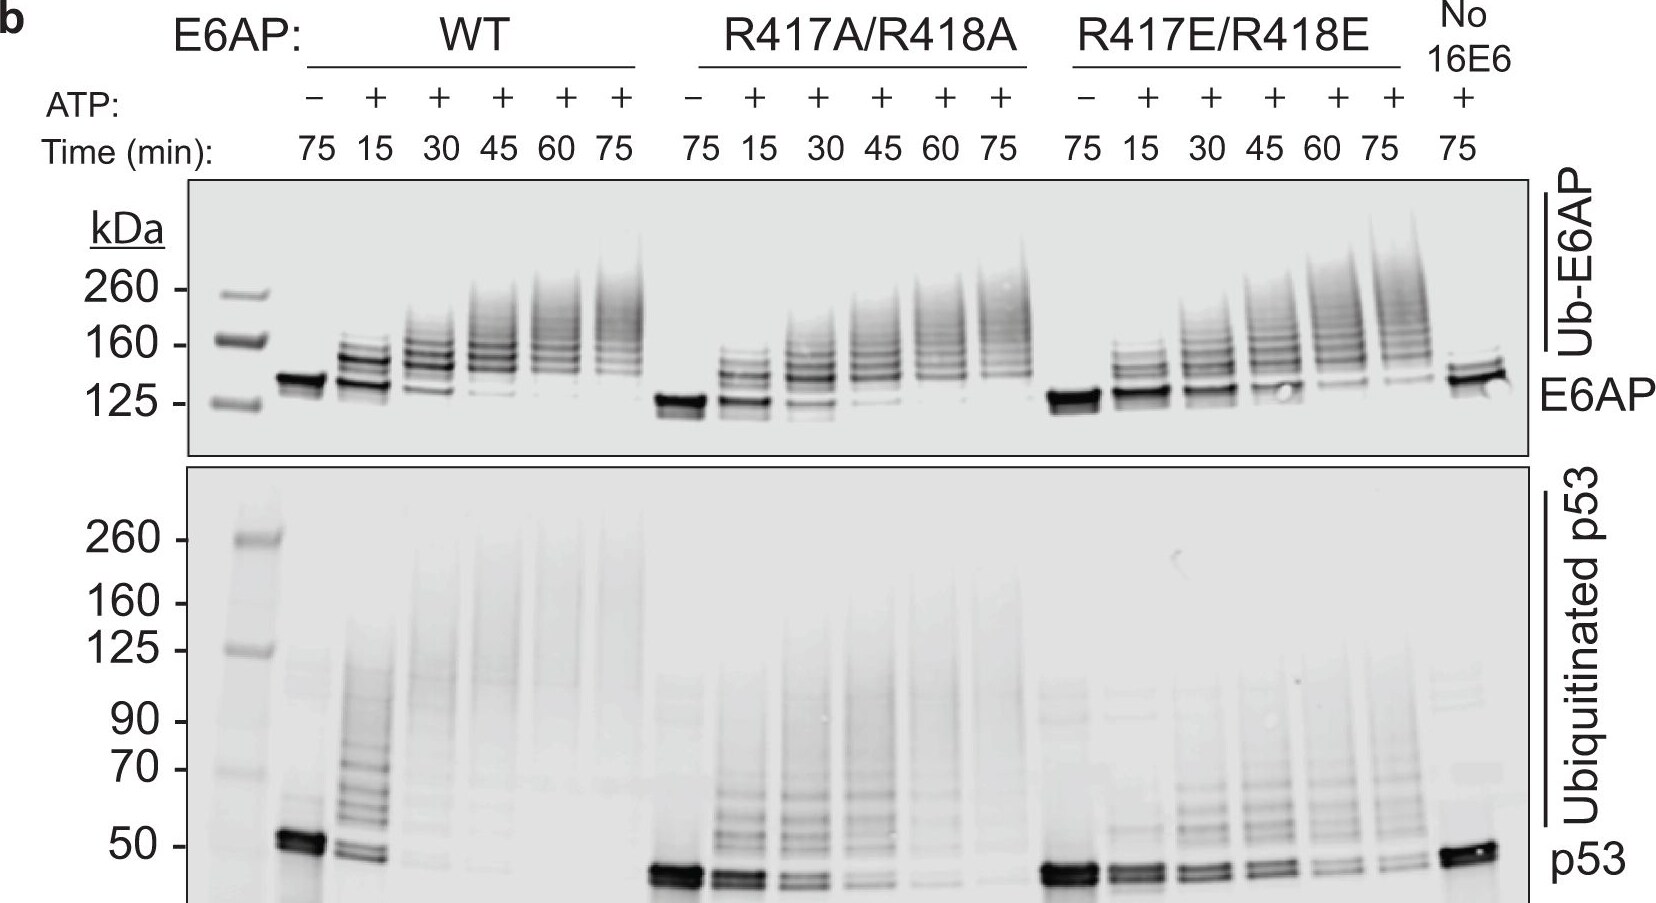
Detection of p53 by Western Blot
Molecular dynamics simulations identified E6AP R417/R418 as a putative p53 binding residues.a Structure of the cryoEM ternary complex formed between 16E6 (tan), E6AP (blue), and p53core (purple), with (i) a zoomed-in insert highlighting interactions between E6AP R417 and p53core D148 and R110. (ii-iv) Dynamic and interchangeable interactions between E6AP residues R417 and R418 and p53, as revealed by MD simulations, coordinate the direct interface between E6AP and p53. Hydrogen bonding and ionic interactions are highlighted (black, dashed lines). b Results of ubiquitination assays where MPB-16E6(4C4S), WT or double mutant E6AP, and full-length p53 were incubated in the presence or absence of ATP, resolved by SDS-PAGE, and visualized by western blot for E6AP (upper blot) or p53 (lower blot). Quantification of (b) for unmodified (c) p53 and (d) E6AP. In each (c) and (d) WT E6AP (black, open circles), R417A/R418A (black, open triangles), and R417E/R418E (black, open squares). Values represent the mean ± SEM of three independent experiments. P * = 0.0002 for unmodified p53 levels at 75 min. between R417E/R418E and WT E6AP by one-way ANOVA. Image collected and cropped by CiteAb from the following open publication (https://pubmed.ncbi.nlm.nih.gov/38418456), licensed under a CC-BY license. Not internally tested by R&D Systems.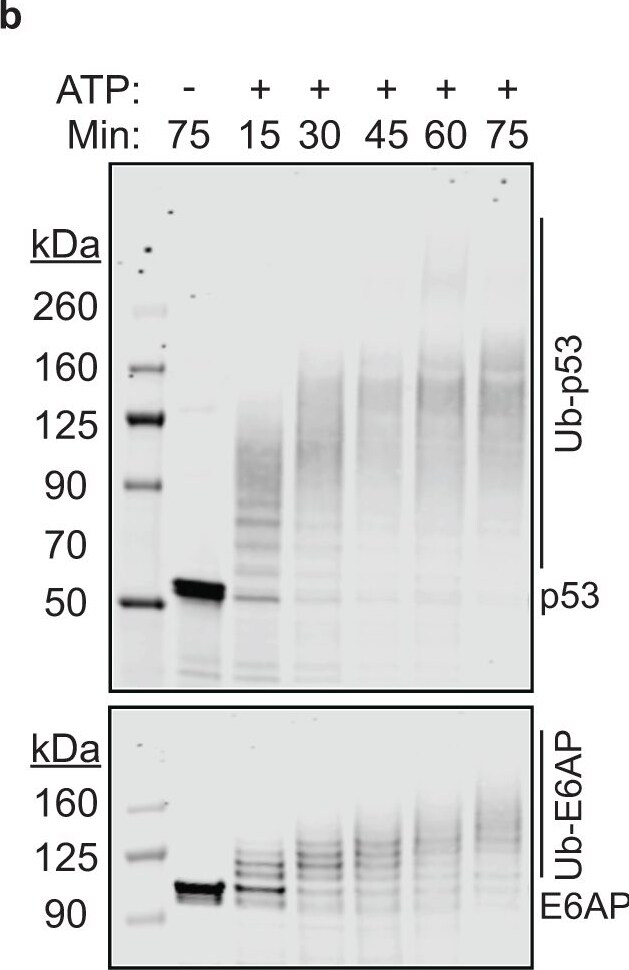
Detection of p53 by Western Blot
Rationally designed MBP-16E6 mutations disrupt its binding to E6AP.a Surface plasmon resonance (SPR) measurements of increasing concentrations of mutant MBP-16E6 binding to biotinylated E6AP. Mutations were rationally designed to disrupt the 16E6 and E6AP interaction, reducing the picomolar interaction observed in wild-type protein. The Figure shows measured binding responses (black) and curve fits to a 1:1 interaction model (red). Plots are representative from at least three independent experiments with similar results. RU, response units; KD, dissociation constant; ka, association rate; kd, dissociation rate. b p53 ubiquitination assays wherein recombinant MBP-16E6, E6AP, and p53 were incubated in the presence or absence of ATP over the indicated time, then resolved by SDS-PAGE and visualized for p53 (top panel) or E6AP (bottom panel) by Western blot. c Assay was set up as in (b) except wild-type MBP-16E6 was substituted with mutant protein and the unmodified p53 (left panels) or unmodified E6AP (right panels) were isolated. Reduced signal represents modification of p53 or E6AP by ubiquitination. Full blots with molecular weight markers can be found in Supplementary Fig. 20. d Quantification of unmodified p53 or (e) unmodified E6AP from experiments in (c). Values represent the mean ± SEM of three independent experiments for all mutant MBP-16E6 (4C4S) proteins, and six independent experiments for WT MBP-16E6 (4C4S) protein. Image collected and cropped by CiteAb from the following open publication (https://pubmed.ncbi.nlm.nih.gov/38418456), licensed under a CC-BY license. Not internally tested by R&D Systems.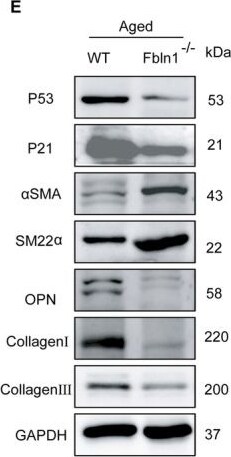
Detection of p53 by Western Blot
In vivo knockdown of Fbln1 improved vascular stiffness in nature aging mice. A: PWV measurements in aged mice. B–D: Effect of Fbln1 deficiency on systolic blood pressure (B), diastolic blood pressure (C) and mean arterial pressure (D) in normal WT and Fbln1−/− mice is shown. E–L: Western blot results showed that Fbln1 knockdown could modulate the expression of p53, p21, alpha SMA, SM22 alpha, OPN, collagenI and collagenIII induced by aging in mice. wild‐type mice: WT, Fbln1 knockout mice: Fbln1−/−. *Significant differences. n ≥ 5, *p < 0.05, **p < 0.01, ***p < 0.001. Image collected and cropped by CiteAb from the following open publication (https://pubmed.ncbi.nlm.nih.gov/41816936), licensed under a CC-BY license. Not internally tested by R&D Systems.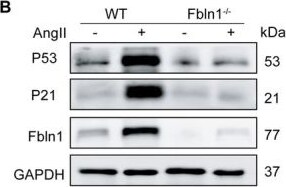
Detection of p53 by Western Blot
In vivo knockdown of Fbln1 attenuates AngII‐induced vascular stiffness in mice. A: PWV measurements in AngII‐treated and PBS control mice. B–E: Western blot results showed that Fbln1 knockdown could modulate the expression of P53, P21 in mice. F: Assessment of collagen deposition in vascular tissues by Masson's trichrome staining in WT and Fbln1−/− mice (scale = 50 μm). EVG of the vascular wall of the aortic in different groups (scale = 50 μm). The red arrows denote areas of morphological discontinuity in the elastic fibers. Transmission electron microscopy (TEM) of elastin in aortic wall (scale = 50 nm). wild‐type mice: WT, Fbln1 knockout mice: Fbln1−/−. *Significant differences. n ≥ 5, *p < 0.05, **p < 0.01, ***p < 0.001. Image collected and cropped by CiteAb from the following open publication (https://pubmed.ncbi.nlm.nih.gov/41816936), licensed under a CC-BY license. Not internally tested by R&D Systems.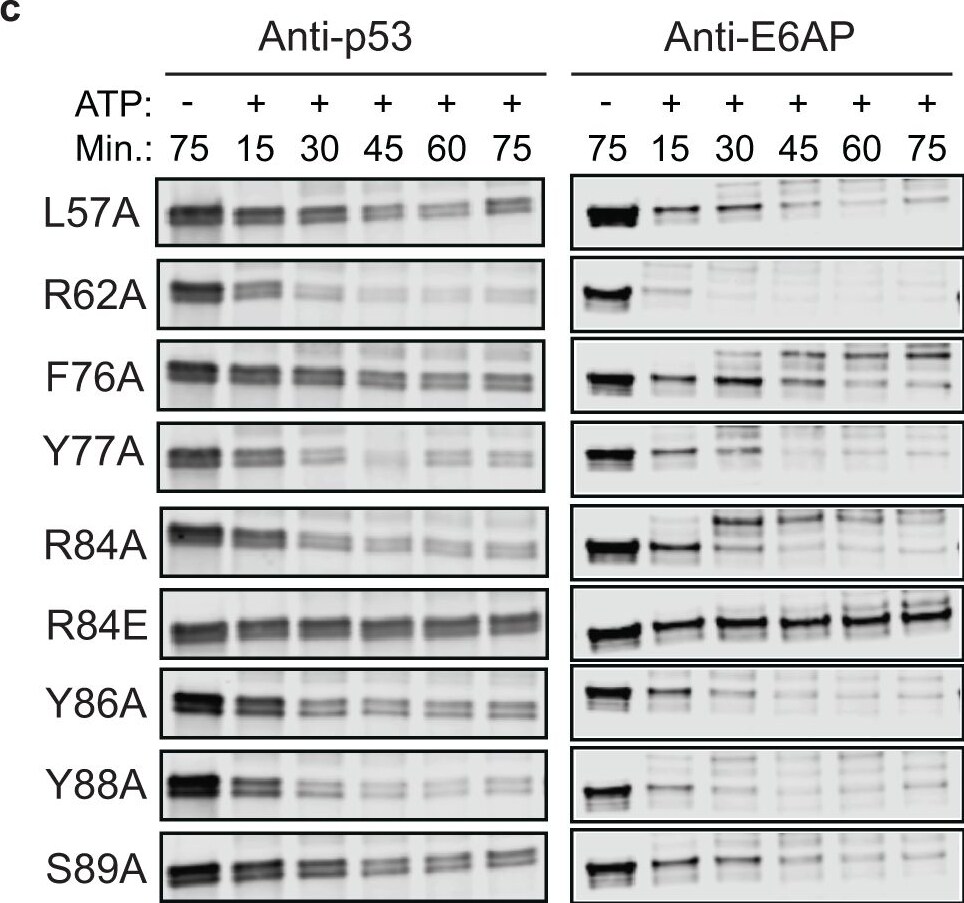
Detection of p53 by Western Blot
Rationally designed MBP-16E6 mutations disrupt its binding to E6AP.a Surface plasmon resonance (SPR) measurements of increasing concentrations of mutant MBP-16E6 binding to biotinylated E6AP. Mutations were rationally designed to disrupt the 16E6 and E6AP interaction, reducing the picomolar interaction observed in wild-type protein. The Figure shows measured binding responses (black) and curve fits to a 1:1 interaction model (red). Plots are representative from at least three independent experiments with similar results. RU, response units; KD, dissociation constant; ka, association rate; kd, dissociation rate. b p53 ubiquitination assays wherein recombinant MBP-16E6, E6AP, and p53 were incubated in the presence or absence of ATP over the indicated time, then resolved by SDS-PAGE and visualized for p53 (top panel) or E6AP (bottom panel) by Western blot. c Assay was set up as in (b) except wild-type MBP-16E6 was substituted with mutant protein and the unmodified p53 (left panels) or unmodified E6AP (right panels) were isolated. Reduced signal represents modification of p53 or E6AP by ubiquitination. Full blots with molecular weight markers can be found in Supplementary Fig. 20. d Quantification of unmodified p53 or (e) unmodified E6AP from experiments in (c). Values represent the mean ± SEM of three independent experiments for all mutant MBP-16E6 (4C4S) proteins, and six independent experiments for WT MBP-16E6 (4C4S) protein. Image collected and cropped by CiteAb from the following open publication (https://pubmed.ncbi.nlm.nih.gov/38418456), licensed under a CC-BY license. Not internally tested by R&D Systems.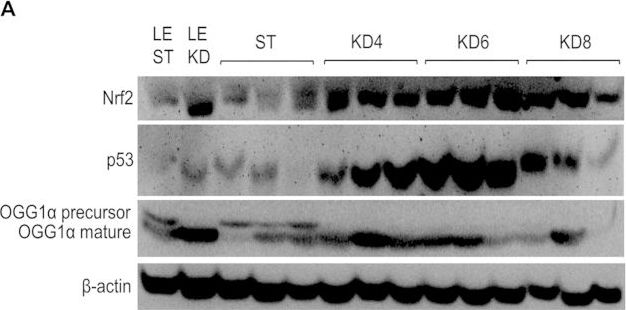
Detection of p53 by Western Blot
Immunoblot analysis of kidney lysates.(A) Blot membranes were incubated with the antibodies against Nrf2, p53 and 8-oxoguanine glycosylase alpha (OGG1 alpha ). The mean integrated optical density is related to actin for Nrf2 (B), p53 (C) and mature 8-oxoguanine glycosylase alpha (D) levels. Results are given as a mean ± S.E.M. KD4, KD6, KD8 – groups of Eker rats (Tsc2+/−) treated with HFKD for four, six or eight mo., respectively; ST – Eker rats fed with a standard diet; LE ST – wild-type Long Evans rats treated with a standard diet; LE KD – wild-type Long Evans rats treated with a ketogenic diet similarly to the KD6 group. *P < 0.05, **p < 0.01, ***p < 0.001 as compared to ST unless otherwise stated (horizontal line) for ANOVA with a Fisher post hoc test. Image collected and cropped by CiteAb from the following open publication (https://www.nature.com/articles/srep21807), licensed under a CC-BY license. Not internally tested by R&D Systems.Applications for p53 Antibody (184721)
Application
Recommended Usage
Immunocytochemistry
8-25 µg/mL
Sample: Immersion fixed HeLa human cervical epithelial carcinoma cell line
Sample: Immersion fixed HeLa human cervical epithelial carcinoma cell line
Immunoprecipitation
1-2 µg/500 µg cell lysate
Sample: CEM human T-lymphoblastoid cell line, see our available Western blot detection antibodies
Sample: CEM human T-lymphoblastoid cell line, see our available Western blot detection antibodies
Western Blot
1 µg/mL
Sample: p53 immunoprecipitated from lysates of MCF-7 human breast cancer cell line using anti-P53 monoclonal antibody???
Sample: p53 immunoprecipitated from lysates of MCF-7 human breast cancer cell line using anti-P53 monoclonal antibody???
Reviewed Applications
Read 1 review rated 5 using MAB1355 in the following applications:
Formulation, Preparation, and Storage
Purification
Protein A or G purified from hybridoma culture supernatant
Reconstitution
Reconstitute at 0.5 mg/mL in sterile PBS. For liquid material, refer to CoA for concentration.
Loading...
Formulation
Lyophilized from a 0.2 μm filtered solution in PBS with Trehalose. *Small pack size (SP) is supplied either lyophilized or as a 0.2 µm filtered solution in PBS.
Shipping
Lyophilized product is shipped at ambient temperature. Liquid small pack size (-SP) is shipped with polar packs. Upon receipt, store immediately at the temperature recommended below.
Stability & Storage
Use a manual defrost freezer and avoid repeated freeze-thaw cycles.
- 12 months from date of receipt, -20 to -70 °C as supplied.
- 1 month, 2 to 8 °C under sterile conditions after reconstitution.
- 6 months, -20 to -70 °C under sterile conditions after reconstitution.
Calculators
Background: p53
Alternate Names
BCC7, LFS1, TP53, TRP53
Gene Symbol
TP53
UniProt
Additional p53 Products
Product Documents for p53 Antibody (184721)
Certificate of Analysis
To download a Certificate of Analysis, please enter a lot or batch number in the search box below.
Note: Certificate of Analysis not available for kit components.
Product Specific Notices for p53 Antibody (184721)
For research use only
Citations for p53 Antibody (184721)
 Powered by Bioz
Customer Reviews for p53 Antibody (184721) (1)
5 out of 5
1 Customer Rating
Have you used p53 Antibody (184721)?
Submit a review and receive an Amazon gift card!
$25/€18/£15/$25CAN/¥2500 for a review with an image
$10/€7/£6/$10CAN/¥1110 for a review without an image
Submit a review
Customer Images
Showing
1
-
1 的
1 review
Showing All
Filter By:
-
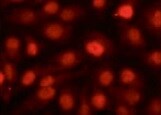
Application: Immunocytochemistry/ImmunofluorescenceSample Tested: Cancer cell lineSpecies: HumanVerified Customer | Posted 10/13/2021

There are no reviews that match your criteria.
Protocols
Find general support by application which include: protocols, troubleshooting, illustrated assays, videos and webinars.
- Appropriate Fixation of IHC/ICC Samples
- Cellular Response to Hypoxia Protocols
- ClariTSA™ Fluorophore Kits
- Detection & Visualization of Antibody Binding
- ICC Cell Smear Protocol for Suspension Cells
- ICC Immunocytochemistry Protocol Videos
- ICC for Adherent Cells
- Immunocytochemistry (ICC) Protocol
- Immunocytochemistry Troubleshooting
- Immunofluorescence of Organoids Embedded in Cultrex Basement Membrane Extract
- Immunohistochemistry (IHC) and Immunocytochemistry (ICC) Protocols
- Immunoprecipitation Protocol
- Preparing Samples for IHC/ICC Experiments
- Preventing Non-Specific Staining (Non-Specific Binding)
- Primary Antibody Selection & Optimization
- Protocol for VisUCyte™ HRP Polymer Detection Reagent
- Protocol for the Fluorescent ICC Staining of Cell Smears - Graphic
- Protocol for the Fluorescent ICC Staining of Cultured Cells on Coverslips - Graphic
- Protocol for the Preparation and Fluorescent ICC Staining of Cells on Coverslips
- Protocol for the Preparation and Fluorescent ICC Staining of Non-adherent Cells
- Protocol for the Preparation and Fluorescent ICC Staining of Stem Cells on Coverslips
- Protocol for the Preparation of a Cell Smear for Non-adherent Cell ICC - Graphic
- R&D Systems Quality Control Western Blot Protocol
- TUNEL and Active Caspase-3 Detection by IHC/ICC Protocol
- The Importance of IHC/ICC Controls
- Troubleshooting Guide: Western Blot Figures
- Western Blot Conditions
- Western Blot Protocol
- Western Blot Protocol for Cell Lysates
- Western Blot Troubleshooting
- Western Blot Troubleshooting Guide
- View all Protocols, Troubleshooting, Illustrated assays and Webinars
Loading...
Associated Pathways


