
Key Product Details
Species Reactivity
Validated:
Mouse
Cited:
Human, Mouse, Transgenic Mouse, Xenograft
Applications
Validated:
Immunohistochemistry, Western Blot, Flow Cytometry, CyTOF-ready
Cited:
Immunohistochemistry, Immunohistochemistry-Paraffin, Immunohistochemistry-Frozen, Western Blot, Immunocytochemistry, ELISA Capture
Label
Unconjugated
Antibody Source
Polyclonal Goat IgG
Loading...
Product Specifications
Immunogen
S. frugiperda insect ovarian cell line Sf 21-derived recombinant mouse PD-1
Leu25-Gln167
Accession # Q02242
Leu25-Gln167
Accession # Q02242
Specificity
Detects mouse PD-1 in direct ELISAs and Western blots. In direct ELISAs, approximately 20% cross-reactivity with recombinant human PD‑1 is observed.
Clonality
Polyclonal
Host
Goat
Isotype
IgG
Scientific Data Images for Mouse PD-1 Antibody
Detection of Mouse PD‑1 by Western Blot.
Western blot shows lysates of EL-4 mouse lymphoblast cell line and CTLL-2 mouse cytotoxic T cell line (negative control). PVDF membrane was probed with 0.2 µg/mL of Goat Anti-Mouse PD-1 Antigen Affinity-purified Polyclonal Antibody (Catalog # AF1021) followed by HRP-conjugated Anti-Goat IgG Secondary Antibody (Catalog # HAF017). A specific band was detected for PD-1 at approximately 55 kDa (as indicated). This experiment was conducted under reducing conditions and using Immunoblot Buffer Group 1.
Detection of Mouse PD‑1 by Western Blot.
Western blot shows lysates of 293T human embryonic kidney cell line mock transfected or transfected with mouse PD-1. PVDF membrane was probed with 0.2 µg/mL of Goat Anti-Mouse PD-1 Antigen Affinity-purified Polyclonal Antibody (Catalog # AF1021) followed by HRP-conjugated Anti-Goat IgG Secondary Antibody (Catalog # HAF017). A specific band was detected for PD-1 at approximately 75 kDa (as indicated). This experiment was conducted under reducing conditions and using Immunoblot Buffer Group 1.
PD‑1 in Mouse Thymus.
PD‑1 was detected in perfusion fixed frozen sections of mouse thymus using 15 µg/mL Mouse PD‑1 Antigen Affinity-purified Polyclonal Antibody (Catalog # AF1021) overnight at 4 °C. Tissue was stained (red) and counterstained (green). View our protocol for Fluorescent IHC Staining of Frozen Tissue Sections.
PD‑1 in Mouse Spleen.
PD-1 was detected in perfusion fixed frozen sections of mouse spleen using Goat Anti-Mouse PD-1 Antigen Affinity-purified Polyclonal Antibody (Catalog # AF1021) at 5 µg/mL overnight at 4 °C. Tissue was stained using the Anti-Goat HRP-DAB Cell & Tissue Staining Kit (brown; Catalog # CTS008) and counterstained with hematoxylin (blue). Specific staining was localized to cytoplasm in splenocytes. View our protocol for Chromogenic IHC Staining of Frozen Tissue Sections.
PD‑1 in Mouse Thymus.
PD-1 was detected in perfusion fixed paraffin-embedded sections of mouse thymus using Goat Anti-Mouse PD-1 Antigen Affinity-purified Polyclonal Antibody (Catalog # AF1021) at 1.7 µg/mL for 1 hour at room temperature followed by incubation with the Anti-Goat IgG VisUCyte™ HRP Polymer Antibody (Catalog # VC004). Before incubation with the primary antibody, tissue was subjected to heat-induced epitope retrieval using Antigen Retrieval Reagent-Basic (Catalog # CTS013). Tissue was stained using DAB (brown) and counterstained with hematoxylin (blue). Specific staining was localized to cell membranes. View our protocol for IHC Staining with VisUCyte HRP Polymer Detection Reagents.
Detection of Mouse PD-1 by Western Blot
Expression and glycosylation of Siglec-1 counter-receptors on resting and activated Tregs.(A) Eight Siglec-1 counter receptors were randomly selected for cytometry analysis. All experiments were performed three times and similar results were observed. (B) Normalized mRNA counts of Siglec-1 counter receptors were obtained from Treg RNA-Seq data. The result is visualized in a volcano plot. Only a small subset of counter-receptors showed strongly increased gene expression following Treg activation. The counter-receptors selected for flow cytometry analysis are highlighted in red. (C) Western blot showing that CD48 had a higher molecular weight in activated Tregs. (D) Western blot of PD-1 affinity-purified from resting and activated Tregs. PD 1 showed a dramatic decrease of molecular weight after PNGase F digestion (D), PD-1 from activated Tregs had higher molecular weight (E) and following sialidase treatment, PD-1 from resting and activated Tregs migrated at a slightly reduced molecular weight indicating the presence of sialic acids (F). Image collected and cropped by CiteAb from the following open publication (https://pubmed.ncbi.nlm.nih.gov/35224210), licensed under a CC-BY license. Not internally tested by R&D Systems.
Detection of PD‑1 in HEK293 cell line transfected with mouse PD-1 and eGFP by flow cytometry.
HEK293 human embryonic kidney cell line transfected with (A) mouse PD-1 or (B) irrelevant transfected cell line and eGFP were stained with Goat Anti-Mouse PD‑1 Antigen Affinity-purified Polyclonal Antibody (Catalog # AF1021) followed by Allophycocyanin-conjugated Anti-Goat IgG Secondary Antibody (Catalog # F0108). View our protocol for Staining Membrane-associated Proteins.Applications for Mouse PD-1 Antibody
Application
Recommended Usage
CyTOF-ready
Ready to be labeled using established conjugation methods. No BSA or other carrier proteins that could interfere with conjugation.
Flow Cytometry
0.25 µg/106 cells
Sample: HEK293 human embyonic kidney cell line transfected with mouse PD-1 and eGFP vs irrelevant HEK293 transfected cell line
Sample: HEK293 human embyonic kidney cell line transfected with mouse PD-1 and eGFP vs irrelevant HEK293 transfected cell line
Immunohistochemistry
5-15 µg/mL
Sample: Perfusion fixed frozen sections of mouse thymus and mouse spleen, and perfusion fixed paraffin-embedded sections of mouse thymus
Sample: Perfusion fixed frozen sections of mouse thymus and mouse spleen, and perfusion fixed paraffin-embedded sections of mouse thymus
Western Blot
0.2 µg/mL
Sample: EL‑4 mouse lymphoblast cell line and 293T human embryonic kidney cell line transfected with mouse PD-1
Sample: EL‑4 mouse lymphoblast cell line and 293T human embryonic kidney cell line transfected with mouse PD-1
Reviewed Applications
Read 5 reviews rated 4.6 using AF1021 in the following applications:
Flow Cytometry Panel Builder
Bio-Techne Knows Flow Cytometry
Save time and reduce costly mistakes by quickly finding compatible reagents using the Panel Builder Tool.
Advanced Features
- Spectra Viewer - Custom analysis of spectra from multiple fluorochromes
- Spillover Popups - Visualize the spectra of individual fluorochromes
- Antigen Density Selector - Match fluorochrome brightness with antigen density

Formulation, Preparation, and Storage
Purification
Antigen Affinity-purified
Reconstitution
Reconstitute at 0.2 mg/mL in sterile PBS. For liquid material, refer to CoA for concentration.
Loading...
Formulation
Lyophilized from a 0.2 μm filtered solution in PBS with Trehalose. See Certificate of Analysis for details.
*Small pack size (-SP) is supplied either lyophilized or as a 0.2 µm filtered solution in PBS.
*Small pack size (-SP) is supplied either lyophilized or as a 0.2 µm filtered solution in PBS.
Shipping
Lyophilized product is shipped at ambient temperature. Liquid small pack size (-SP) is shipped with polar packs. Upon receipt, store immediately at the temperature recommended below.
Stability & Storage
Use a manual defrost freezer and avoid repeated freeze-thaw cycles.
- 12 months from date of receipt, -20 to -70 °C as supplied.
- 1 month, 2 to 8 °C under sterile conditions after reconstitution.
- 6 months, -20 to -70 °C under sterile conditions after reconstitution.
Calculators
Background: PD-1
References
- Ishida, Y. et al. (1992) EMBO J. 11:3887.
- Sharpe, A.H. and G.J. Freeman (2002) Nat. Rev. Immunol. 2:116.
- Coyle, A. and J. Gutierrez-Ramos (2001) Nat. Immunol. 2:203.
- Nishimura, H. and T. Honjo (2001) Trends in Immunol. 22:265.
- Latchman Y. et al. (2001) Nature Immun. 2:261.
- Tamura, H. et al. (2001) Blood 97:1809.
Long Name
Programmed Death-1
Alternate Names
CD279, PD1, PDCD1, SLEB2
Entrez Gene IDs
Gene Symbol
PDCD1
UniProt
Additional PD-1 Products
Product Documents for Mouse PD-1 Antibody
Certificate of Analysis
To download a Certificate of Analysis, please enter a lot or batch number in the search box below.
Note: Certificate of Analysis not available for kit components.
Product Specific Notices for Mouse PD-1 Antibody
For research use only
Citations for Mouse PD-1 Antibody
 Powered by Bioz
Customer Reviews for Mouse PD-1 Antibody (5)
4.6 out of 5
5 Customer Ratings
Have you used Mouse PD-1 Antibody?
Submit a review and receive an Amazon gift card!
$25/€18/£15/$25CAN/¥2500 Yen for a review with an image
$10/€7/£6/$10CAN/¥1110 Yen for a review without an image
Submit a review
Customer Images
Showing
1
-
5 的
5 reviews
Showing All
Filter By:
-
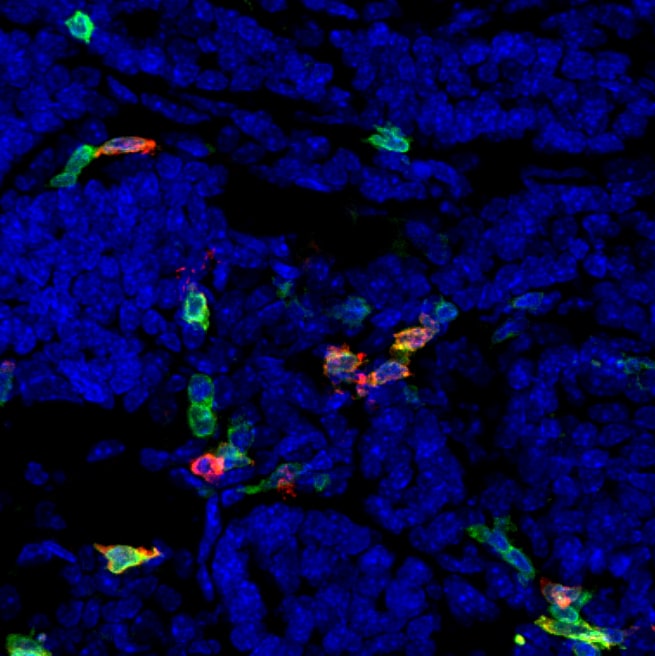
Application: Immunocytochemistry/ImmunofluorescenceSample Tested: Mammary gland tissueSpecies: MouseVerified Customer | Posted 07/09/2019Cryosections from PLP immersion fixed PyMT mammary gland tumors were stained for PD1 (1:50) for 4h @ RT. After washing, tissue was stained with Donkey anti-Goat alexa546 2ndary antibody for 1h at RT. CD3 in green, PD1 in red, nuclear staining (Hoechst) in blue

-
Application: Western BlotSample Tested: HCT-116 human colorectal carcinoma cell lineSpecies: HumanVerified Customer | Posted 03/28/2019
-
Application: Functional AssaySample Tested: mouse antibodySpecies: MouseVerified Customer | Posted 03/07/2018
-
Application: ELISASample Tested: Human recombinant antibodySpecies: MouseVerified Customer | Posted 09/29/2017
-
Application: Flow CytometrySample Tested: Melanoma tissue and Human T cellSpecies: HumanVerified Customer | Posted 06/15/2017
There are no reviews that match your criteria.
Protocols
Find general support by application which include: protocols, troubleshooting, illustrated assays, videos and webinars.
- 7-Amino Actinomycin D (7-AAD) Cell Viability Flow Cytometry Protocol
- Antigen Retrieval Protocol (PIER)
- Antigen Retrieval for Frozen Sections Protocol
- Appropriate Fixation of IHC/ICC Samples
- Cellular Response to Hypoxia Protocols
- Chromogenic IHC Staining of Formalin-Fixed Paraffin-Embedded (FFPE) Tissue Protocol
- Chromogenic Immunohistochemistry Staining of Frozen Tissue
- ClariTSA™ Fluorophore Kits
- Detection & Visualization of Antibody Binding
- Extracellular Membrane Flow Cytometry Protocol
- Flow Cytometry Protocol for Cell Surface Markers
- Flow Cytometry Protocol for Staining Membrane Associated Proteins
- Flow Cytometry Staining Protocols
- Flow Cytometry Troubleshooting Guide
- Fluorescent IHC Staining of Frozen Tissue Protocol
- Graphic Protocol for Heat-induced Epitope Retrieval
- Graphic Protocol for the Preparation and Fluorescent IHC Staining of Frozen Tissue Sections
- Graphic Protocol for the Preparation and Fluorescent IHC Staining of Paraffin-embedded Tissue Sections
- Graphic Protocol for the Preparation of Gelatin-coated Slides for Histological Tissue Sections
- IHC Sample Preparation (Frozen sections vs Paraffin)
- Immunofluorescent IHC Staining of Formalin-Fixed Paraffin-Embedded (FFPE) Tissue Protocol
- Immunohistochemistry (IHC) and Immunocytochemistry (ICC) Protocols
- Immunohistochemistry Frozen Troubleshooting
- Immunohistochemistry Paraffin Troubleshooting
- Intracellular Flow Cytometry Protocol Using Alcohol (Methanol)
- Intracellular Flow Cytometry Protocol Using Detergents
- Intracellular Nuclear Staining Flow Cytometry Protocol Using Detergents
- Intracellular Staining Flow Cytometry Protocol Using Alcohol Permeabilization
- Intracellular Staining Flow Cytometry Protocol Using Detergents to Permeabilize Cells
- Preparing Samples for IHC/ICC Experiments
- Preventing Non-Specific Staining (Non-Specific Binding)
- Primary Antibody Selection & Optimization
- Propidium Iodide Cell Viability Flow Cytometry Protocol
- Protocol for Heat-Induced Epitope Retrieval (HIER)
- Protocol for Liperfluo
- Protocol for Making a 4% Formaldehyde Solution in PBS
- Protocol for VisUCyte™ HRP Polymer Detection Reagent
- Protocol for the Characterization of Human Th22 Cells
- Protocol for the Characterization of Human Th9 Cells
- Protocol for the Preparation & Fixation of Cells on Coverslips
- Protocol for the Preparation and Chromogenic IHC Staining of Frozen Tissue Sections
- Protocol for the Preparation and Chromogenic IHC Staining of Frozen Tissue Sections - Graphic
- Protocol for the Preparation and Chromogenic IHC Staining of Paraffin-embedded Tissue Sections
- Protocol for the Preparation and Chromogenic IHC Staining of Paraffin-embedded Tissue Sections - Graphic
- Protocol for the Preparation and Fluorescent IHC Staining of Frozen Tissue Sections
- Protocol for the Preparation and Fluorescent IHC Staining of Paraffin-embedded Tissue Sections
- Protocol for the Preparation of Gelatin-coated Slides for Histological Tissue Sections
- Protocol: Annexin V and PI Staining by Flow Cytometry
- Protocol: Annexin V and PI Staining for Apoptosis by Flow Cytometry
- R&D Systems Quality Control Western Blot Protocol
- TUNEL and Active Caspase-3 Detection by IHC/ICC Protocol
- The Importance of IHC/ICC Controls
- Troubleshooting Guide: Fluorokine Flow Cytometry Kits
- Troubleshooting Guide: Immunohistochemistry
- Troubleshooting Guide: Western Blot Figures
- Western Blot Conditions
- Western Blot Protocol
- Western Blot Protocol for Cell Lysates
- Western Blot Troubleshooting
- Western Blot Troubleshooting Guide
- View all Protocols, Troubleshooting, Illustrated assays and Webinars
Loading...