Best Seller
AIF-1/Iba1 Antibody
Novus Biologicals | Catalog # NB100-1028

Loading...
Key Product Details
Species Reactivity
Validated:
Human, Mouse, Rat, Canine, Equine, Feline
Cited:
Human, Mouse, Rat, Porcine, Equine, Feline
Predicted:
Porcine (100%). Backed by our 100% Guarantee.
Applications
Validated:
Knockout Validated, Immunohistochemistry, Immunohistochemistry-Paraffin, Immunohistochemistry-Frozen, Immunohistochemistry Free-Floating, Immunohistochemistry Whole-Mount, Western Blot, Peptide ELISA, Dual RNAscope ISH-IHC, Immunocytochemistry/ Immunofluorescence
Cited:
Knockout Validated, Immunohistochemistry, Immunohistochemistry-Paraffin, Immunohistochemistry-Frozen, Immunohistochemistry Free-Floating, Immunohistochemistry Whole-Mount, Western Blot, Dual RNAscope ISH-IHC, Immunocytochemistry, Immunocytochemistry/ Immunofluorescence, Immunoprecipitation, IF/IHC, IHC-F
Label
Unconjugated
Antibody Source
Polyclonal Goat IgG
Loading...
Product Specifications
Immunogen
This AIF-1/Iba1 Antibody was developed against a peptide with sequence C-TGPPAKKAISELP, from the C Terminus of the protein sequence according to NP_116573.1; NP_001614.3.
Reactivity Notes
Use in Rat reported in scientific literature (PMID: 33704579). Feline, canine and equine reactivity reported from verified customer reviews.
Marker
pan-Microglia Marker
Specificity
This AIF-1/Iba1 Antibody is expected to recognize isoform 1 (NP_116573.1) and isoform 3 (NP_001614.3). AIF-1/Iba1 is thought to be involved in negative regulation of growth of vascular smooth muscle cells, which contributes to the anti-inflammatory response to vessel wall trauma.
Clonality
Polyclonal
Host
Goat
Isotype
IgG
Theoretical MW
16.8 kDa.
Disclaimer note: The observed molecular weight of the protein may vary from the listed predicted molecular weight due to post translational modifications, post translation cleavages, relative charges, and other experimental factors.
Disclaimer note: The observed molecular weight of the protein may vary from the listed predicted molecular weight due to post translational modifications, post translation cleavages, relative charges, and other experimental factors.
Scientific Data Images for AIF-1/Iba1 Antibody
Western Blot Detection of AIF-1/Iba1 in Whole Brain Lysates
AIF-1-Iba1-Antibody-Western-Blot-NB100-1028-img0014.jpg
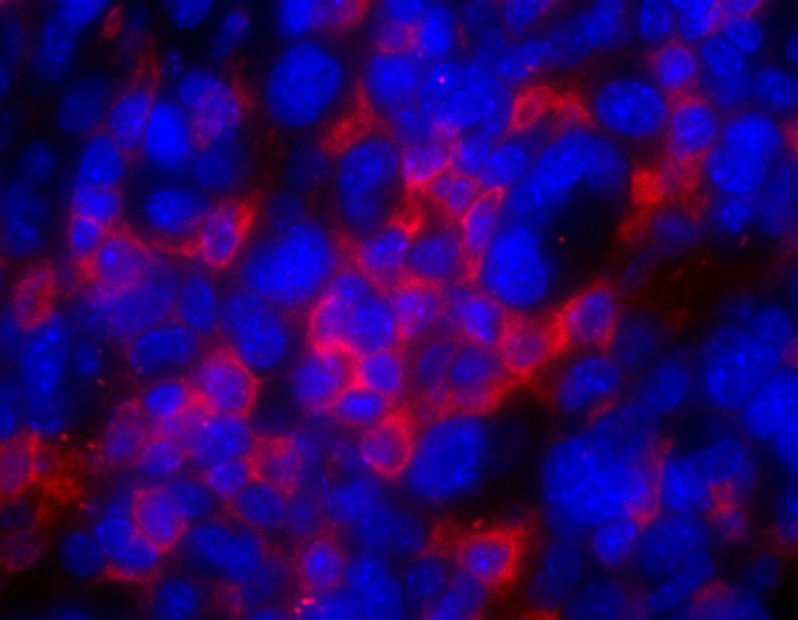
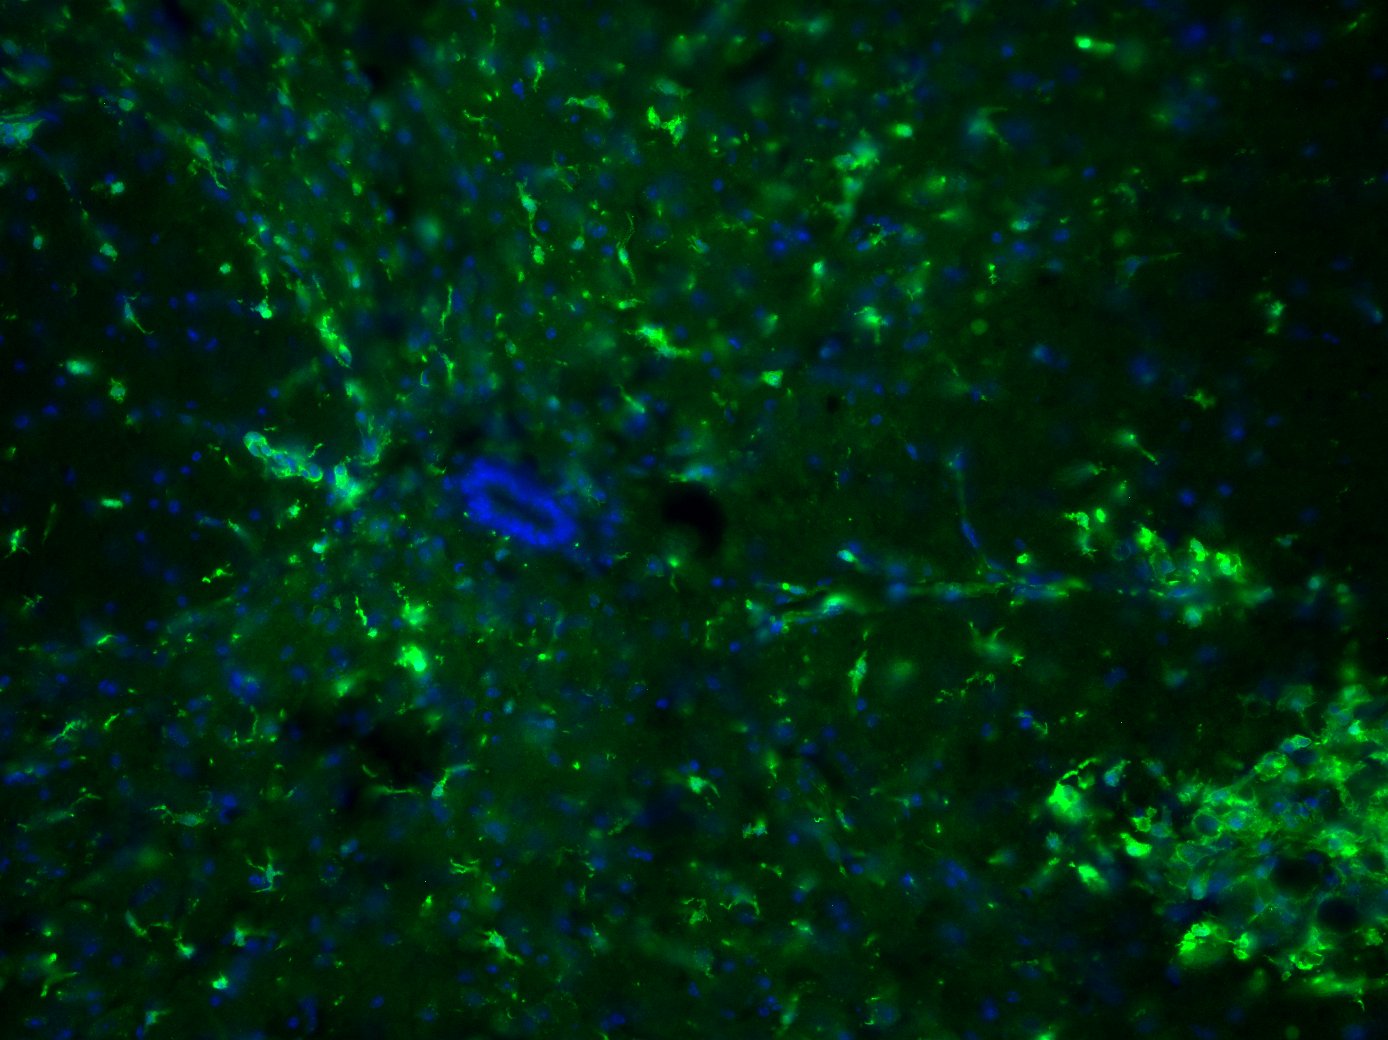
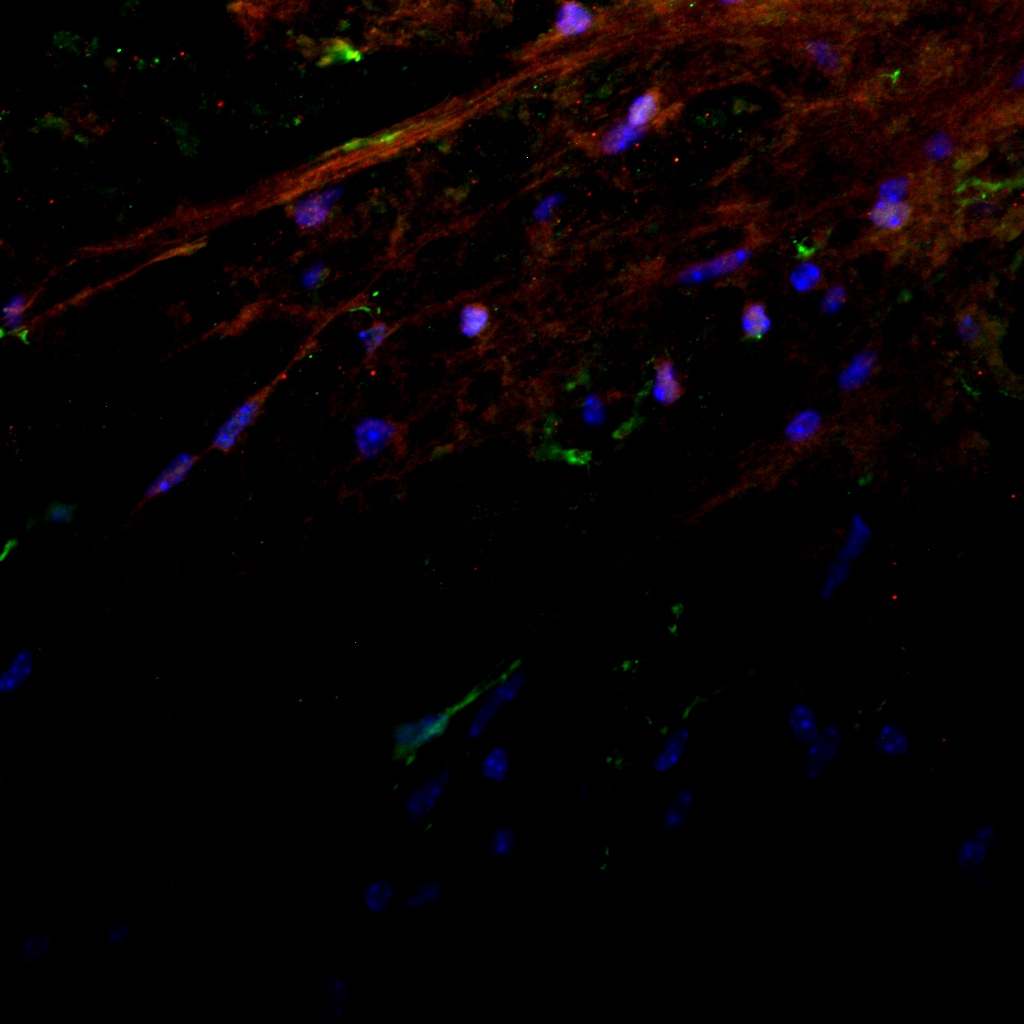
Immunohistochemical Staining of Mouse Brain Injected with Glioblastoma Cells
Reactive microglia (green) in peritumoral area of IC injected human glioblastoma cells in mouse brain. NeuN (red), DAPI (blue). Antibody at 1:250. IHC image submitted by a verified customer review.
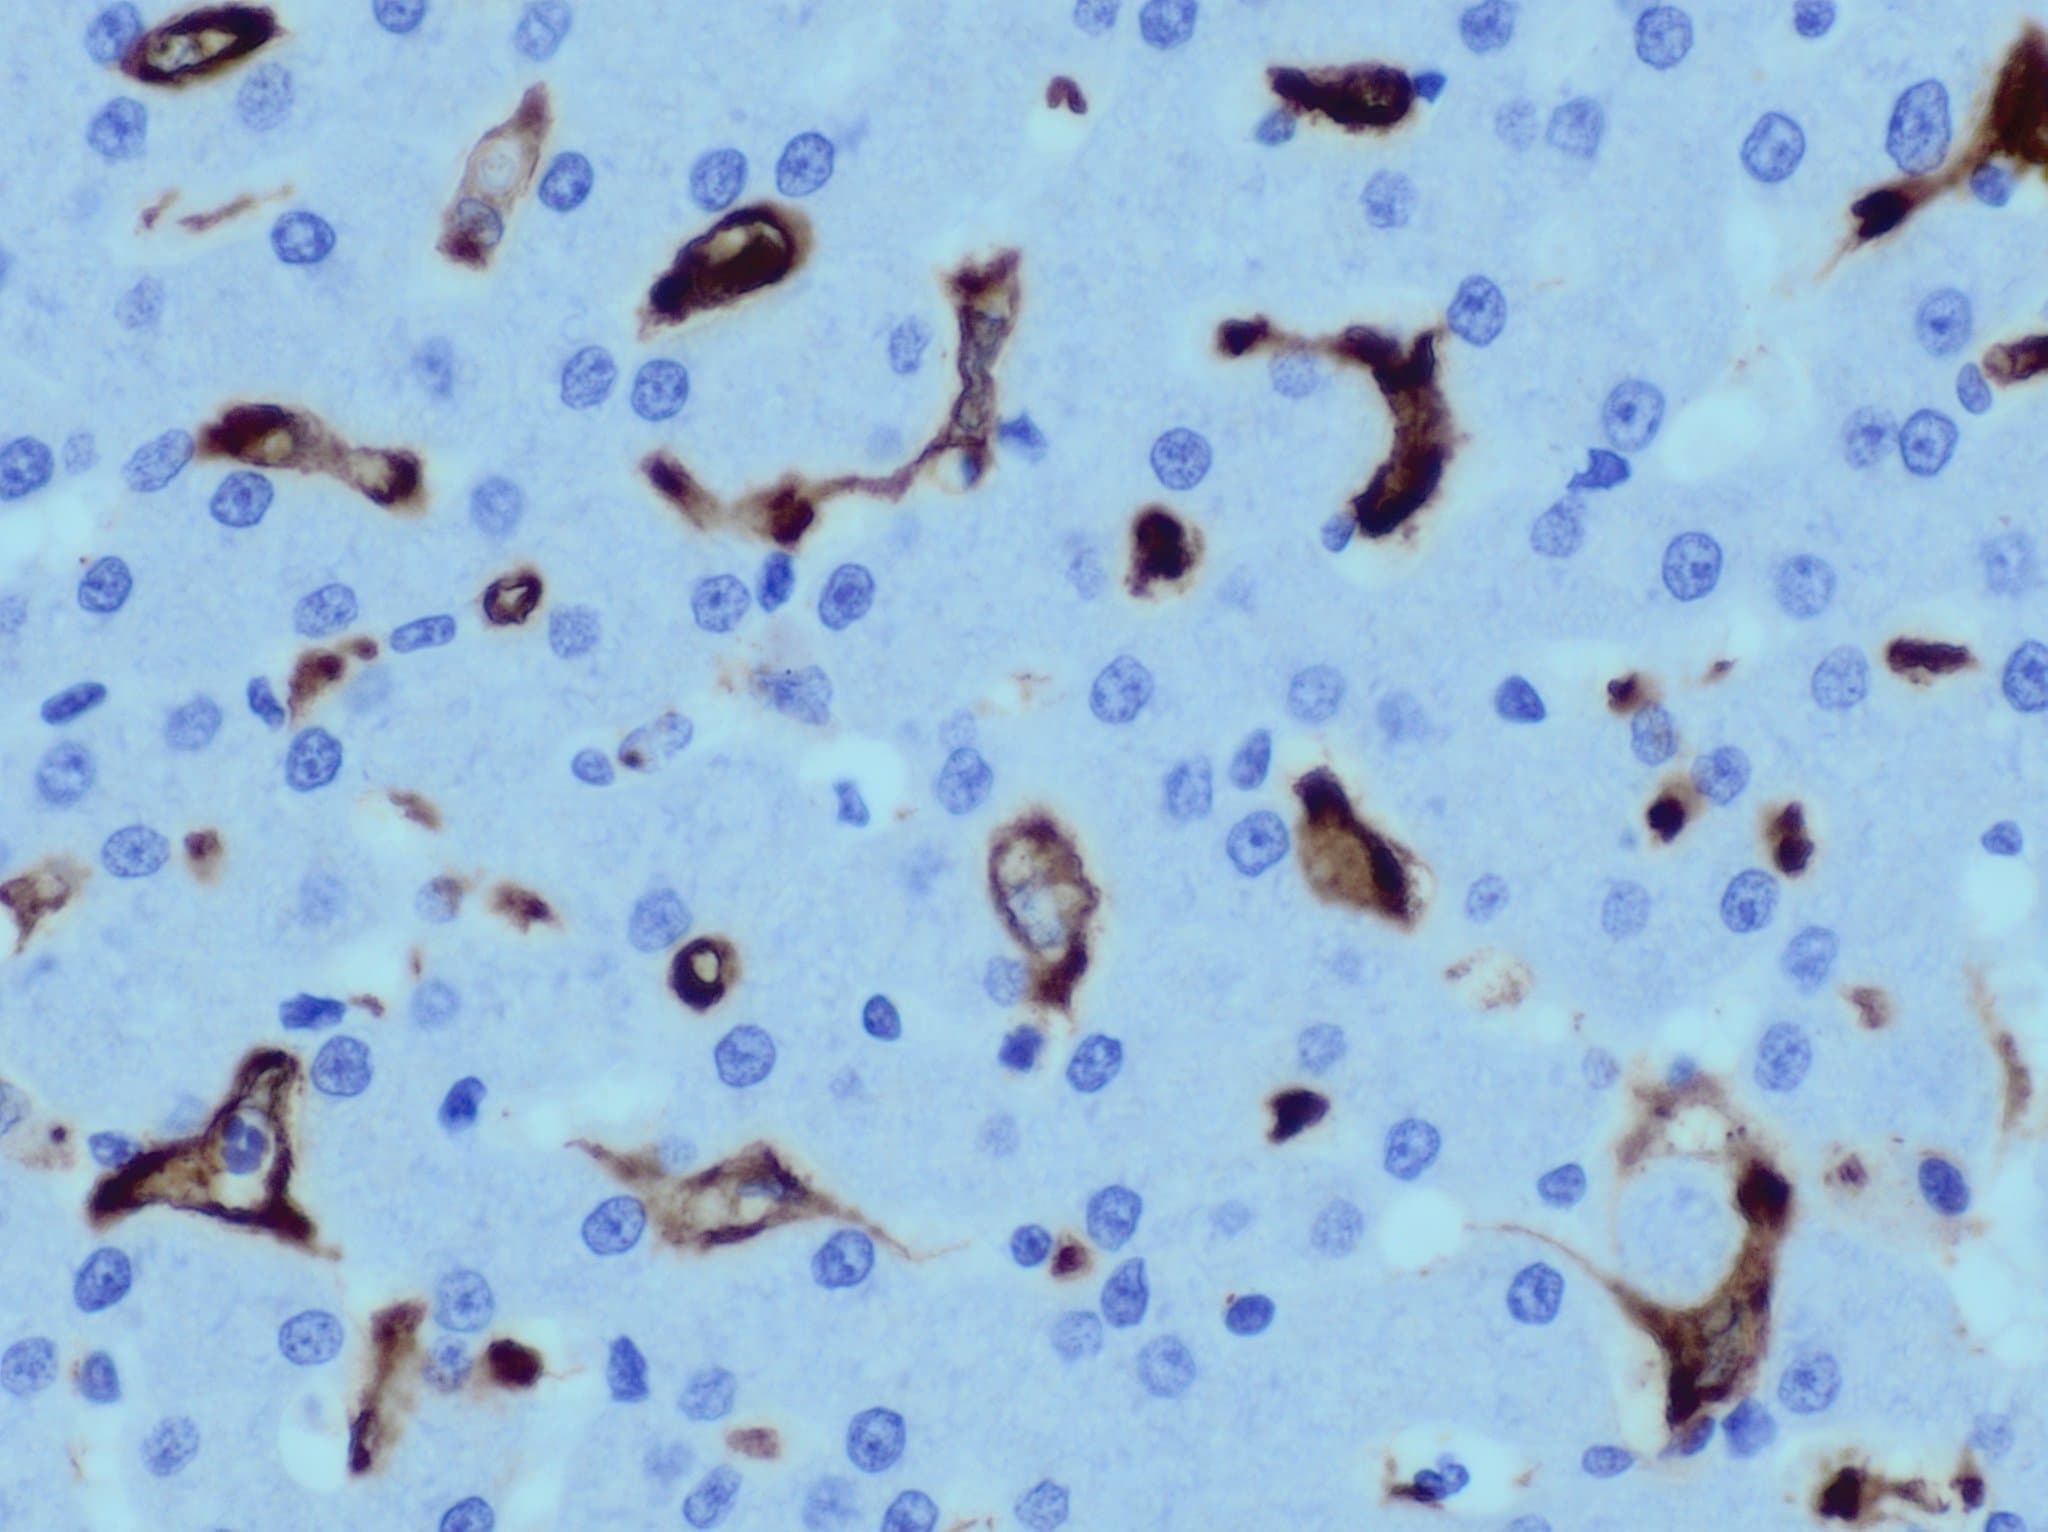
Immunohistochemical Detection of AIF-1/Iba1 in Paraffin Embedded Canine Brain
AIF-1/Iba1 in canine brain. Primary antibody used at 1 ug/mL and incubated with tissue for 30 minutes at room temperature. IHC-P image submitted by a verified customer review.
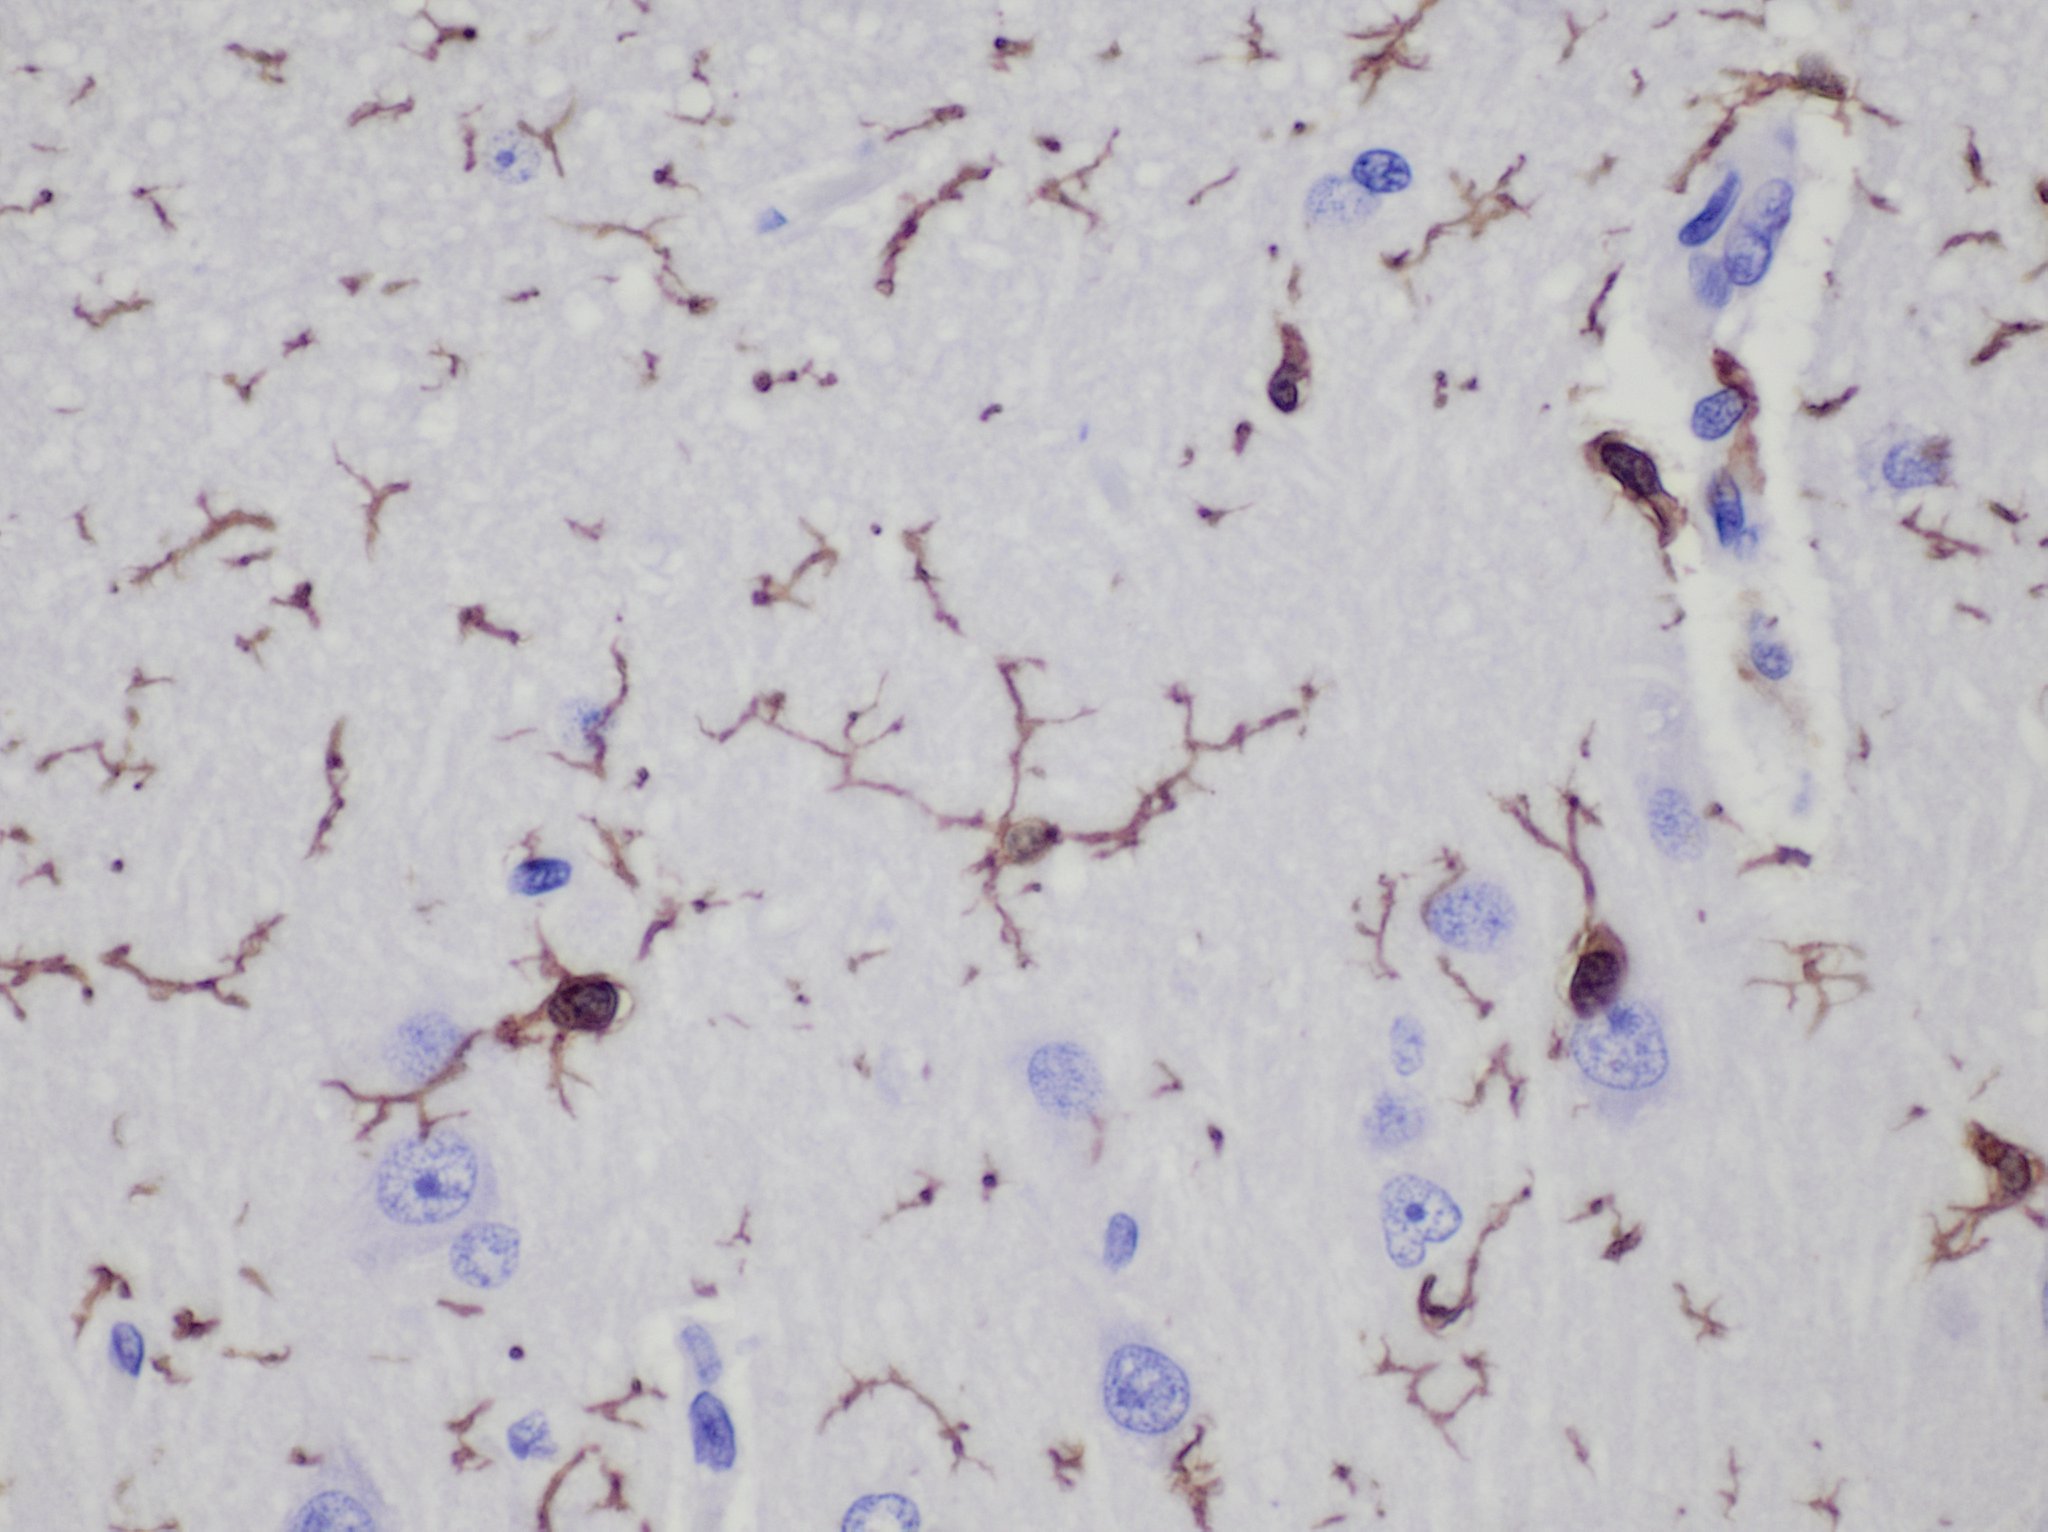
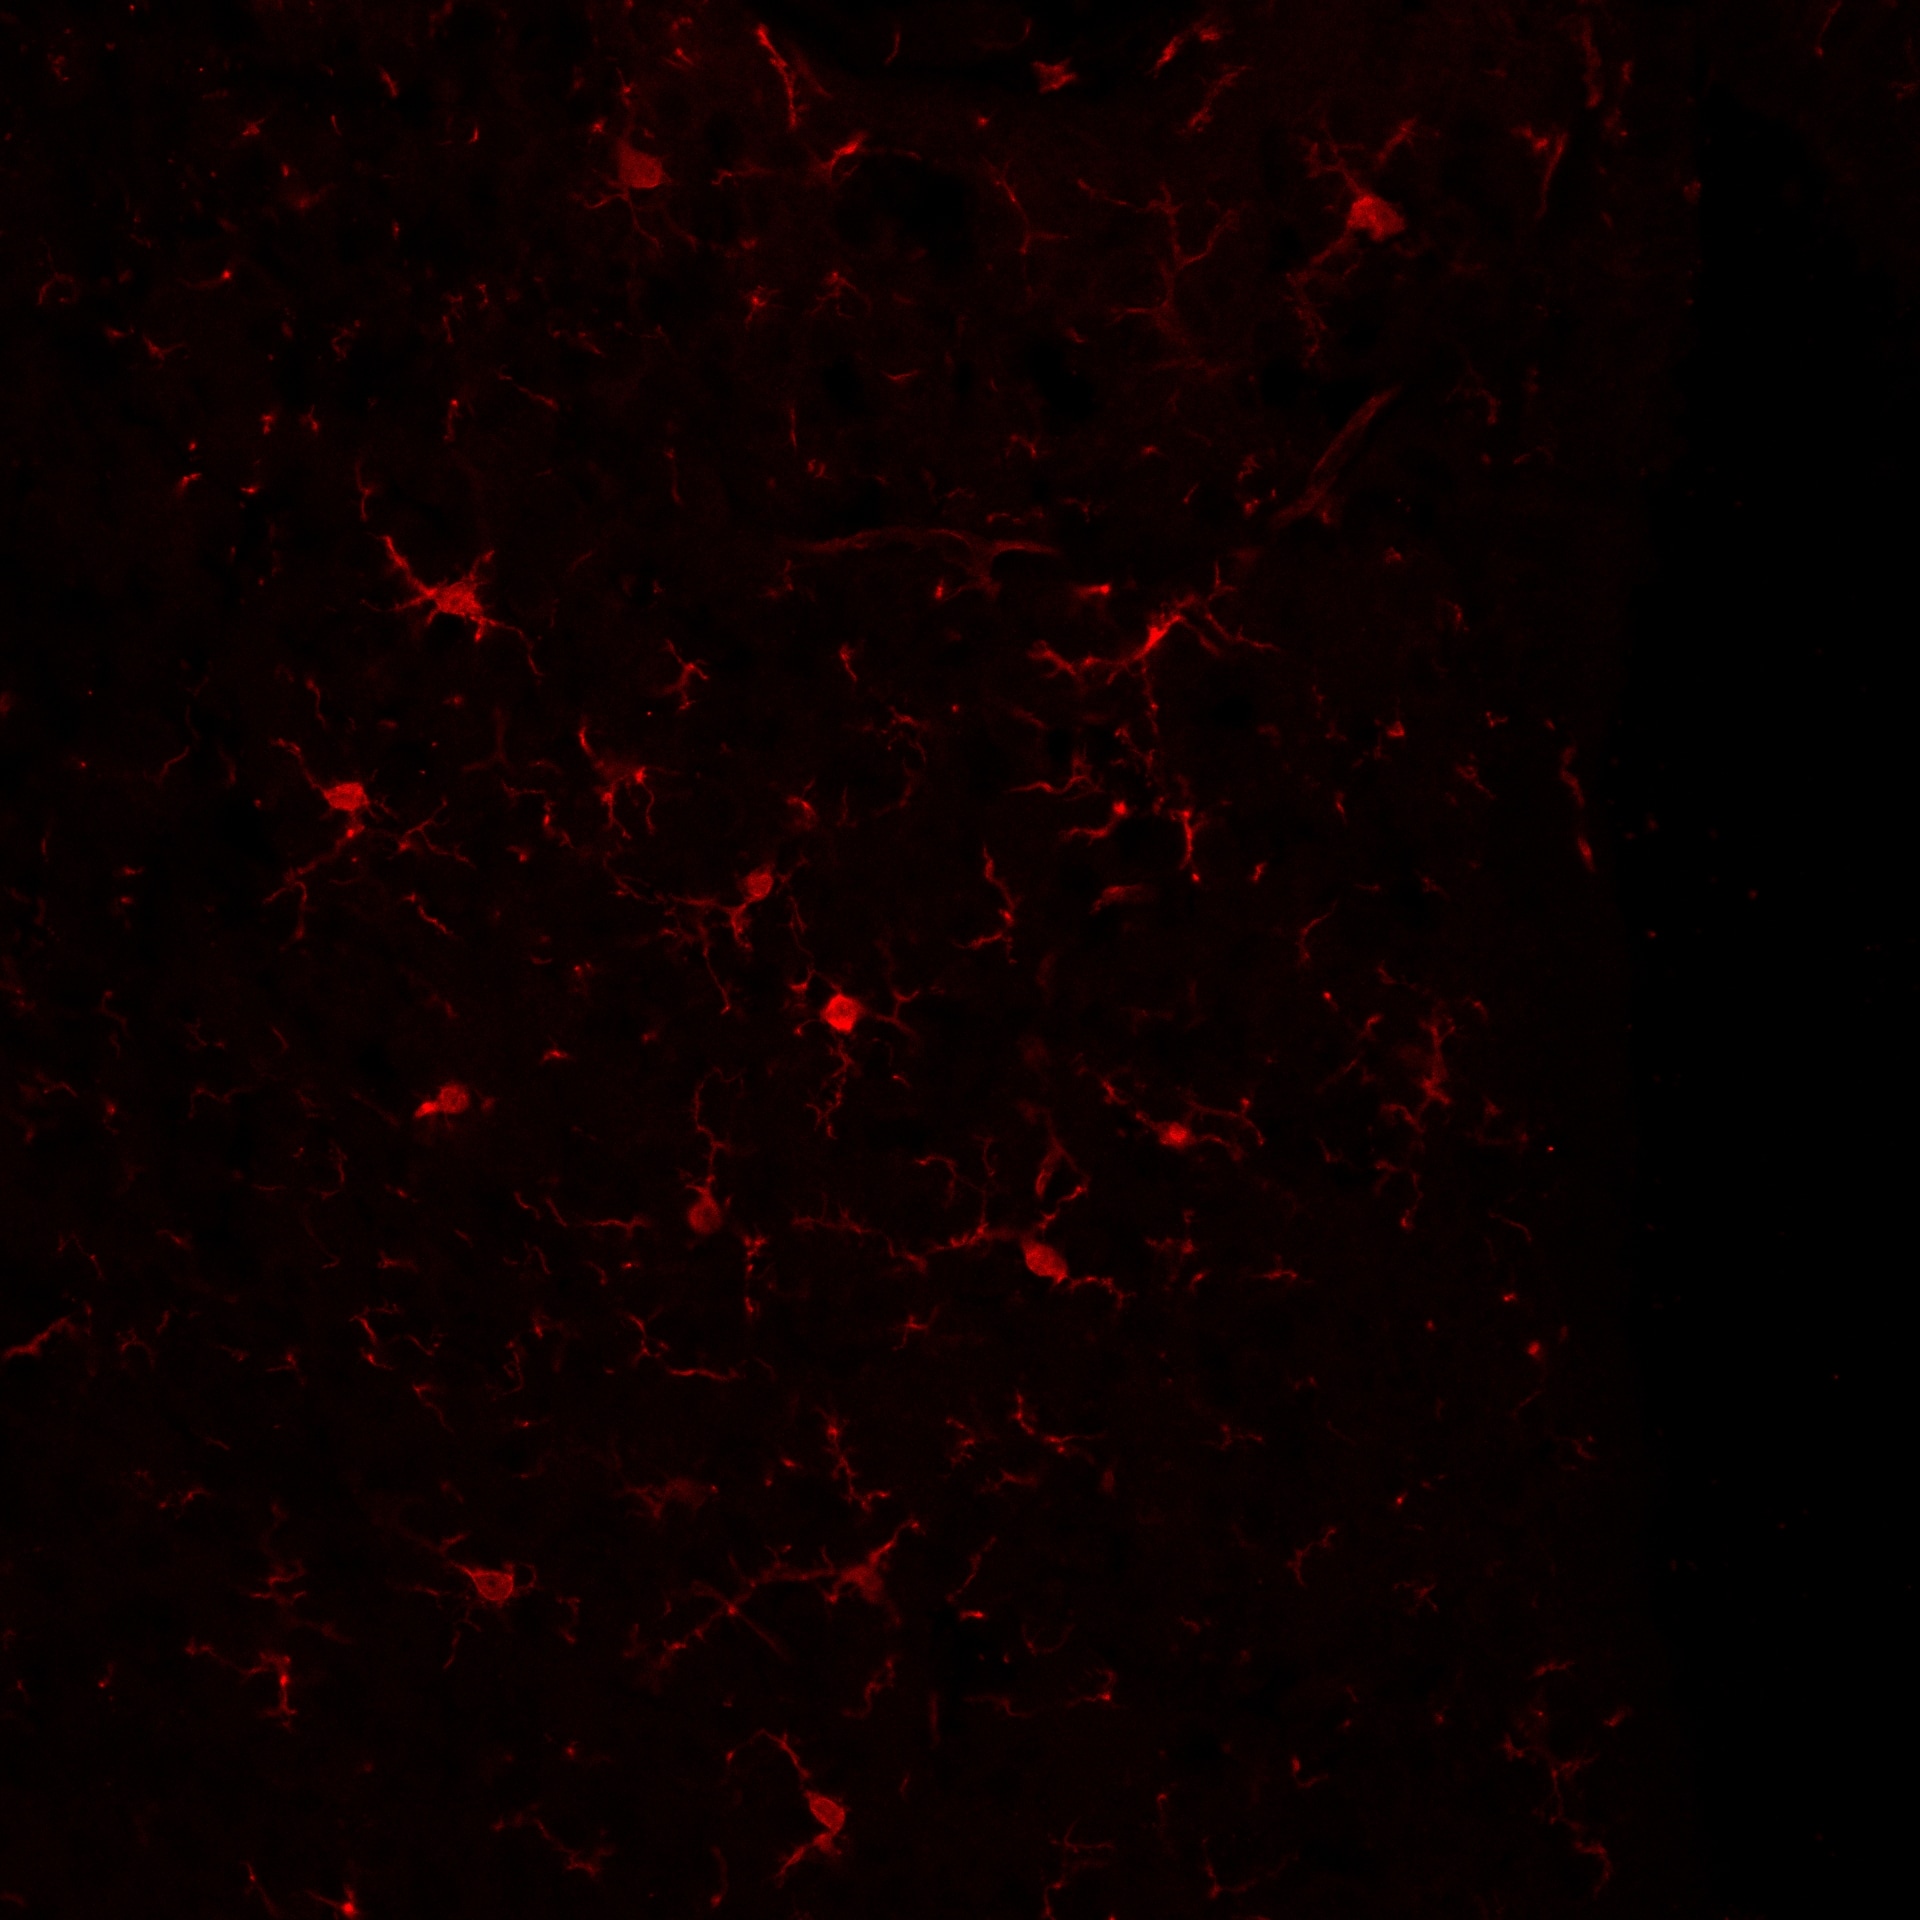
Immunohistochemical Detection of AIF-1/Iba1 in Paraffin Embedded Mouse Brain
Staining in mouse brain using AIF-1/Iba1 Antibody. IHC-P image submitted by a verified customer review.
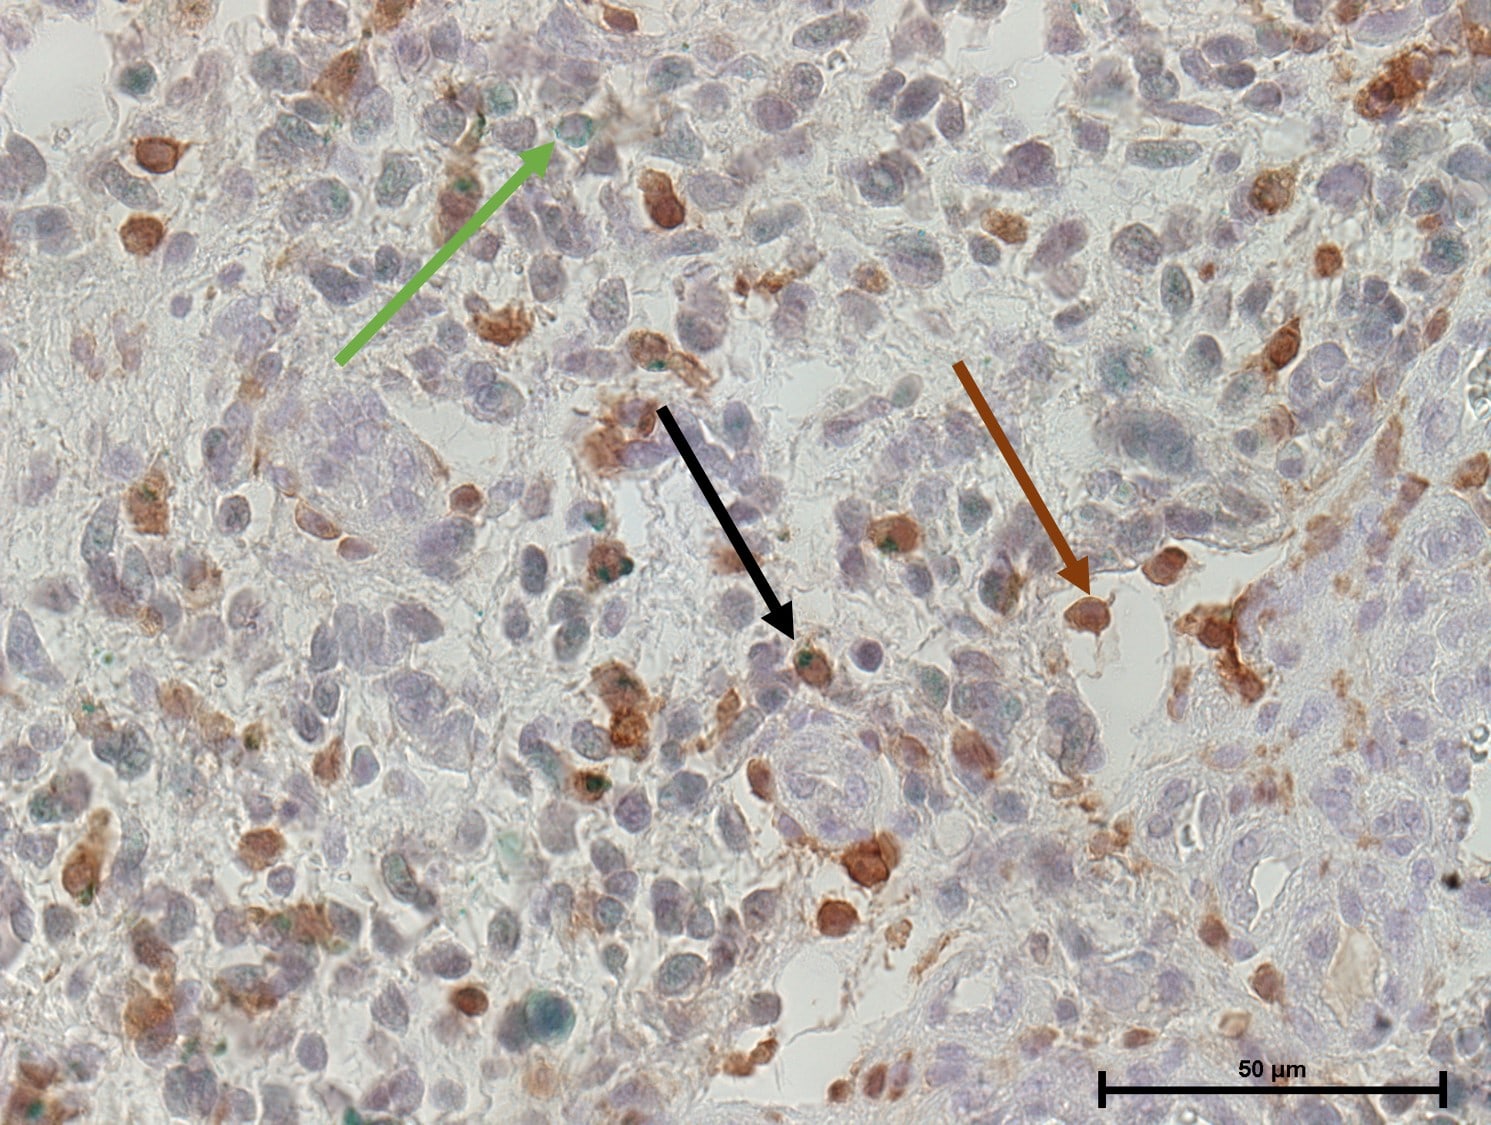
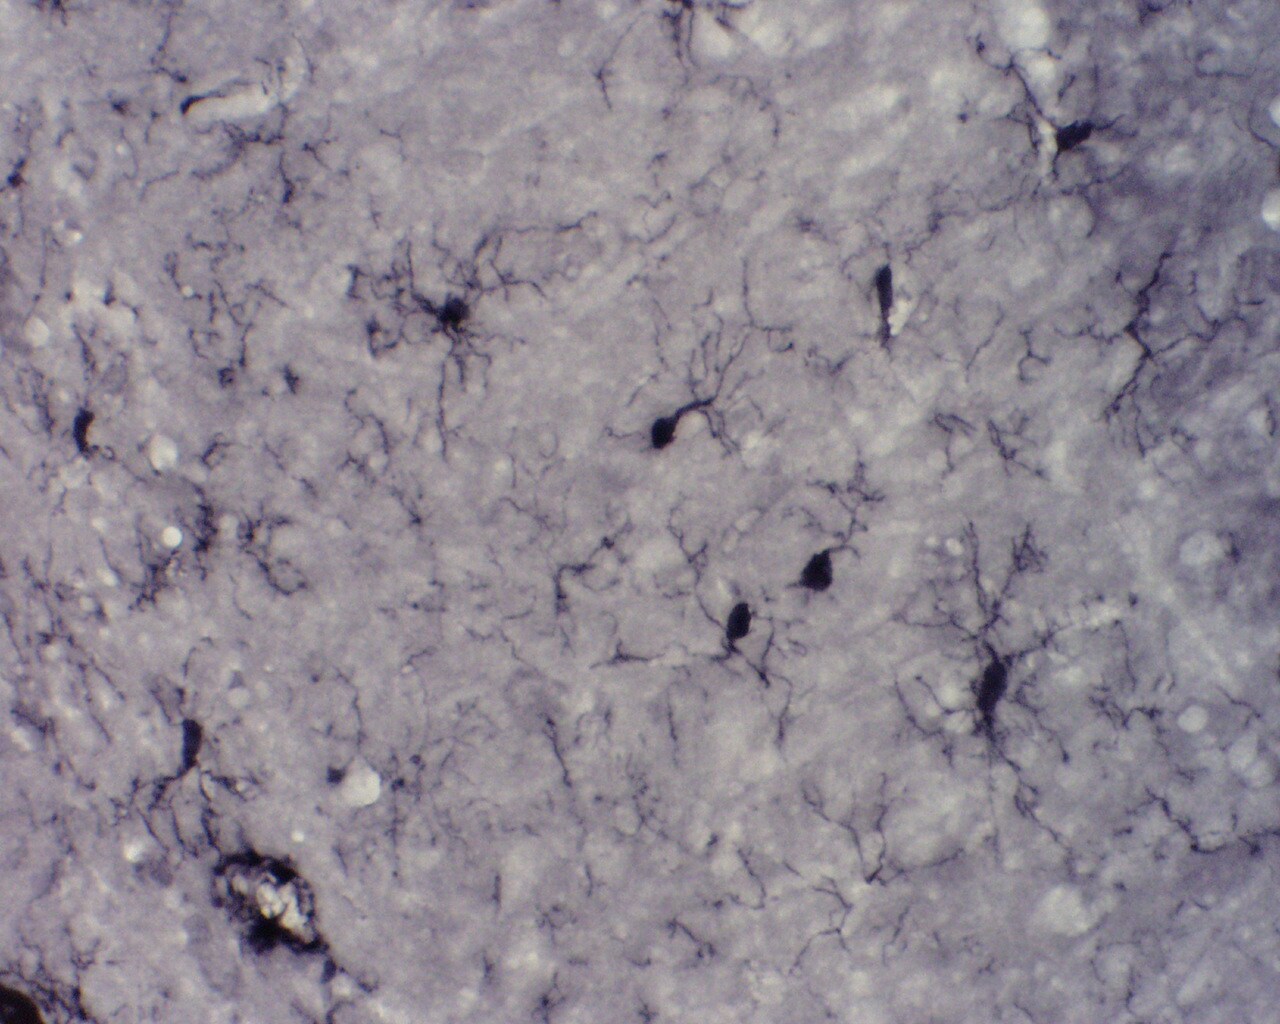
Staining of AIF-1/Iba1 in Paraffin Embedded Tissue
Brown arrow= AIF-1/Iba1 positive cells, Green arrow= mTOR positive cells, Black arrow= mTOR and AIF-1/Iba1 positive cells. IHC-P image submitted by a verified customer review.
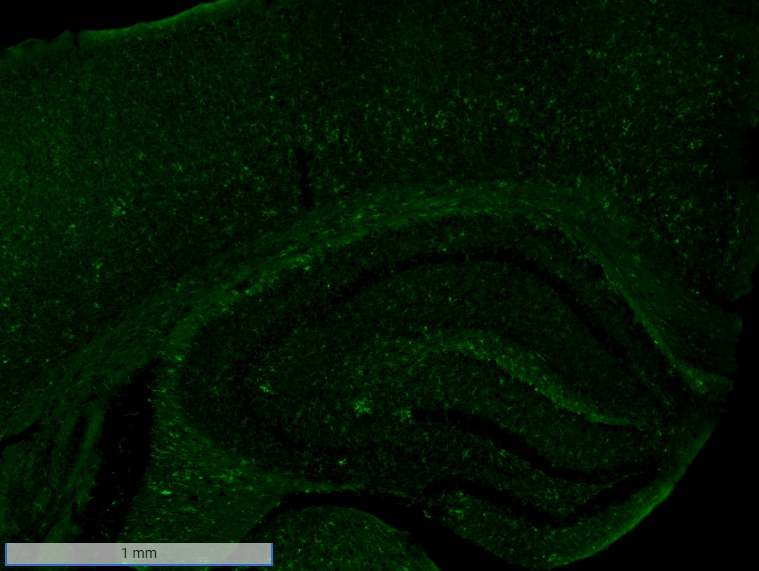
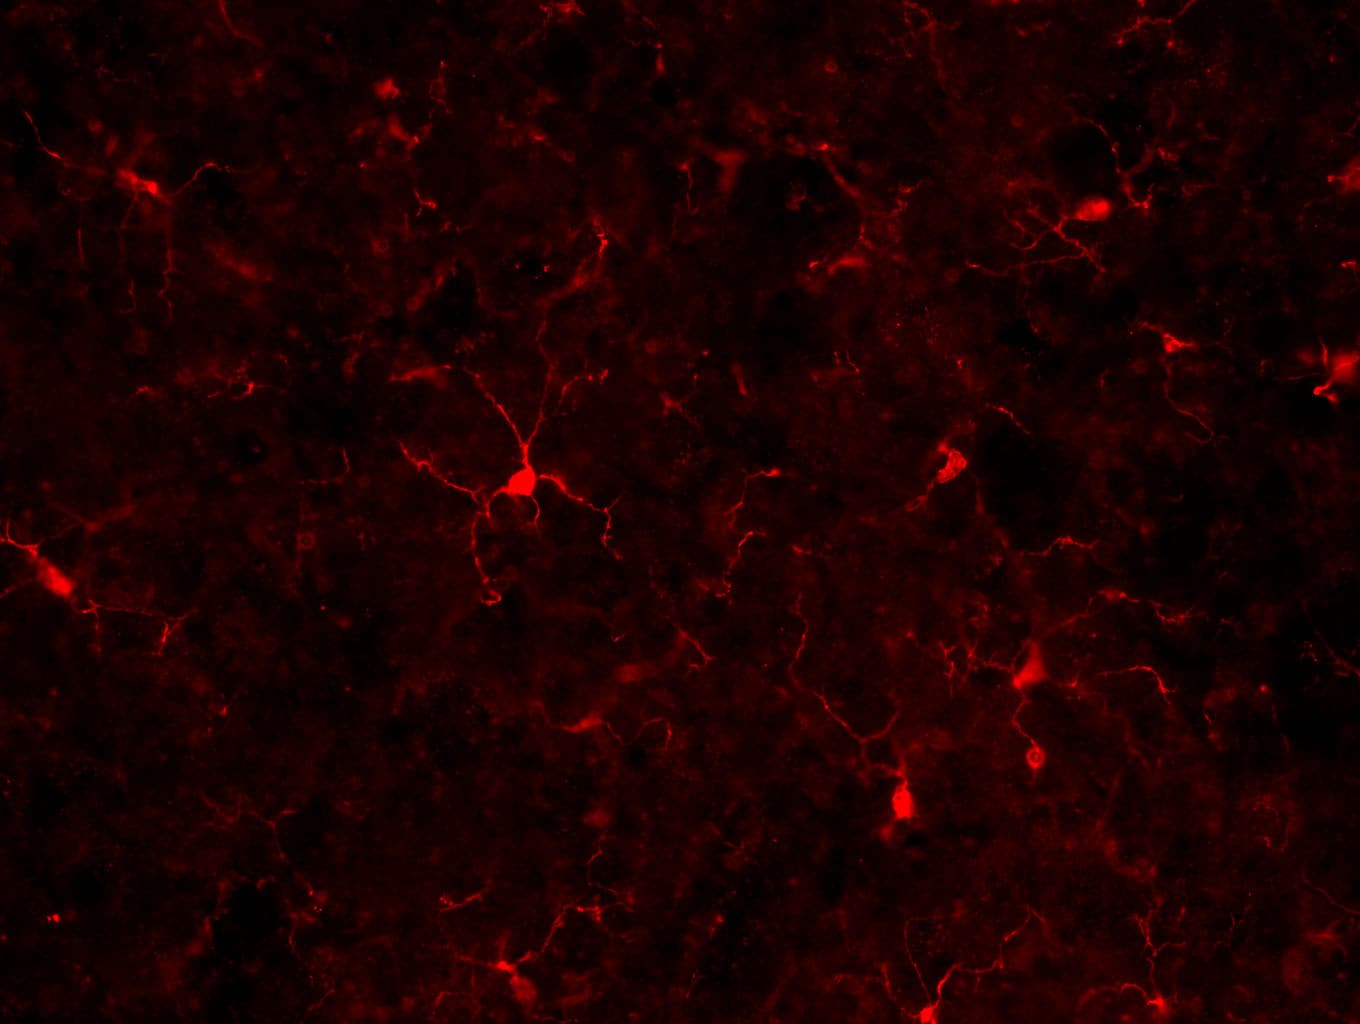
Immunohistochemical Staining of AIF-1/Iba1 in Frozen Rat Hippocampus
Staining in rat hippocampus using AIF-1/Iba1 Antibody. IHC-Fr image submitted by a verified customer review.
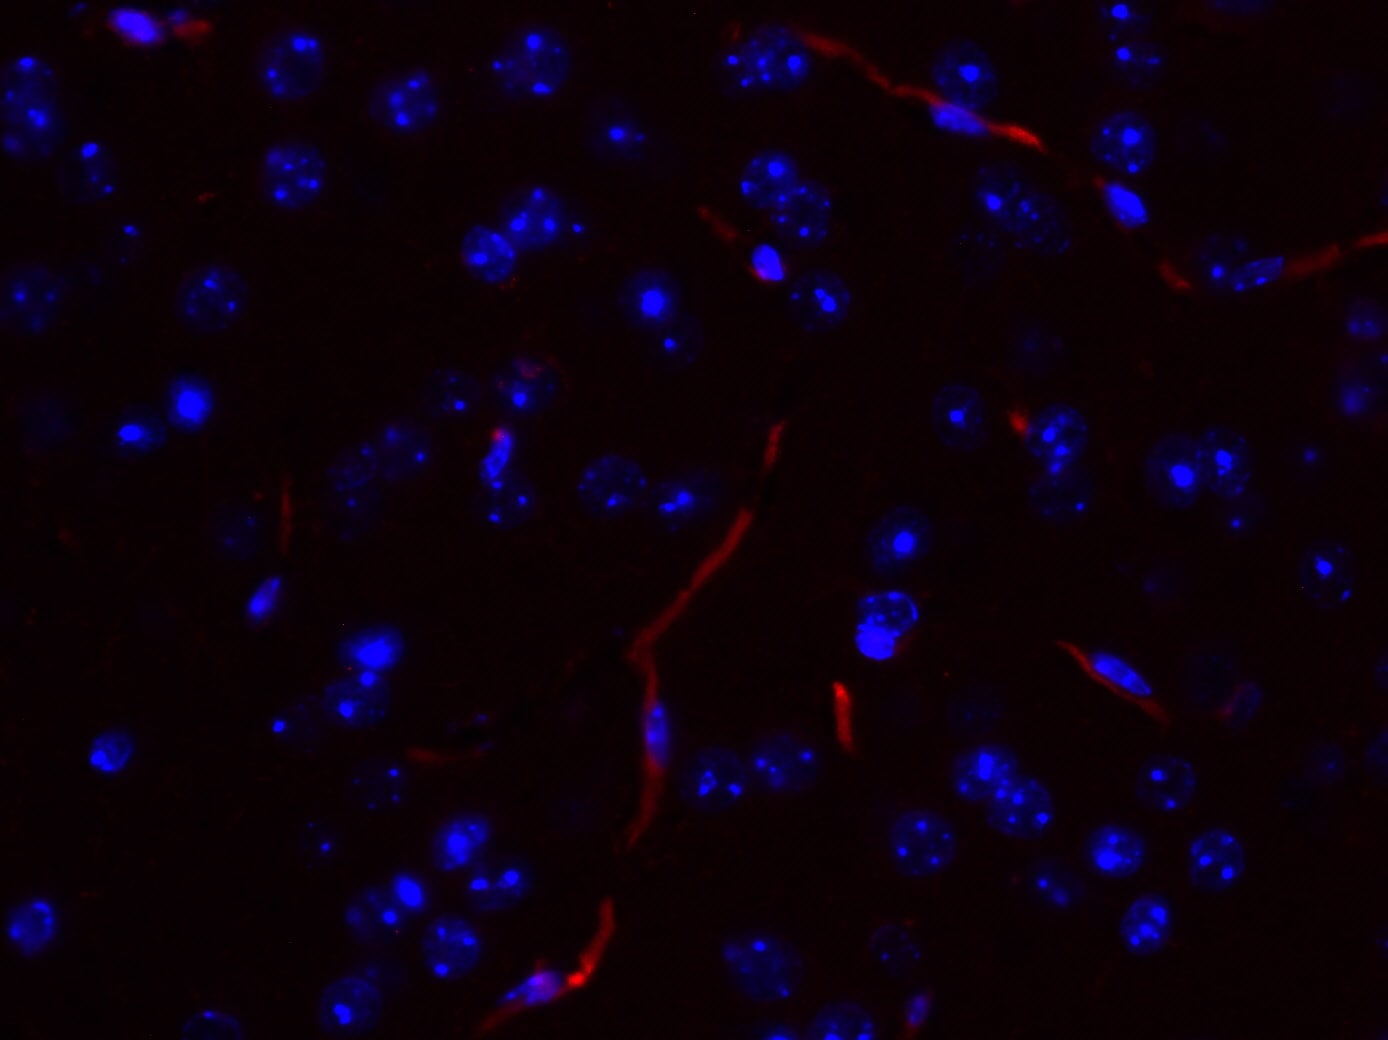
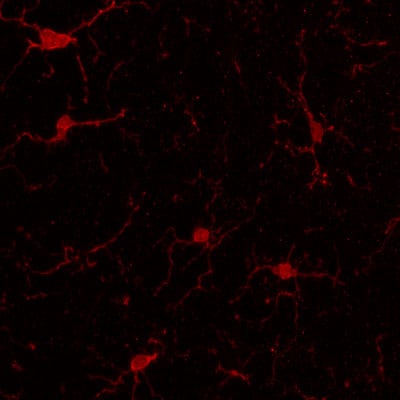
Immunohistochemical Detection of AIF-1/Iba1 in Frozen Feline Optic Nerve Microglia
Feline optic nerve microglia were immunolabeled with AIF-1/Iba1 Antibody (green), DAPI (blue). Imaging was performed using an epifluorescence microscope. IHC-Fr image submitted by a verified customer review.
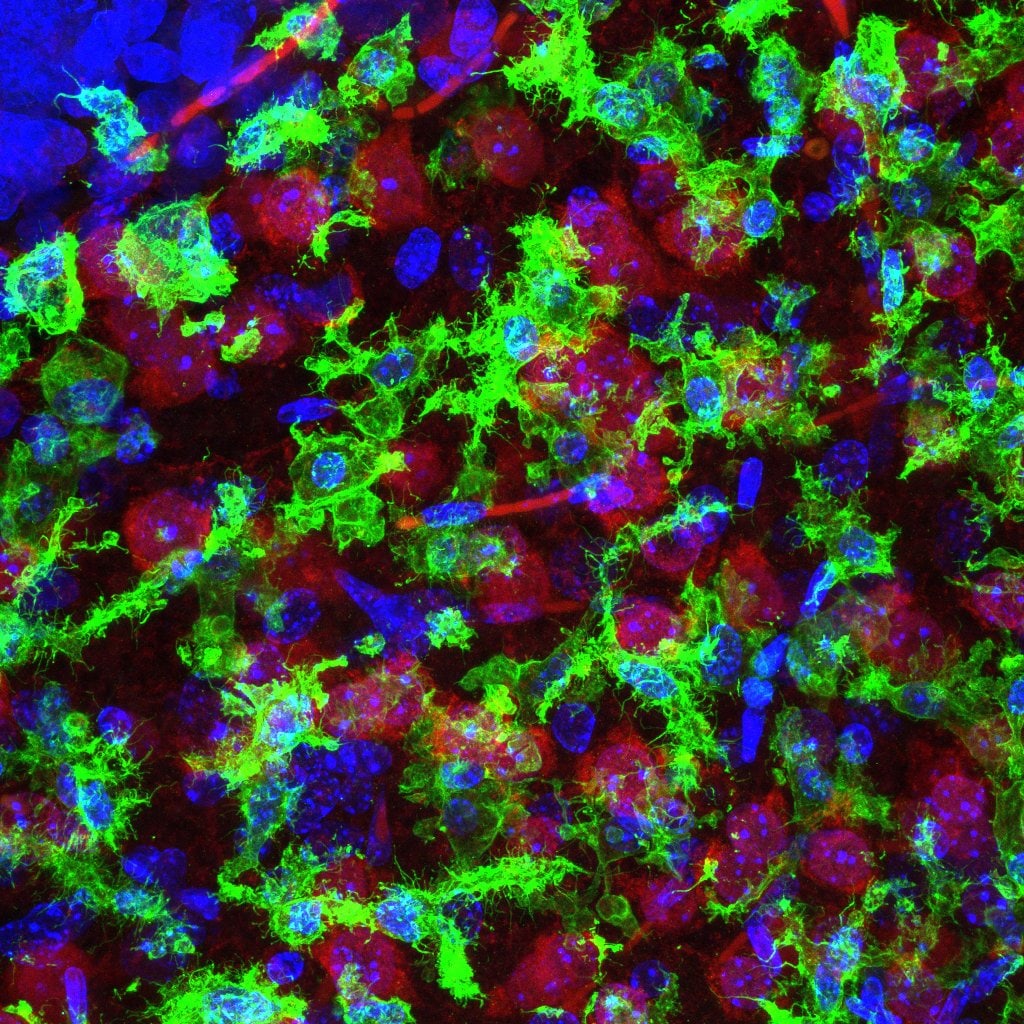
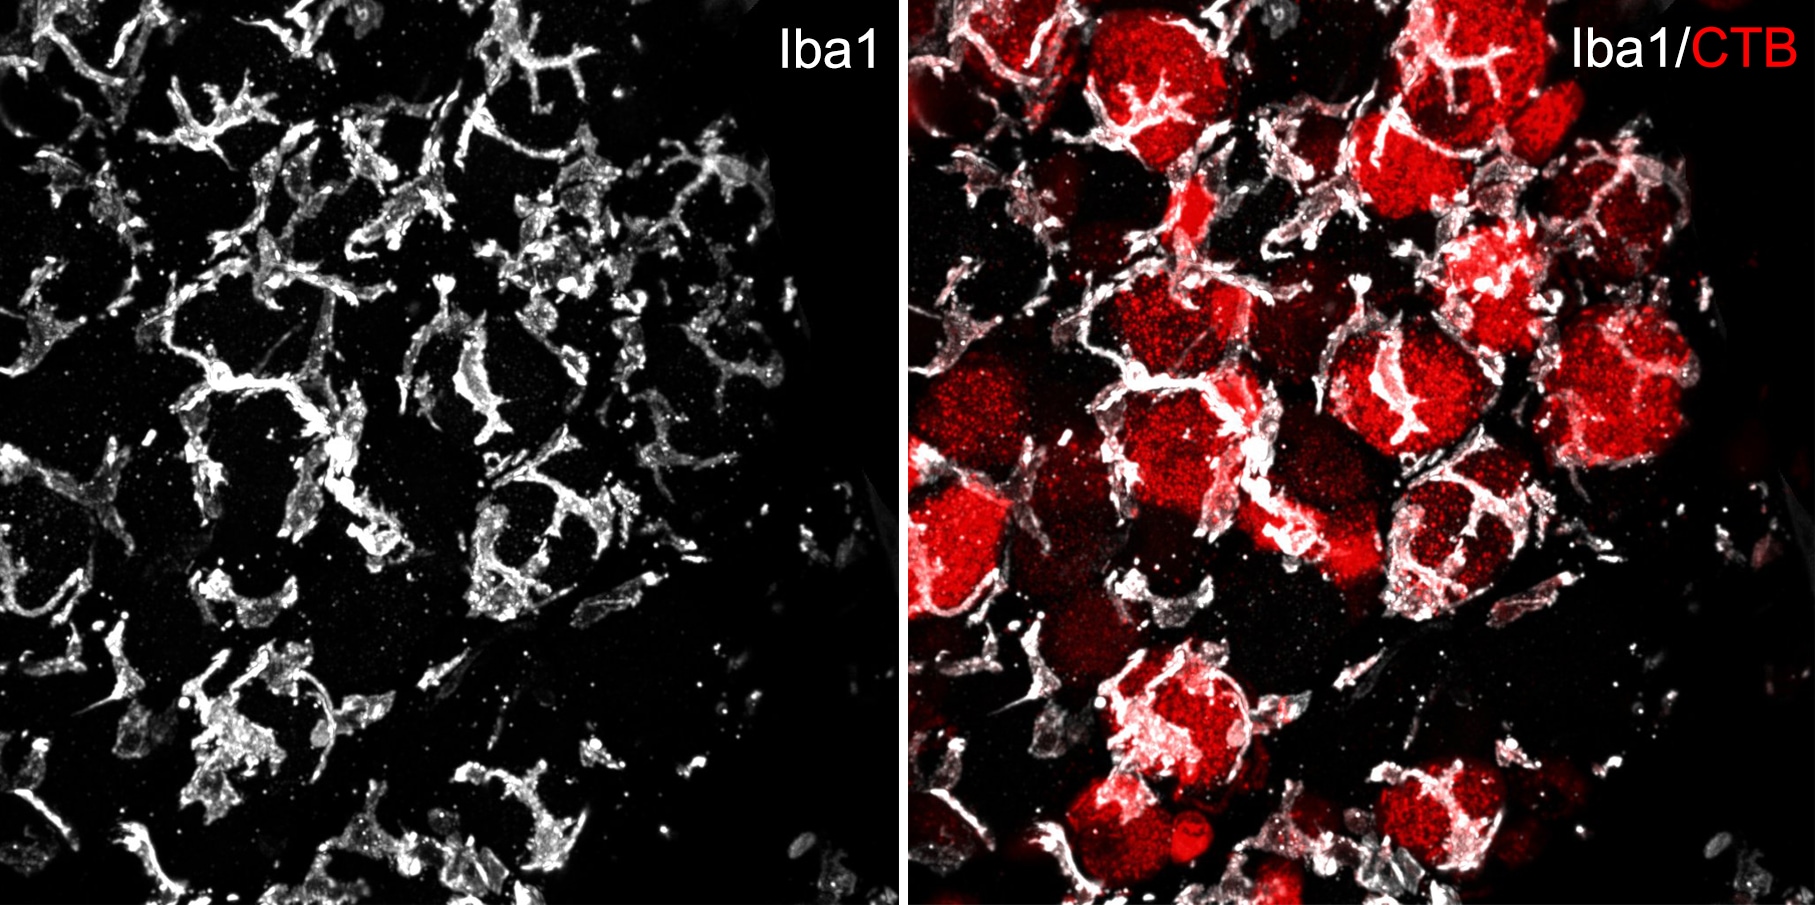
Immunohistochemical Detection of AIF-1/Iba1 in Mouse Dorsal Root Ganglia
Mouse dorsal root ganglia. AIF-1/Iba1 expression in reactive macrophages. Maximum intensity z-projection from 3D images. IHC image submitted by a verified customer review.
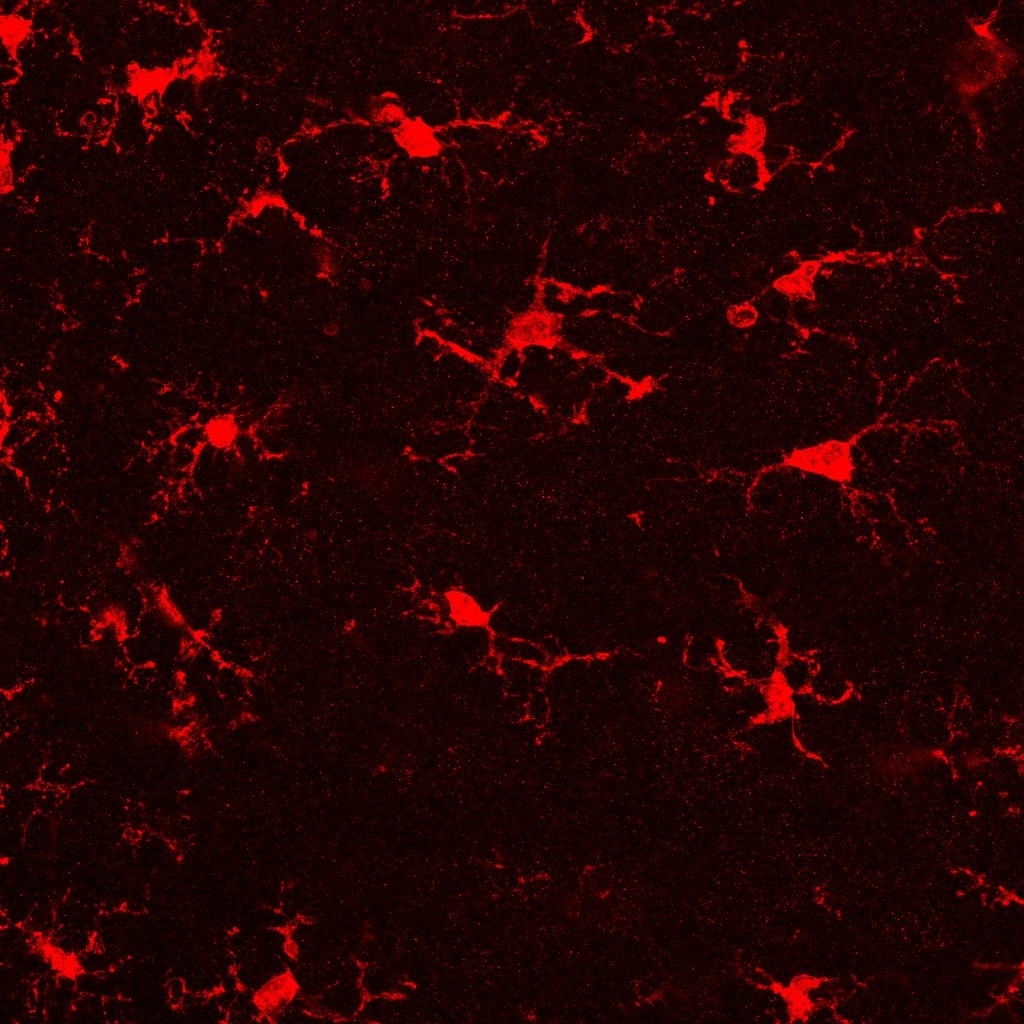
Immunohistochemical Staining of AIF-1/Iba1 in Mouse Brain
Staining in mouse brain using AIF-1/Iba1 Antibody. IHC image submitted by a verified customer review.
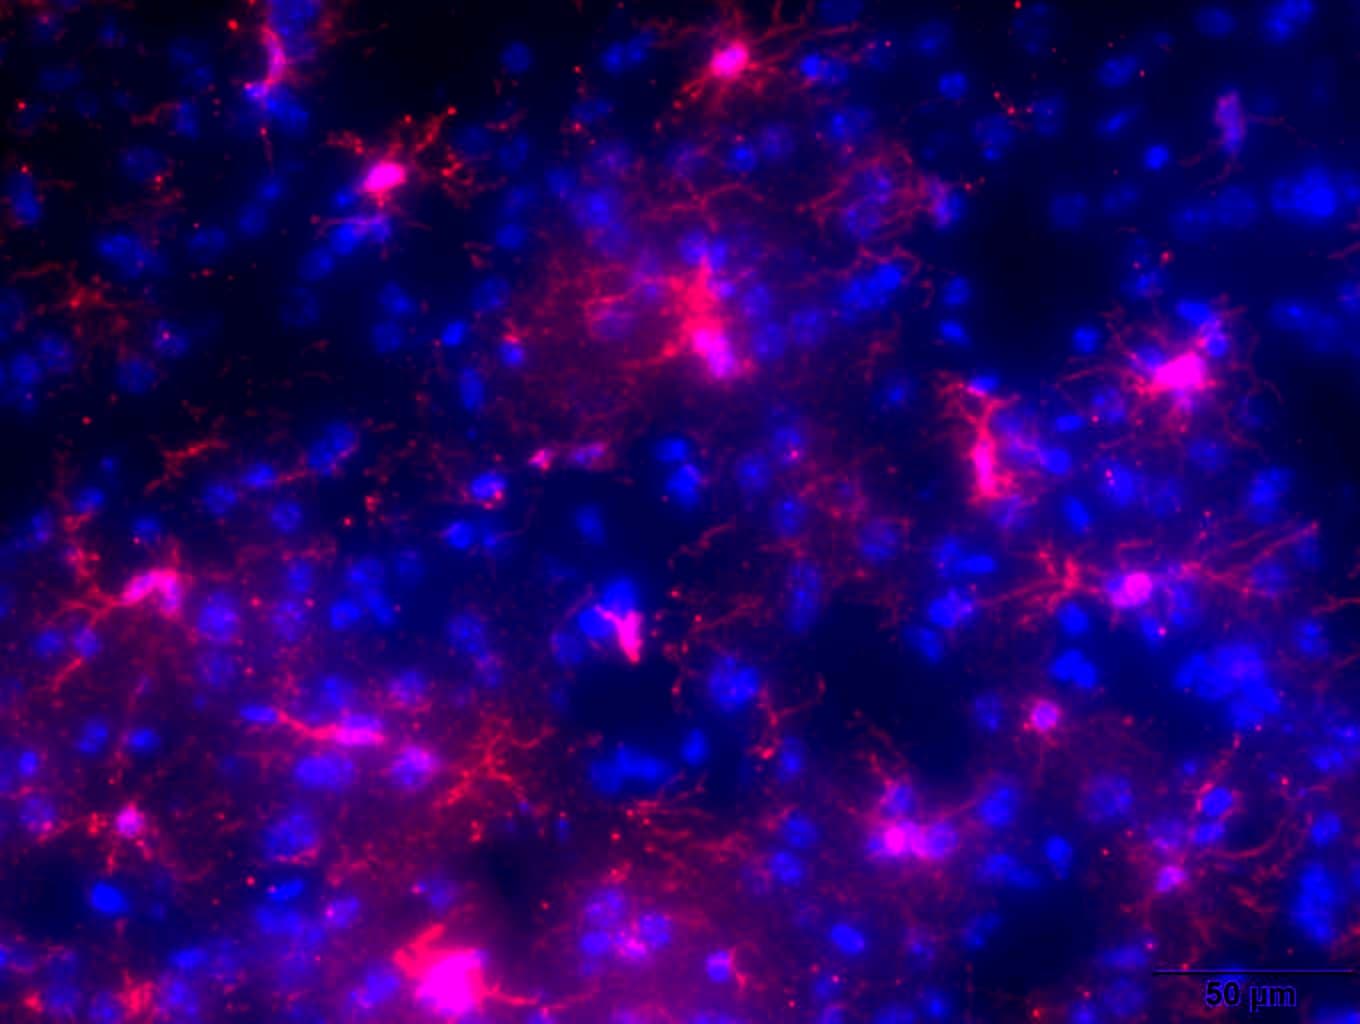
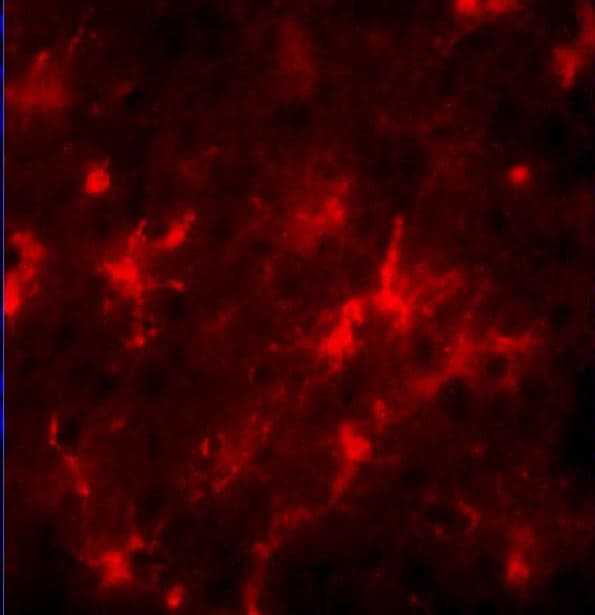
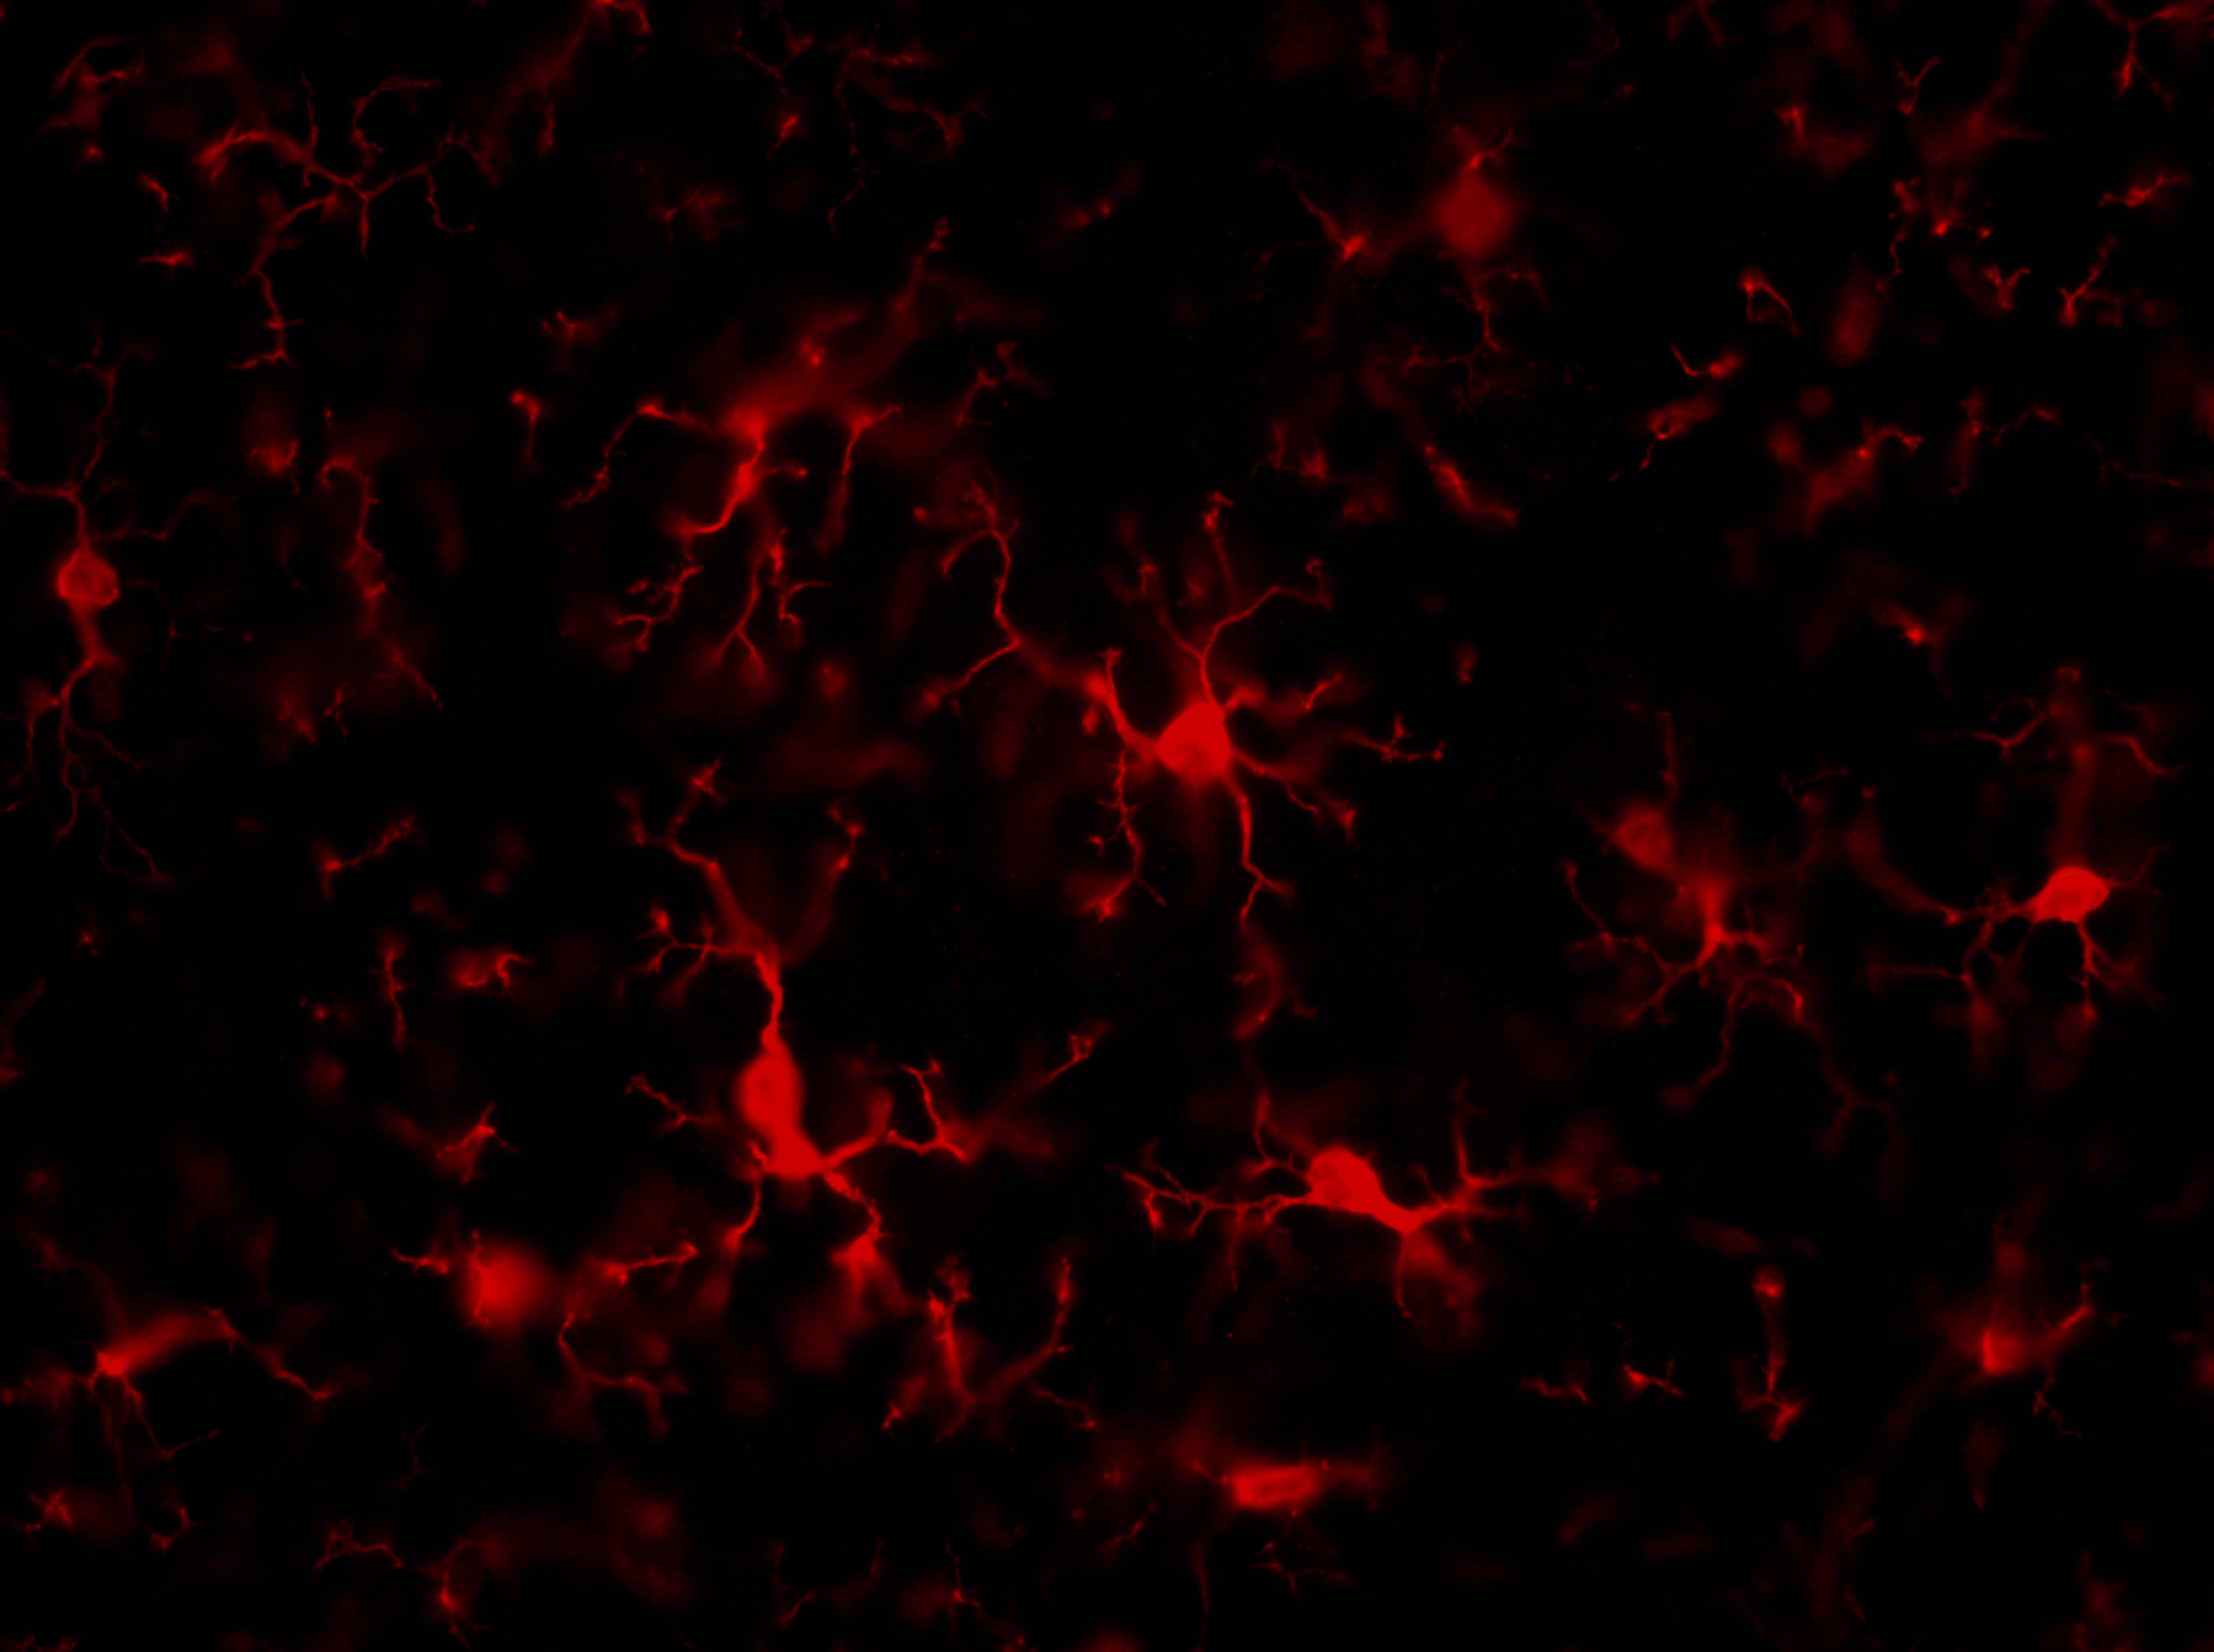
Staining of Frozen LPS Injected Mouse Brain Tissue
Analysis of LPS injected mouse brain tissue, 20 um thickness, frozen. Primary antibody dilution, 1:200. Secondary antibody CY3. Mounted with DAPI mount. Image from verified customer review.
AIF-1/Iba1 Staining in Frozen Mouse Brain Tissue
AIF-1/Iba1 staining of AD mouse model (hippocampus). Image from verified customer review.
Negative Control Staining of Human Spleen Tissue
Negative Control showing staining of paraffin embedded Human Spleen, with no primary antibody.
Western Blot Detection of AIF-1/Iba1 in Mouse Lymph Node Lysate
(0.1ug/ml) staining of Mouse Lymph node lysate (35ug protein in RIPA buffer). Detected by chemiluminescence.
Detection of AIF-1/Iba1 in Multiple Species by Western Blot
(1ug/ml) staining of Human Frontal Cortex (A) and (0.1ug/ml) Mouse (B) and Rat (C) Brain lysate (35ug protein in RIPA buffer). Detected by chemiluminescence.
Immunohistochemical Staining of AIF-1/Iba1 in Paraffin Embedded Human Spleen
(8ug/ml) staining of paraffin embedded Human Spleen. Heat induced antigen retrieval with citrate buffer Ph 6, HRP-staining.
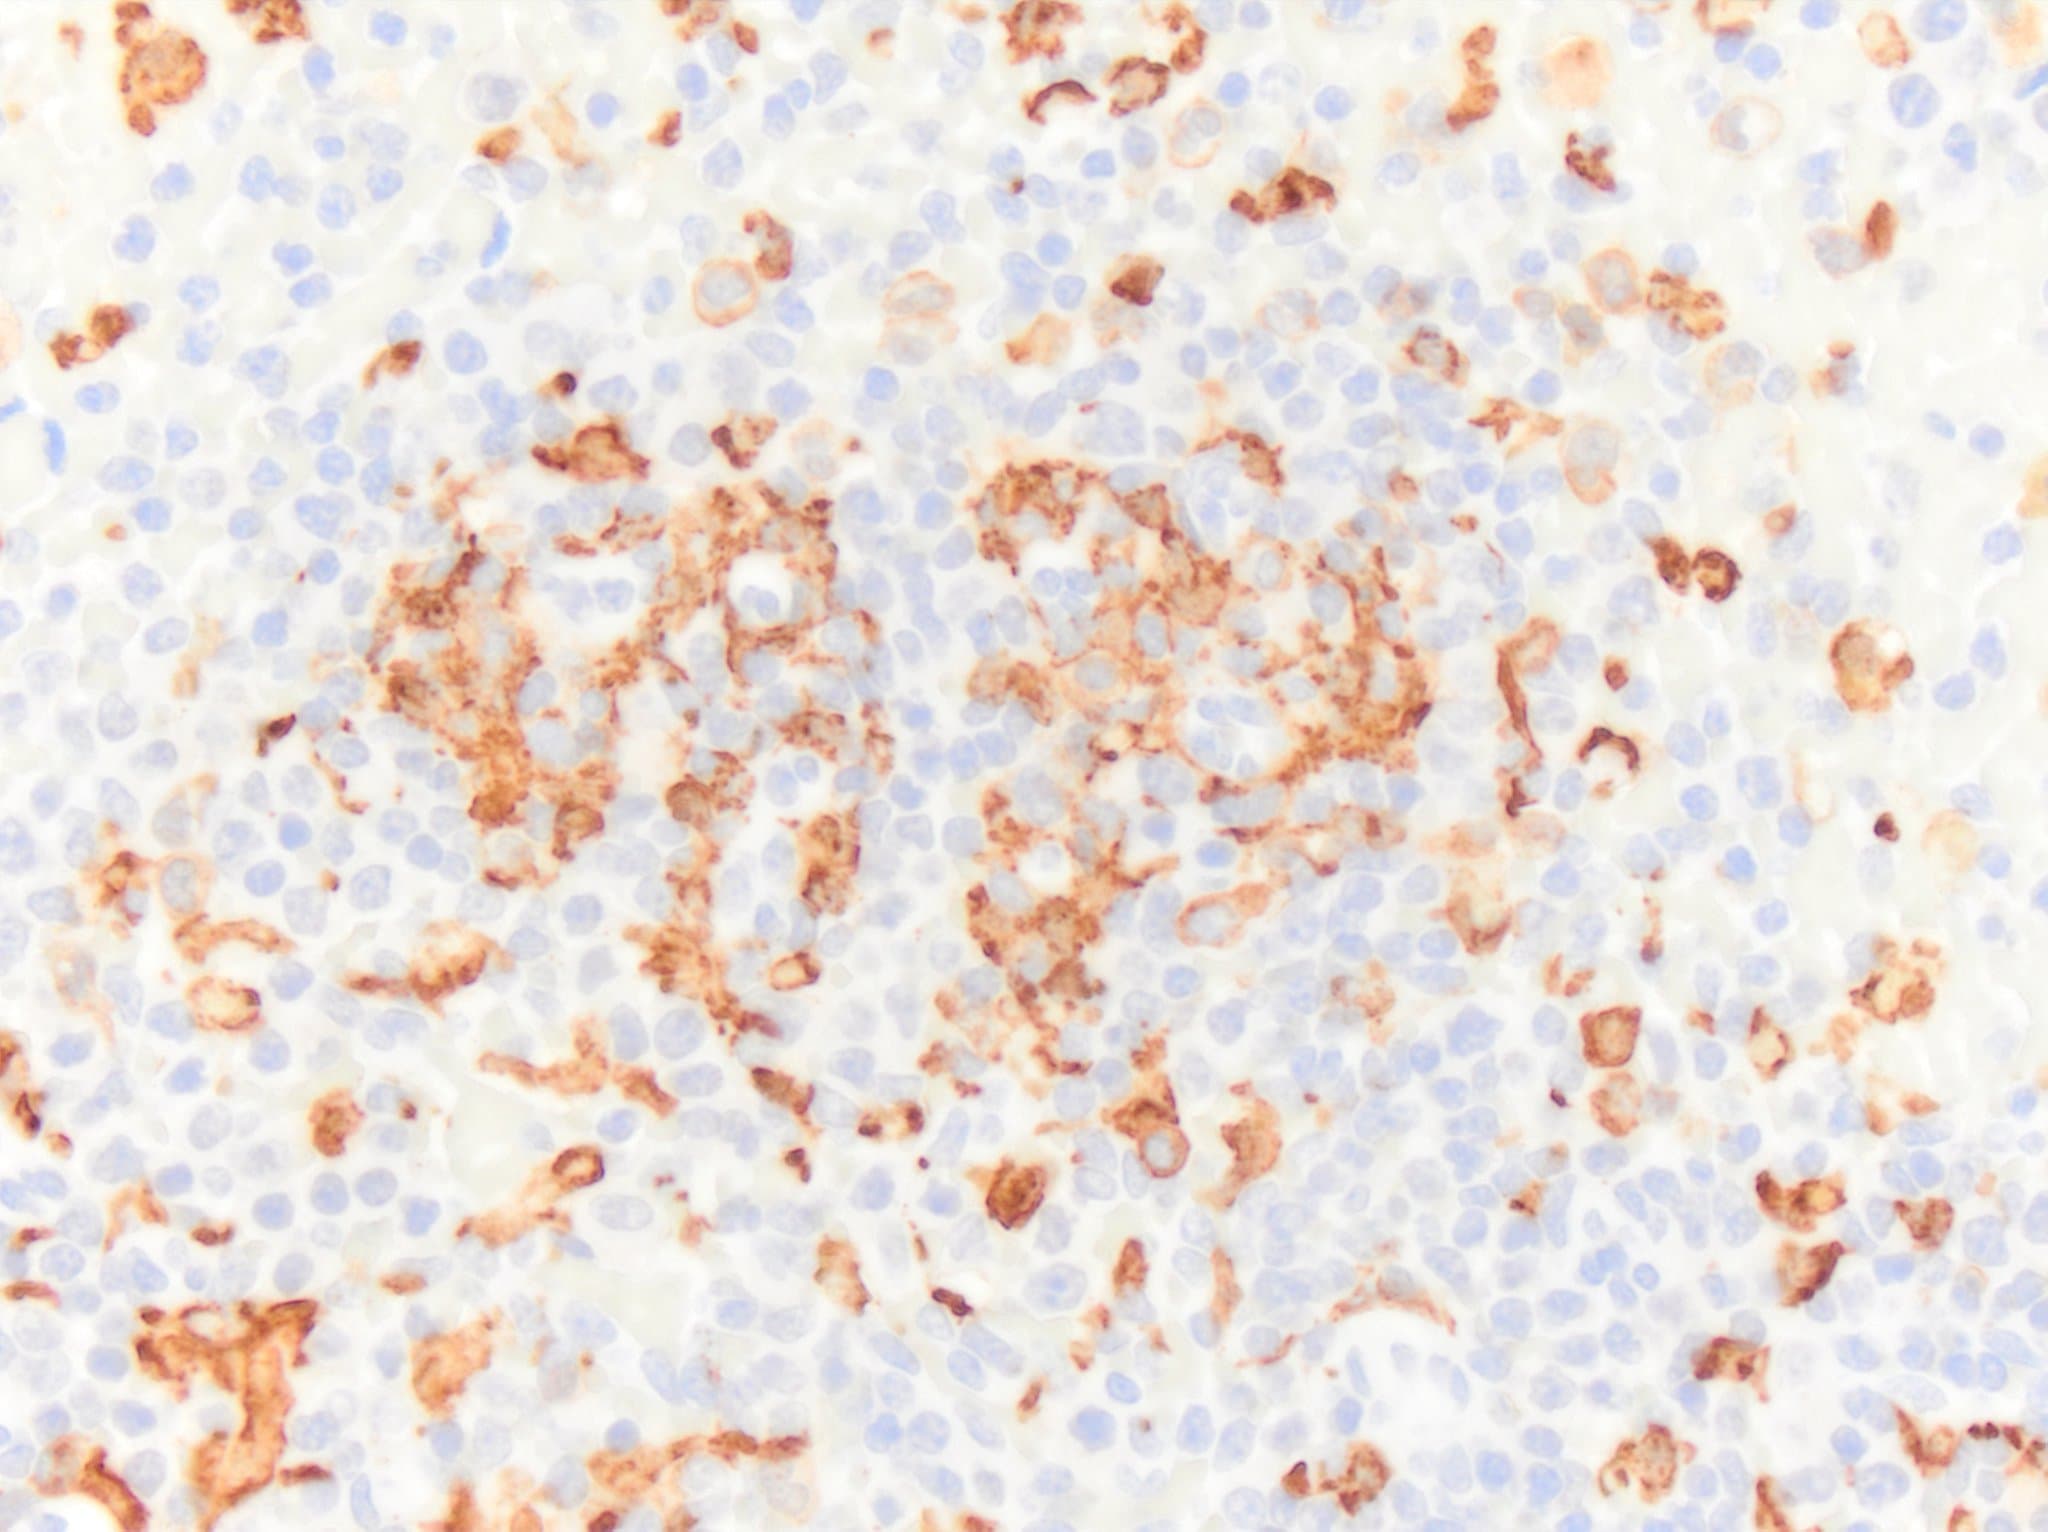
Immunohistochemistry-Paraffin: Goat Polyclonal AIF-1/Iba1 Antibody [NB100-1028] -
Immunohistochemistry-Paraffin: Goat Polyclonal AIF-1/Iba1 Antibody [NB100-1028] - AIF-1/Iba1 immunoreactivity in an FFPE section of mouse spleen. NB100-1028 was diluted to 1ug per mL and was left on tissue sections for 30m at room temperature. Secondary was horse anti goat HRP polymer. Image from a verified customer review.
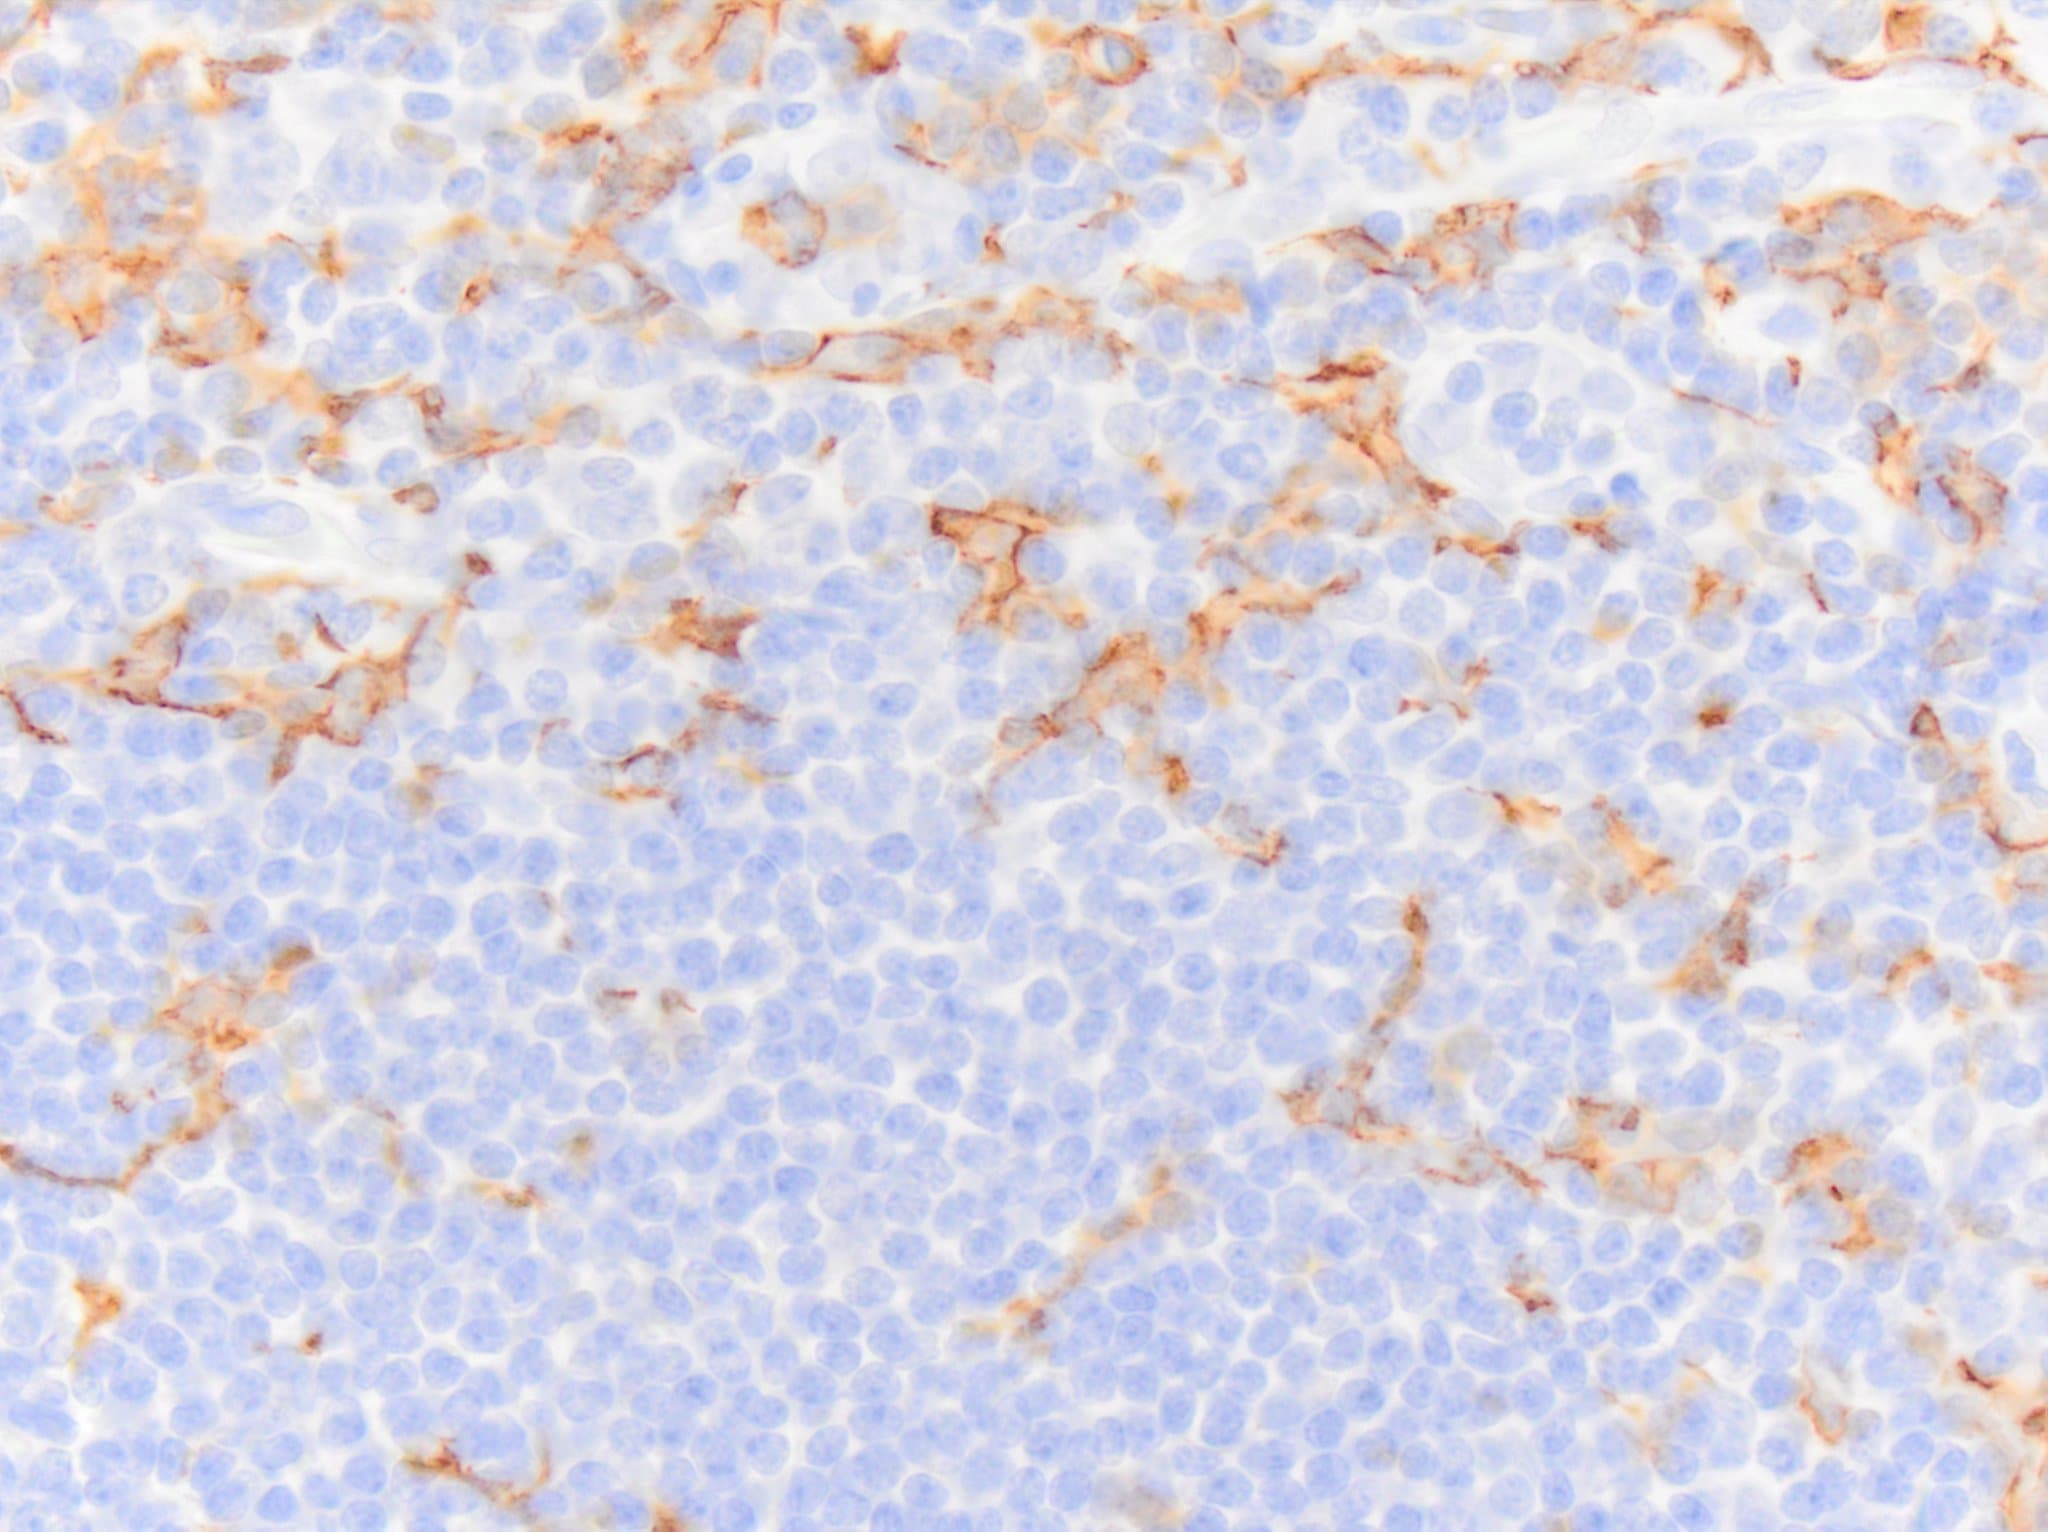
Immunohistochemistry-Paraffin: Goat Polyclonal AIF-1/Iba1 Antibody [NB100-1028] -
Immunohistochemistry-Paraffin: Goat Polyclonal AIF-1/Iba1 Antibody [NB100-1028] - AIF-1/Iba1 immunoreactivity in an FFPE section of human tonsil. NB100-1028 was diluted to 1ug per mL and was left on tissue sections for 30m at room temperature. Secondary was horse anti goat HRP polymer. Image from a verified customer review.
Immunohistochemistry-Paraffin: Goat Polyclonal AIF-1/Iba1 Antibody [NB100-1028] -
Immunohistochemistry-Paraffin: Goat Polyclonal AIF-1/Iba1 Antibody [NB100-1028] - AIF-1/Iba1 immunoreactivity in an FFPE section of equine spleen. NB100-1028 was diluted to 1ug per mL and was left on tissue sections for 30m at room temperature. Secondary was equine anti goat HRP polymer. Image from a verified customer review.
Immunocytochemistry/ Immunofluorescence: AIF-1/Iba1 Antibody [NB100-1028] -
Immunocytochemistry/ Immunofluorescence: AIF-1/Iba1 Antibody [NB100-1028] - Microglia proliferate in non‐APP mice upon peripheral immune challengeA, BIba‐1, Ki67, & DAPI staining in the cortex & hippocampus of wild‐type & Nlrp3−/− (5 & 15 months old). Microglia proliferate upon LPS injection (white arrows). Non‐microglia cells proliferation was observed as well (yellow arrows). Scale bar: 20 μm.CQuantification of microglial proliferation in cortex (left panel) & hippocampus (right panel) (mean of 5 ± SEM; two‐way ANOVA followed by Tukey's post hoc test, *P < 0.05, **P < 0.01, ***P < 0.001). Image collected & cropped by CiteAb from the following publication (https://pubmed.ncbi.nlm.nih.gov/31359456), licensed under a CC-BY license. Not internally tested by Novus Biologicals.
Immunocytochemistry/ Immunofluorescence: AIF-1/Iba1 Antibody [NB100-1028] -
Immunocytochemistry/ Immunofluorescence: AIF-1/Iba1 Antibody [NB100-1028] - Blood–brain barrier is compromised in old APP mice upon LPS injectionIba‐1 (green) & fibrinogen (red) staining in cortex of 5 & 15 months old of wild‐type & Nlrp3−/− mice. Scale bar: 10 μm.Iba‐1 (green) & fibrinogen (red) staining in cortex of 5 & 15 months old of APP & APP/Nlrp3−/− mice. Scale bar: 10 μm.Fibrinogen integrated density in wild‐type & Nlrp3−/− mice (left panel) & APP & APP/Nlrp3−/− mice (right panel) (mean of 5 ± SEM; two‐way ANOVA followed by Tukey's post hoc test, ***P < 0.001). Image collected & cropped by CiteAb from the following publication (https://pubmed.ncbi.nlm.nih.gov/31359456), licensed under a CC-BY license. Not internally tested by Novus Biologicals.
Immunocytochemistry/ Immunofluorescence: AIF-1/Iba1 Antibody [NB100-1028] -
Immunocytochemistry/ Immunofluorescence: AIF-1/Iba1 Antibody [NB100-1028] - OTULIN overexpression reduced the number of Iba-1+ microglial cells in the cortical ischemic penumbra in focal cerebral ischemia/reperfusion rats. A Representative images of Iba-1+ microglial cells that were morphologically classified into three types; scale bar = 10 μm. B Iba-1+ microglial cells in the ischemic penumbra & contralateral cortex of each group were detected by confocal immunofluorescence at 24 h, 72 h, & 7 days; scale bar = 75 μm. C The histogram represents the quantitative analysis of mean Iba-1 immunofluorescence intensity in each group (n = 6). Data are presented as the means ± SEMs; ###P < 0.001 versus the tMCAO group; &&&P < 0.001 versus the tMCAO+LV-Scramble group Image collected & cropped by CiteAb from the following publication (https://pubmed.ncbi.nlm.nih.gov/29544517), licensed under a CC-BY license. Not internally tested by Novus Biologicals.
Immunocytochemistry/ Immunofluorescence: AIF-1/Iba1 Antibody [NB100-1028] -
Immunocytochemistry/ Immunofluorescence: AIF-1/Iba1 Antibody [NB100-1028] - ABIN1 knockdown impairs the antineuroinflammatory effect of EA. (a) The concentrations of TNF-alpha, IL-1 beta, & MCP-1 in the peri-infarct cortex were detected using ELISAs at 24 h after reperfusion (n = 5 rats per group). (b) Microglial morphology was observed by conducting immunofluorescence staining for Iba-1 (green) in the peri-infarct cortex at 24 h after reperfusion (n = 3 rats per group). Scale bar = 50 μm. (c & d) Quantification of microglial endpoints/cell & process length/cell (∗∗P < 0.01 compared to the MCAO/R group; #P < 0.05 & ##P < 0.01 compared to the MCAO/R + EA group). Image collected & cropped by CiteAb from the following publication (https://pubmed.ncbi.nlm.nih.gov/33110436), licensed under a CC-BY license. Not internally tested by Novus Biologicals.
Immunocytochemistry/ Immunofluorescence: AIF-1/Iba1 Antibody [NB100-1028] -
Immunocytochemistry/ Immunofluorescence: AIF-1/Iba1 Antibody [NB100-1028] - a Heatmap of regulated genes related to phagocytosis in the corpus callosum (CC), cerebellum (Cb) & cortex (Cx) at different ages [postnatal day (P)7, 10, 42]. b Heatmap of known priming genes in the CC, Cb & Cx at P7, P10 & P42. Asterisks highlighting genes confirmed on protein level; Representative immunofluorescence pictures of wildtype mice depicting SPP1 [red (c, e)], CLEC7a [white (c, e)] & CD206 [white (d)] expression in IBA-1+ microglia (green) in the CC (c, d), Cx (e left) & Cb (e right) at P7, P10 & P42. Scale bar 50 µm; blue = DAPI; arrow indicating IBA-1+/SPP1+ cell in Cb; N = 3–4 mice per timepoint Image collected & cropped by CiteAb from the following publication (https://pubmed.ncbi.nlm.nih.gov/31262353), licensed under a CC-BY license. Not internally tested by Novus Biologicals.
Immunocytochemistry/ Immunofluorescence: AIF-1/Iba1 Antibody [NB100-1028] -
Immunocytochemistry/ Immunofluorescence: AIF-1/Iba1 Antibody [NB100-1028] - Iba1-positive myeloid cells in the ischemic peri-infarct area express cleaved caspase-8 in a pMCAO mouse model of ischemic stroke. Consecutive frozen tissue sections of the ischemic core & the peri-infarct regions from mice after 48 h of permanent middle cerebral artery occlusion (pMCAO) were analyzed by immunohistochemistry with a mouse specific antibody recognizing active caspase-8 when cleaved at Asp 387, or an Iba1 antibody used to detect myeloid cells (a). Double immunofluorescent staining demonstrated the co-localization of cleaved caspase-8 & the myeloid cell marker Iba1 (b). Scale bars represent 850 μm (a) & 300 μm (b) Image collected & cropped by CiteAb from the following publication (https://pubmed.ncbi.nlm.nih.gov/27566702), licensed under a CC-BY license. Not internally tested by Novus Biologicals.
Immunocytochemistry/ Immunofluorescence: AIF-1/Iba1 Antibody [NB100-1028] -
Immunocytochemistry/ Immunofluorescence: AIF-1/Iba1 Antibody [NB100-1028] - Microglia proliferate in APP/PS1 mice upon peripheral immune challengeA, BIba‐1, Ki67, & MXO4 staining in the cortex & hippocampus of APP & APP/Nlrp3−/− (5 & 15 months old). Microglia proliferate upon LPS injection (white arrows). Non‐microglia cells proliferation was observed as well (yellow arrows). Scale bar: 20 μm.CQuantification of microglial proliferation in cortex (left panel) & hippocampus (right panel) (mean of 5 ± SEM; two‐way ANOVA followed by Tukey's post hoc test, *P < 0.05, **P < 0.01, ***P < 0.001). Image collected & cropped by CiteAb from the following publication (https://pubmed.ncbi.nlm.nih.gov/31359456), licensed under a CC-BY license. Not internally tested by Novus Biologicals.
Immunohistochemistry: AIF-1/Iba1 Antibody [NB100-1028] -
Immunohistochemistry: AIF-1/Iba1 Antibody [NB100-1028] - Iba1-positive myeloid cells in the ischemic peri-infarct area express cleaved caspase-8 in a pMCAO mouse model of ischemic stroke. Consecutive frozen tissue sections of the ischemic core & the peri-infarct regions from mice after 48 h of permanent middle cerebral artery occlusion (pMCAO) were analyzed by immunohistochemistry with a mouse specific antibody recognizing active caspase-8 when cleaved at Asp 387, or an Iba1 antibody used to detect myeloid cells (a). Double immunofluorescent staining demonstrated the co-localization of cleaved caspase-8 & the myeloid cell marker Iba1 (b). Scale bars represent 850 μm (a) & 300 μm (b) Image collected & cropped by CiteAb from the following publication (https://pubmed.ncbi.nlm.nih.gov/27566702), licensed under a CC-BY license. Not internally tested by Novus Biologicals.
Immunohistochemistry: AIF-1/Iba1 Antibody [NB100-1028] -
Immunohistochemistry: AIF-1/Iba1 Antibody [NB100-1028] - Microglia infiltrate 3×Tg-AD mice brains in a perivascular fashion. Representative hippocampal bright-field × 40 micrographs with × 100 insets. Perivascular infiltration with CD-68+ cells of control (A) & norvaline-treated mice (B) hippocampi. Iba1+ microglia in control (C) & norvaline-treated (D) mice. Measurement of the CD-68 immunopositive surface area (E) & stain intensity (F) with ZEN 2.5 revealed a significant effect of the treatment. (G) The relative intensity of perivascular Iba1+ microglia. Student’s unpaired t-test, n = 20, * p < 0.05. Image collected & cropped by CiteAb from the following publication (https://pubmed.ncbi.nlm.nih.gov/31540372), licensed under a CC-BY license. Not internally tested by Novus Biologicals.
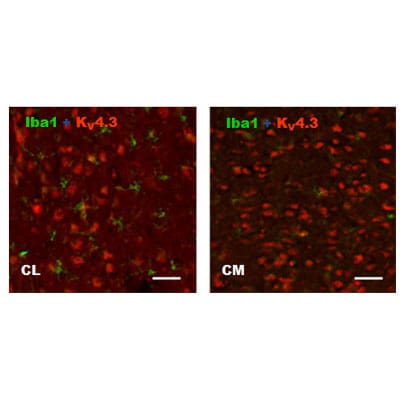
Immunocytochemistry/ Immunofluorescence: AIF-1/Iba1 Antibody [NB100-1028] -
Immunocytochemistry/ Immunofluorescence: AIF-1/Iba1 Antibody [NB100-1028] - OTULIN overexpression reduced the number of Iba-1+ microglial cells in the cortical ischemic penumbra in focal cerebral ischemia/reperfusion rats. A Representative images of Iba-1+ microglial cells that were morphologically classified into three types; scale bar = 10 μm. B Iba-1+ microglial cells in the ischemic penumbra & contralateral cortex of each group were detected by confocal immunofluorescence at 24 h, 72 h, & 7 days; scale bar = 75 μm. C The histogram represents the quantitative analysis of mean Iba-1 immunofluorescence intensity in each group (n = 6). Data are presented as the means ± SEMs; ###P < 0.001 versus the tMCAO group; &&&P < 0.001 versus the tMCAO+LV-Scramble group Image collected & cropped by CiteAb from the following publication (https://pubmed.ncbi.nlm.nih.gov/29544517), licensed under a CC-BY license. Not internally tested by Novus Biologicals.
Immunocytochemistry/ Immunofluorescence: AIF-1/Iba1 Antibody [NB100-1028] -
Immunocytochemistry/ Immunofluorescence: AIF-1/Iba1 Antibody [NB100-1028] - OTULIN overexpression decreased LPS-induced microglial activation. Pure brain inflammation without neuronal death was induced by IP injection of LPS, & tissues were collected 24 h later. B The mean Iba-1 immunofluorescence intensities in the A LPS(−) group (a), the LPS(+) group (b), the LPS(+)+LV-Scramble group (c), & the LPS (+)+LV-OTULIN group (d) were quantitatively analyzed (n = 6); scale bar = 75 μm. All data are presented as the means ± SEMs; ##P < 0.01 versus the LPS(+) group; &P < 0.05 versus the LPS(+)+LV-Scramble group Image collected & cropped by CiteAb from the following publication (https://pubmed.ncbi.nlm.nih.gov/29544517), licensed under a CC-BY license. Not internally tested by Novus Biologicals.
Immunocytochemistry/ Immunofluorescence: AIF-1/Iba1 Antibody [NB100-1028] -
Immunocytochemistry/ Immunofluorescence: AIF-1/Iba1 Antibody [NB100-1028] - a Heatmap of regulated genes related to phagocytosis in the corpus callosum (CC), cerebellum (Cb) & cortex (Cx) at different ages [postnatal day (P)7, 10, 42]. b Heatmap of known priming genes in the CC, Cb & Cx at P7, P10 & P42. Asterisks highlighting genes confirmed on protein level; Representative immunofluorescence pictures of wildtype mice depicting SPP1 [red (c, e)], CLEC7a [white (c, e)] & CD206 [white (d)] expression in IBA-1+ microglia (green) in the CC (c, d), Cx (e left) & Cb (e right) at P7, P10 & P42. Scale bar 50 µm; blue = DAPI; arrow indicating IBA-1+/SPP1+ cell in Cb; N = 3–4 mice per timepoint Image collected & cropped by CiteAb from the following publication (https://pubmed.ncbi.nlm.nih.gov/31262353), licensed under a CC-BY license. Not internally tested by Novus Biologicals.
Immunocytochemistry/ Immunofluorescence: AIF-1/Iba1 Antibody [NB100-1028] -
Immunocytochemistry/ Immunofluorescence: AIF-1/Iba1 Antibody [NB100-1028] - Norgestrel significantly abrogates rd10 microglial-induced 661W cell death. (B) Representative fluorescent microscopic image of primary rd10 microglial cells (Iba1; red) in culture with 661W cells (Cone arrestin; green). Hoechst (blue) staining reveals cell nuclei. Scale bar 30μm. Image collected & cropped by CiteAb from the following publication (https://dx.plos.org/10.1371/journal.pone.0165197), licensed under a CC-BY license. Not internally tested by Novus Biologicals.
Immunocytochemistry/ Immunofluorescence: AIF-1/Iba1 Antibody [NB100-1028] -
Immunocytochemistry/ Immunofluorescence: AIF-1/Iba1 Antibody [NB100-1028] - a Heatmap of regulated genes related to phagocytosis in the corpus callosum (CC), cerebellum (Cb) & cortex (Cx) at different ages [postnatal day (P)7, 10, 42]. b Heatmap of known priming genes in the CC, Cb & Cx at P7, P10 & P42. Asterisks highlighting genes confirmed on protein level; Representative immunofluorescence pictures of wildtype mice depicting SPP1 [red (c, e)], CLEC7a [white (c, e)] & CD206 [white (d)] expression in IBA-1+ microglia (green) in the CC (c, d), Cx (e left) & Cb (e right) at P7, P10 & P42. Scale bar 50 µm; blue = DAPI; arrow indicating IBA-1+/SPP1+ cell in Cb; N = 3–4 mice per timepoint Image collected & cropped by CiteAb from the following publication (https://pubmed.ncbi.nlm.nih.gov/31262353), licensed under a CC-BY license. Not internally tested by Novus Biologicals.
Immunohistochemistry: AIF-1/Iba1 Antibody [NB100-1028] -
Immunohistochemistry: AIF-1/Iba1 Antibody [NB100-1028] - CXCR2+neutrophils are not required for microglial activation. a Representative images of Iba1 immunohistochemistry staining in lumbar spinal cord ventral horns of naïve control, control EAE, & Cxcr2 cKO EAE mice. Quantitative analysis of Iba1+ cell (b) soma area as shown in a. A total of 2338 Iba1+ cells were included in our analyses of soma size (cont naive, 222 Iba1 cells; control EAE, 1236 Iba1+ cells; Cxcr2 cKO EAE, 880 Iba1+ cells). Control naïve, n = 3; control EAE, n = 3; Cxcr2 cKO EAE, n = 3. *p < 0.05, two-tailed unpaired Student’s t test Image collected & cropped by CiteAb from the following publication (https://pubmed.ncbi.nlm.nih.gov/32019585), licensed under a CC-BY license. Not internally tested by Novus Biologicals.
Immunocytochemistry/ Immunofluorescence: AIF-1/Iba1 Antibody [NB100-1028] -
Immunocytochemistry/ Immunofluorescence: AIF-1/Iba1 Antibody [NB100-1028] - Antibody-based neutralization of Nogo-A mitigates inflammation in the injured retina.a, b Retinal gene expression analysis by qRT-PCR at 3 & 7 days after NMDA injection (0.5 nmol) & antibody treatments (2 μg/eye). Four-six mice were used per condition. 11C7 reduced the expression of major genes involved in inflammation & monocyte activation (*P < 0.05; **P < 0.01; unpaired t-test). In particular, 11C7 injection led to sustained decrease of Tnf transcript & Sprr1a mRNA, the expression of which reflects the severity of neuronal injury response. c The level of TNF alpha trimers was studied by Western Blotting the day after antibody injection. Compared with control IgG (n = 3 mice), 11C7 injections (n = 4 mice) significantly decreased the content of TNF alpha in the vitreous of injured eyes (**P < 0.01, Unpaired t-test). d TNF alpha was mainly observed in Iba1-expressing monocytes by immunofluorescence on retinal flat-mounts. Its signal was much weaker with 11C7 than in control mice. Immunofluorescent staining observations were repeated in three different mice for each antibody treatment. Scale bar in d = 100 μm. Image collected & cropped by CiteAb from the following publication (https://pubmed.ncbi.nlm.nih.gov/32029703), licensed under a CC-BY license. Not internally tested by Novus Biologicals.
Immunocytochemistry/ Immunofluorescence: AIF-1/Iba1 Antibody [NB100-1028] -
Immunocytochemistry/ Immunofluorescence: AIF-1/Iba1 Antibody [NB100-1028] - A20 silencing prevents the anti-inflammatory effects of EA after focal cerebral ischemia reperfusion. Experiments were performed 24 h after reperfusion in the ischemia/reperfusion cortex, n = 5 per group. a TNF-alpha & b IL-1 beta content was measured using ELISA. $$$P < 0.001 vs. the sham group; *P < 0.05, ***P < 0.001 vs. the MCAO group; ###P < 0.001 vs. the MCAO + EA group. The relative mRNA levels of cA1 & dGFAP were measured using RT-qPCR. $$$P < 0.001 vs. the sham group; ***P < 0.001, *P < 0.05 vs. the MCAO group; ###P < 0.001 vs. the MCAO + EA group. The activated morphology of astrocytes & microglia was demonstrated using e GFAP & f Iba-1 immunofluorescence staining (green), respectively. Yellow arrows indicate reactive astrocytes with thick cell bodies, & red arrows indicate hypertrophied activated microglia, noted by their stout, dense appearance with shorter & thicker branched projections. Scale bar = 50 μm Image collected & cropped by CiteAb from the following publication (http://jneuroinflammation.biomedcentral.com/articles/10.1186/s12974-016…), licensed under a CC-BY license. Not internally tested by Novus Biologicals.
Immunocytochemistry/ Immunofluorescence: AIF-1/Iba1 Antibody [NB100-1028] -
Immunocytochemistry/ Immunofluorescence: AIF-1/Iba1 Antibody [NB100-1028] - Norgestrel dampens pro-inflammatory microglial activity in vivo & decreases DAMP release from photoreceptors.(A) Confocal microscopic images of microglia (Iba1; red) & activated microglia (CD68; green) in the central retina from P15-P25 control & Norgestrel-fed rd10 mice. Less microglia including CD68+ microglia were observed at P15 & P20 in Norgestrel-fed mice. Hoechst (blue) staining reveals the cell layers in the retina. Scale bar 50μm. N = 3 mice per group, n = 8 sections per mouse. (B & C) Quantification of microglial number & CD68-positivity confirmed (B) significantly less microglia at P15 & P20 & (C) significantly less CD68-positivity at P20 with Norgestrel-supplementation. (D) RT-qPCR analysis of mRNA encoding (i) pro-inflammatory (M1) & (ii) & (iii) anti-inflammatory (M2) microglial markers in whole retina from P20-P30 control & Norgestrel-fed rd10 mice. Norgestrel significantly reduced pro-inflammatory & increased anti-inflammatory markers in the retina. Control column represents age-matched rd10 mice on control diet. N = 3 mice per group, n = 3 technical replicates per mouse. (E) RT-qPCR analysis of mRNA encoding danger associated molecular patterns (DAMP), (i) high motility box group 1 (HMGB1) & (ii) interleukin-1 alpha (IL-1 alpha ) in whole retina from P20-P30 control & Norgestrel-fed rd10 mice. Norgestrel significantly reduced DAMP expression at P20 & P25 in Norgestrel-fed mice. Control column represents age-matched rd10 mice on control diet. N = 3 mice per group, n = 3 technical replicates per mouse. Results are presented as mean ± SEM (t-test, *p<0.05, ***p<0.005, ****p<0.0001). Image collected & cropped by CiteAb from the following publication (https://dx.plos.org/10.1371/journal.pone.0165197), licensed under a CC-BY license. Not internally tested by Novus Biologicals.
Immunocytochemistry/ Immunofluorescence: AIF-1/Iba1 Antibody [NB100-1028] -
Immunocytochemistry/ Immunofluorescence: AIF-1/Iba1 Antibody [NB100-1028] - Representative & quantitative immunohistochemistry of the peri-infarct cortex before the bregma (coordinate + 0.58) in normal WT, normal sEH KO, MCAO WT, MCAO sEH KO, MCAO with vehicle treatment & MCAO with AUDA treatment mice (n = 2 for normal groups, n = 5–6 for all groups subjected to MCAO). (A–F, S) The number of CD31-positive endothelial cells significantly increased in the sEH KO before & after MCAO & post-MCAO AUDA-treated mice, while (G–L) Note the increased phosphorylated TrkB (p-TrkB) immunoreactivity that partially co-localized with NeuN-positive neurons, particularly in the sEH KO & AUDA-treated mice (arrows) (T). The percentage of NeuN- & p-TrkB-positive double labeling in the neuronal population was significantly increased compared to that in the corresponding controls. (M–R, U–V) GFAP-positive astrogliosis & Iba1-positive microglial infiltration decreased in post-MCAO sEH KO & AUDA treatment groups relative to that in the corresponding controls. The scale bar represents 50 µm. *p < 0.05, **p < 0.01, ***p < 0.001. Image collected & cropped by CiteAb from the following publication (https://pubmed.ncbi.nlm.nih.gov/29311641), licensed under a CC-BY license. Not internally tested by Novus Biologicals.
Immunocytochemistry/ Immunofluorescence: AIF-1/Iba1 Antibody [NB100-1028] -
Immunocytochemistry/ Immunofluorescence: AIF-1/Iba1 Antibody [NB100-1028] - SCF+G-CSF treatment increases the association of Iba1+ microglia/macrophages with senile plaques & enhances uptake of 4G8+ A beta by the Iba1+ microglia/macrophages in the brains of aged APP/PS1 mice. (A) Representative confocal images illustrate the association of Iba1+ cells (green) with 4G8+ A beta plaques (red) in the brains of aged APP/PS1 mice. Blue: Nuclear counterstaining by DAPI. (B) Quantification of the percentage of Iba1+ area in/surrounding the 4G8+ A beta plaques in the brains of aged APP/PS1 mice with or without SCF+G-CSF treatment. (C) Representative 3-dimensional projected images reveal the overlapped (yellow) Iba1+ cells (green) with 4G8+ A beta (red) in the brains of aged APP/PS1 mice. The white arrows indicate the co-expression (yellow) of 4G8+ A beta & Iba1+ cells in the brains of aged APP/PS1 mice. (D & E) Representative orthographic view of z-stack images (12 z-stacks with 1μm intervals) shows the co-expression (yellow) of 4G8+ A beta (red) & Iba1+ cells (green) in the brains of aged APP/PS1 mice. (F) Quantification data present the percentage of 4G8+ A beta volume within the Iba1+ cells in the brains of aged APP/PS1 mice treated with or without SCF+G-CSF. N=4-5. Mean ± SEM. *p<0.05 by Student’s t-test. Image collected & cropped by CiteAb from the following publication (https://pubmed.ncbi.nlm.nih.gov/33269098), licensed under a CC-BY license. Not internally tested by Novus Biologicals.
Immunocytochemistry/ Immunofluorescence: AIF-1/Iba1 Antibody [NB100-1028] -
Immunocytochemistry/ Immunofluorescence: AIF-1/Iba1 Antibody [NB100-1028] - The spatial distribution & cell-type location of A20 in the rat brain after I/R. Brain sections of the ischemia/reperfusion cortex of rats in the MCAO + EA group 24 h after reperfusion. Sections were stained with double immunofluorescence labeling (a–d), which showed the upregulated expression of A20 protein (red) in neurons (green, identified using NeuN). e–h Very few of A20-positive (red) astrocytes (green, identified using GFAP) were observed. i–l A20 (red) was barely presented in microglial cells (green, identified using iba-I). Scale bar = 50 μm. 1–3 were the magnified parts from the merged images of d, h, l which more clearly showed the location relationship between A20 & neurons, astrocytes, & microglia, respectively. Scale bar = 25 μm Image collected & cropped by CiteAb from the following publication (http://jneuroinflammation.biomedcentral.com/articles/10.1186/s12974-016…), licensed under a CC-BY license. Not internally tested by Novus Biologicals.
Immunocytochemistry/ Immunofluorescence: AIF-1/Iba1 Antibody [NB100-1028] -
Immunocytochemistry/ Immunofluorescence: AIF-1/Iba1 Antibody [NB100-1028] - Increased perivascular microglia in rTg-DI rats. a–l Brain sections from 3-month-old wild-type (a–c) & rTg-DI (d–f) rats & 12-month wild-type (g–i) & rTg-DI (j–l) rats were labeled with Amylo-Glo to detect fibrillar amyloid (blue), rabbit polyclonal antibody to collagen IV to detect cerebral microvessels (red), & goat polyclonal antibody to Iba-1 to identify microglia (green). Scale bars = 50 μm. m, n Enlarged images of the highlighted regions of panels g & j, respectively. Scale bars = 10 μm. o Quantitation of microglia numbers from wild-type rats (black bars) & rTg-DI rats (gray bars) in different brain regions at 3 & 12 months of age. Data shown are mean ± SD of n = 5–6 rats per group. Compared to wild-type rats the microglia numbers were markedly elevated in rTg-DI rats & increased from 3 to 12 months of age in the measured brain regions. *P < 0.02, **P < 0.01, ***P < 0.001 Image collected & cropped by CiteAb from the following publication (https://pubmed.ncbi.nlm.nih.gov/32127016), licensed under a CC-BY license. Not internally tested by Novus Biologicals.
Immunocytochemistry/ Immunofluorescence: AIF-1/Iba1 Antibody [NB100-1028] -
Immunocytochemistry/ Immunofluorescence: AIF-1/Iba1 Antibody [NB100-1028] - Temporal activation of caspase-8 in Iba1-positive myeloid cells. Frozen tissue sections from mice upon pMCAO (n = 9) were analyzed by immunohistochemistry for expression of active caspase-8 or for expression of the microglia/macrophage marker Iba1. The contralateral side to the ischemic area was used an internal control for each animal. A small increase in body size of Iba1 positive cells was detected in the peri-infarct area at 6 h, with larger increase in cell body & numbers of cells expressing Iba1 detected at 24 & 48 h post occlusion (a). Cleaved caspase-8 was detected at low levels at 6 h, but a significant increase in expression levels was observed at 24 & 48 h in the peri-infarct area, but not at the contralateral side (a). Double immunofluorescent staining revealed that increased active caspase-8 expression was localized in Iba1-positive cells (b). Scale bar represent 100 μm in IHC images (a) & 10 μm in IF images (b) Image collected & cropped by CiteAb from the following publication (https://pubmed.ncbi.nlm.nih.gov/27566702), licensed under a CC-BY license. Not internally tested by Novus Biologicals.
Immunocytochemistry/ Immunofluorescence: AIF-1/Iba1 Antibody [NB100-1028] -
Immunocytochemistry/ Immunofluorescence: AIF-1/Iba1 Antibody [NB100-1028] - ABIN1 is colocated with A20 & NeuN & Iba-1, respectively, in the peri-infarct cortex. (a) Double immunofluorescence staining for ABIN1 & A20 in the peri-infarct cortex at 24 h after reperfusion (n = 3 rats per group). Scale bar = 50 μm. (b) Coimmunoprecipitation of ABIN1 & A20 in the peri-infarct cortex at 24 h after reperfusion (n = 3 rats per group). (c) Double immunofluorescence labeling of ABIN1 (red) & NeuN (green, neurons), Iba-1 (green, microglia), & GFAP (green, astrocytes), respectively (n = 3 rats per group). White arrows show that ABIN1 is colocalized with NeuN & Iba-1, respectively. Scale bar = 50 μm. (d) Comparisons of the percentage of ABIN1+ NeuN+ cells among ABIN1+ cells & ABIN1+ Iba-1+ cells among ABIN1+ cells in the peri-infarct cortex. ∗∗P < 0.01 compared to ABIN1+ NeuN+/ABIN1+. Image collected & cropped by CiteAb from the following publication (https://pubmed.ncbi.nlm.nih.gov/33110436), licensed under a CC-BY license. Not internally tested by Novus Biologicals.
Immunocytochemistry/ Immunofluorescence: AIF-1/Iba1 Antibody [NB100-1028] -
Immunocytochemistry/ Immunofluorescence: AIF-1/Iba1 Antibody [NB100-1028] - Differential expression analysis in cognitively normal older adults & Plcg2- inactivated mouse model identified inflammation-related pathways. The volcano plot shows significant DEGs (fold change>1.5, FDR-corrected p<0.05) in cognitively normal older adults (CN) with lower (bottom 25%; n=50; low) versus higher (top 25%; n=50; high) expression of PLCG2 (a). Gene-set enrichment analysis was performed on the DEGs (fold change>1.5, FDR-corrected p<0.05) to identify GO terms, including inflammatory response (b). The volcano plot shows significant DEGs derived from the NanoString analysis of the brains of Plcg2 inactivation (PLCG2 inact, n=3) & WT (n=3) mice (1-month male) (c). Immunostaining of microglial markers with IBA1 (green) & P2RY12 (red) & quantification of percent area in brain sections of 1-month-old male WT & PLCG2 inact demonstrate unchanged microglial morphology & area coverage (d). GO gene ontology, BP biological process, DEGs differentially expressed genes, FDR false discovery rate Image collected & cropped by CiteAb from the following publication (https://pubmed.ncbi.nlm.nih.gov/35180881), licensed under a CC-BY license. Not internally tested by Novus Biologicals.
Immunocytochemistry/ Immunofluorescence: AIF-1/Iba1 Antibody [NB100-1028] -
Immunocytochemistry/ Immunofluorescence: AIF-1/Iba1 Antibody [NB100-1028] - Representative & quantitative immunohistochemistry of the peri-infarct cortex before the bregma (coordinate + 0.58) in normal WT, normal sEH KO, MCAO WT, MCAO sEH KO, MCAO with vehicle treatment & MCAO with AUDA treatment mice (n = 2 for normal groups, n = 5–6 for all groups subjected to MCAO). (A–F, S) The number of CD31-positive endothelial cells significantly increased in the sEH KO before & after MCAO & post-MCAO AUDA-treated mice, while (G–L) Note the increased phosphorylated TrkB (p-TrkB) immunoreactivity that partially co-localized with NeuN-positive neurons, particularly in the sEH KO & AUDA-treated mice (arrows) (T). The percentage of NeuN- & p-TrkB-positive double labeling in the neuronal population was significantly increased compared to that in the corresponding controls. (M–R, U–V) GFAP-positive astrogliosis & Iba1-positive microglial infiltration decreased in post-MCAO sEH KO & AUDA treatment groups relative to that in the corresponding controls. The scale bar represents 50 µm. *p < 0.05, **p < 0.01, ***p < 0.001. Image collected & cropped by CiteAb from the following publication (https://pubmed.ncbi.nlm.nih.gov/29311641), licensed under a CC-BY license. Not internally tested by Novus Biologicals.
Immunocytochemistry/ Immunofluorescence: AIF-1/Iba1 Antibody [NB100-1028] -
Immunocytochemistry/ Immunofluorescence: AIF-1/Iba1 Antibody [NB100-1028] - Norgestrel reduces pro-inflammatory & promotes anti-inflammatory phenotypes in rd10 microglia.(A) RT-qPCR analysis detected similar levels of mRNAs encoding progesterone receptor membrane complexes 1 & 2 (PGRMC1, PGRMC2) & all three membrane progesterone receptor isoforms, alpha, beta & gamma (mPR alpha, mPR beta, mPR gamma ) in rd10 retinal microglial cells. Classical progesterone receptor (PR A/B) was not expressed. Actin, HPRT & GAPDH served as reference genes. (B) Immunolabeling confirmed the presence of these progesterone receptors in primary rd10 microglial cells. Hoechst (blue) staining reveals the cell nuclei. Scale bar represents 10μm. (C) Fluorescent microscopic images of primary rd10 microglia immunolabeled for (C) (i) markers of activation (CD68) & pro-inflammation (M1) (iNOS) & (C) (ii) anti-inflammatory activation (M2) (MRC1); after treatment with 20 μM Norgestrel over 24h. Norgestrel reduced pro-inflammatory & increased anti-inflammatory markers in rd10 microglia. Scale bar 10μm. (D) Quantification of fluorescence intensity of (D) (i) CD68 & iNOS & (D) (ii) MRC1 in primary rd10 microglial cultures following Norgestrel treatment over 24h. N = 8 mice, n = 4 technical replicates per group. (E) Nitrite concentration in the media of rd10 microglia in vitro treated with Norgestrel or vehicle over 24hr. Norgestrel significantly reduced nitrite release from rd10 microglia. N = 8 biological replicates, n = 2 technical replicates per sample. Results are presented as mean ± SEM (t-test, *p<0.05, ***p<0.005, ****p<0.001). Image collected & cropped by CiteAb from the following publication (https://dx.plos.org/10.1371/journal.pone.0165197), licensed under a CC-BY license. Not internally tested by Novus Biologicals.
Immunohistochemistry: AIF-1/Iba1 Antibody [NB100-1028] -
Immunohistochemistry: AIF-1/Iba1 Antibody [NB100-1028] - Temporal activation of caspase-8 in Iba1-positive myeloid cells. Frozen tissue sections from mice upon pMCAO (n = 9) were analyzed by immunohistochemistry for expression of active caspase-8 or for expression of the microglia/macrophage marker Iba1. The contralateral side to the ischemic area was used an internal control for each animal. A small increase in body size of Iba1 positive cells was detected in the peri-infarct area at 6 h, with larger increase in cell body & numbers of cells expressing Iba1 detected at 24 & 48 h post occlusion (a). Cleaved caspase-8 was detected at low levels at 6 h, but a significant increase in expression levels was observed at 24 & 48 h in the peri-infarct area, but not at the contralateral side (a). Double immunofluorescent staining revealed that increased active caspase-8 expression was localized in Iba1-positive cells (b). Scale bar represent 100 μm in IHC images (a) & 10 μm in IF images (b) Image collected & cropped by CiteAb from the following publication (https://pubmed.ncbi.nlm.nih.gov/27566702), licensed under a CC-BY license. Not internally tested by Novus Biologicals.
Western Blot: AIF-1/Iba1 Antibody [NB100-1028] -
Western Blot: AIF-1/Iba1 Antibody [NB100-1028] - GM1 effects on brain microglia in vivo, after peripheral administration of LPS. A Schematic representation of in vivo administration of GM1 after LPS-induced systemic inflammation in mice (N = 5 per treatment). B Representative images of Iba-1 stained microglia in the cortex of control animals infused with vehicle (CTRL) or GM1 (CTRL + GM1), & in animals treated with LPS & subsequently infused with vehicle artificial cerebrospinal fluid (LPS) or GM1 (LPS + GM1). C Immunoblot in whole brain lysates & densitometric analysis show LPS-dependent increase in Iba 1 expression. D Cortical & striatal microglia (Iba-1+ cells) cell body area quantified with MetaXpress software. GM1 administration significantly decreases cell body area in the cortex, but not in the striatum. E IL-6 protein levels in whole mouse brain homogenate. aCSF, artificial cerebrospinal fluid. Bars show mean values ± STDEV. Two-way ANOVA with Tukey’s multiple comparisons test; *p < 0.05, **p < 0.01, ***p < 0.001 Image collected & cropped by CiteAb from the following publication (https://pubmed.ncbi.nlm.nih.gov/34991625), licensed under a CC-BY license. Not internally tested by Novus Biologicals.
Immunocytochemistry/ Immunofluorescence: AIF-1/Iba1 Antibody [NB100-1028] -
Immunocytochemistry/ Immunofluorescence: AIF-1/Iba1 Antibody [NB100-1028] - ABIN1 knockdown increases proinflammatory cytokine production & microglial activation. (a-b) Levels of the ABIN1 mRNA & protein were detected 24 h after reperfusion using RT-qPCR & western blot, respectively, to confirm the efficiency of ABIN1 gene knockdown (n = 5 rats per group). (c) ELISA was used to detect the concentrations of TNF-alpha, IL-1 beta & MCP-1 in the peri-infarct cortex at 24 h after reperfusion (n = 5 rats per group). (d) Microglial morphology was observed using immunofluorescence staining for Iba-1 (green) in the peri-infarct cortex at 24 h after reperfusion (n = 3 rats per group). Scale bar = 50 μm. (e & f) Quantification of microglia process endpoints & cell & process lengths/cell (∗∗P < 0.01 compared to the sham group; ##P < 0.01 compared to the MCAO/R group). Image collected & cropped by CiteAb from the following publication (https://pubmed.ncbi.nlm.nih.gov/33110436), licensed under a CC-BY license. Not internally tested by Novus Biologicals.
Immunocytochemistry/ Immunofluorescence: AIF-1/Iba1 Antibody [NB100-1028] -
Immunocytochemistry/ Immunofluorescence: AIF-1/Iba1 Antibody [NB100-1028] - SCF+G-CSF treatment increases TREM2 expression in the Iba1+ microglia/macrophages surrounding the 6E10+ senile plaques. (A) Representative confocal images of TREM2 (red), 6E10 (purple) & Iba1 (green) triple immunofluorescence staining in the brains of aged APP/PS1 mice. Blue: Nuclear counterstaining by DAPI. (B) Representative orthographic view of z-stack images (12 z-stacks with 1μm intervals) illustrates the location & interaction of TREM2 + cells (red) & 6E10+ A beta plaques (white) in the brains of aged APP/PS1 mice. (C) Quantification data show the percentage of TREM2+ area surrounding the 6E10+ A beta plaques (within 10μm from the border of the A beta plaques) in the brains of aged APP/PS1 mice with or without SCF+G-CSF treatment. (D) Representative orthographic view of z-stack images (12 z-stacks with 1μm intervals) displays the location & interaction of TREM2+/Iba1+ co-expressing cells (yellow) & 6E10+ A beta plaques (white) in the brains of APP/PS1 mice. (E) Quantification data show the percentage of TREM2+/Iba1+ co-expression area in the total of Iba1+ area in the vicinity of 6E10+ A beta plaques in the brains of aged APP/PS1 mice with or without SCF+G-CSF treatment. N=4-5. Mean ± SEM. * p<0.05 by Student’s t-test. Image collected & cropped by CiteAb from the following publication (https://pubmed.ncbi.nlm.nih.gov/33269098), licensed under a CC-BY license. Not internally tested by Novus Biologicals.
Immunocytochemistry/ Immunofluorescence: AIF-1/Iba1 Antibody [NB100-1028] -
Immunocytochemistry/ Immunofluorescence: AIF-1/Iba1 Antibody [NB100-1028] - SCF+G-CSF treatment increases the association of Iba1+ microglia/macrophages with senile plaques & enhances uptake of 4G8+ A beta by the Iba1+ microglia/macrophages in the brains of aged APP/PS1 mice. (A) Representative confocal images illustrate the association of Iba1+ cells (green) with 4G8+ A beta plaques (red) in the brains of aged APP/PS1 mice. Blue: Nuclear counterstaining by DAPI. (B) Quantification of the percentage of Iba1+ area in/surrounding the 4G8+ A beta plaques in the brains of aged APP/PS1 mice with or without SCF+G-CSF treatment. (C) Representative 3-dimensional projected images reveal the overlapped (yellow) Iba1+ cells (green) with 4G8+ A beta (red) in the brains of aged APP/PS1 mice. The white arrows indicate the co-expression (yellow) of 4G8+ A beta & Iba1+ cells in the brains of aged APP/PS1 mice. (D & E) Representative orthographic view of z-stack images (12 z-stacks with 1μm intervals) shows the co-expression (yellow) of 4G8+ A beta (red) & Iba1+ cells (green) in the brains of aged APP/PS1 mice. (F) Quantification data present the percentage of 4G8+ A beta volume within the Iba1+ cells in the brains of aged APP/PS1 mice treated with or without SCF+G-CSF. N=4-5. Mean ± SEM. *p<0.05 by Student’s t-test. Image collected & cropped by CiteAb from the following publication (https://pubmed.ncbi.nlm.nih.gov/33269098), licensed under a CC-BY license. Not internally tested by Novus Biologicals.
Immunocytochemistry/ Immunofluorescence: AIF-1/Iba1 Antibody [NB100-1028] -
Immunocytochemistry/ Immunofluorescence: AIF-1/Iba1 Antibody [NB100-1028] - Representative & quantitative immunohistochemistry of the peri-infarct cortex before the bregma (coordinate + 0.58) in normal WT, normal sEH KO, MCAO WT, MCAO sEH KO, MCAO with vehicle treatment & MCAO with AUDA treatment mice (n = 2 for normal groups, n = 5–6 for all groups subjected to MCAO). (A–F, S) The number of CD31-positive endothelial cells significantly increased in the sEH KO before & after MCAO & post-MCAO AUDA-treated mice, while (G–L) Note the increased phosphorylated TrkB (p-TrkB) immunoreactivity that partially co-localized with NeuN-positive neurons, particularly in the sEH KO & AUDA-treated mice (arrows) (T). The percentage of NeuN- & p-TrkB-positive double labeling in the neuronal population was significantly increased compared to that in the corresponding controls. (M–R, U–V) GFAP-positive astrogliosis & Iba1-positive microglial infiltration decreased in post-MCAO sEH KO & AUDA treatment groups relative to that in the corresponding controls. The scale bar represents 50 µm. *p < 0.05, **p < 0.01, ***p < 0.001. Image collected & cropped by CiteAb from the following publication (https://pubmed.ncbi.nlm.nih.gov/29311641), licensed under a CC-BY license. Not internally tested by Novus Biologicals.
Immunocytochemistry/ Immunofluorescence: AIF-1/Iba1 Antibody [NB100-1028] -
Immunocytochemistry/ Immunofluorescence: AIF-1/Iba1 Antibody [NB100-1028] - Antibody-mediated Nogo-A blockade decreases the number of cells expressing TNF alpha without affecting the number of Iba1-positive monocytes.Cells expressing TNF alpha, Iba1, & CD68 were labeled on cryosections by immunofluorescence in 4 mouse retinae, 24 h after control IgG or 11C7 injection. a Retinal sections showed many TNF alpha -containing cells located in the inner retina, between the outer plexiform layer & the ganglion cell layer 1 day after control IgG injection. A majority of cells was positive for Iba1 & exhibited vesicular staining of the lysosomal protein CD68, indicating their active state. b The injection of 11C7 strongly attenuated TNF alpha & CD68 expression & to a lower extent the intensity of Iba1 in macrophages/microglia. c Quantification of the number of cells expressing TNF alpha & Iba1 suggesting potent & specific effects of 11C7 on TNF alpha cytokine reduction. Six sections were examined for each retina. Statistics: one-way ANOVA, Dunnett’s post hoc test, **P < 0.01; ****P < 0.0001. Scale bars = 50 μm. Image collected & cropped by CiteAb from the following publication (https://pubmed.ncbi.nlm.nih.gov/32029703), licensed under a CC-BY license. Not internally tested by Novus Biologicals.
Immunocytochemistry/ Immunofluorescence: AIF-1/Iba1 Antibody [NB100-1028] -
Immunocytochemistry/ Immunofluorescence: AIF-1/Iba1 Antibody [NB100-1028] - SCF+G-CSF treatment increases TREM2 expression in the Iba1+ microglia/macrophages surrounding the 6E10+ senile plaques. (A) Representative confocal images of TREM2 (red), 6E10 (purple) & Iba1 (green) triple immunofluorescence staining in the brains of aged APP/PS1 mice. Blue: Nuclear counterstaining by DAPI. (B) Representative orthographic view of z-stack images (12 z-stacks with 1μm intervals) illustrates the location & interaction of TREM2 + cells (red) & 6E10+ A beta plaques (white) in the brains of aged APP/PS1 mice. (C) Quantification data show the percentage of TREM2+ area surrounding the 6E10+ A beta plaques (within 10μm from the border of the A beta plaques) in the brains of aged APP/PS1 mice with or without SCF+G-CSF treatment. (D) Representative orthographic view of z-stack images (12 z-stacks with 1μm intervals) displays the location & interaction of TREM2+/Iba1+ co-expressing cells (yellow) & 6E10+ A beta plaques (white) in the brains of APP/PS1 mice. (E) Quantification data show the percentage of TREM2+/Iba1+ co-expression area in the total of Iba1+ area in the vicinity of 6E10+ A beta plaques in the brains of aged APP/PS1 mice with or without SCF+G-CSF treatment. N=4-5. Mean ± SEM. * p<0.05 by Student’s t-test. Image collected & cropped by CiteAb from the following publication (https://pubmed.ncbi.nlm.nih.gov/33269098), licensed under a CC-BY license. Not internally tested by Novus Biologicals.
Immunocytochemistry/ Immunofluorescence: AIF-1/Iba1 Antibody [NB100-1028] -
Immunocytochemistry/ Immunofluorescence: AIF-1/Iba1 Antibody [NB100-1028] - Representative & quantitative immunohistochemistry of the peri-infarct cortex before the bregma (coordinate + 0.58) in normal WT, normal sEH KO, MCAO WT, MCAO sEH KO, MCAO with vehicle treatment & MCAO with AUDA treatment mice (n = 2 for normal groups, n = 5–6 for all groups subjected to MCAO). (A–F, S) The number of CD31-positive endothelial cells significantly increased in the sEH KO before & after MCAO & post-MCAO AUDA-treated mice, while (G–L) Note the increased phosphorylated TrkB (p-TrkB) immunoreactivity that partially co-localized with NeuN-positive neurons, particularly in the sEH KO & AUDA-treated mice (arrows) (T). The percentage of NeuN- & p-TrkB-positive double labeling in the neuronal population was significantly increased compared to that in the corresponding controls. (M–R, U–V) GFAP-positive astrogliosis & Iba1-positive microglial infiltration decreased in post-MCAO sEH KO & AUDA treatment groups relative to that in the corresponding controls. The scale bar represents 50 µm. *p < 0.05, **p < 0.01, ***p < 0.001. Image collected & cropped by CiteAb from the following publication (https://pubmed.ncbi.nlm.nih.gov/29311641), licensed under a CC-BY license. Not internally tested by Novus Biologicals.
Immunocytochemistry/ Immunofluorescence: AIF-1/Iba1 Antibody [NB100-1028] -
Immunocytochemistry/ Immunofluorescence: AIF-1/Iba1 Antibody [NB100-1028] - The presence or absence of TRPV1 influences microglial pathophysiological changes in recurrent febrile seizures mice. (A) Images of the cortex immunostained for the microglial marker Iba-1 (visualized in green FITC) & the lysosomal marker CD68/ED1 (visualized in red Alexa Fluor 594) & DAPI (visualized in blue) 5 days after rFS from wild type (WT) & TRPV1−/− mice (Scale bars: 50 μm). (B,C) Bar graph of quantification of Iba1+(B) & Iba1+ ED1+(C) in 5 days after rFS mice cortex. (D) Representative photomicrographs of different microglial morphological subtypes including resting/ramified (Ram), hypertrophic/intermediate (Inter) & round/ameboid (Amoeboid; Scale bars: 5 μm). (E) Quantification of relative percentage of microglia with different morphologies in the cortex of WT & TRPV1−/− mice (n = 6 per groups, **p < 0.01, ***p < 0.001, two-way ANOVA followed by Tukey’s multiple comparisons). (F–H) Representative Immunoblot bands (F) & densitometric analysis of Iba1 expression (G) & ED1 expression (H) were significantly increased in rFS from WT mice than in TRPV1−/− mice. Data were presented as means ± SEM, n = 6 per groups, *p < 0.05, **p < 0.01, ***p < 0.001, two-way ANOVA followed by Tukey’s multiple comparisons. Image collected & cropped by CiteAb from the following publication (https://pubmed.ncbi.nlm.nih.gov/31680864), licensed under a CC-BY license. Not internally tested by Novus Biologicals.
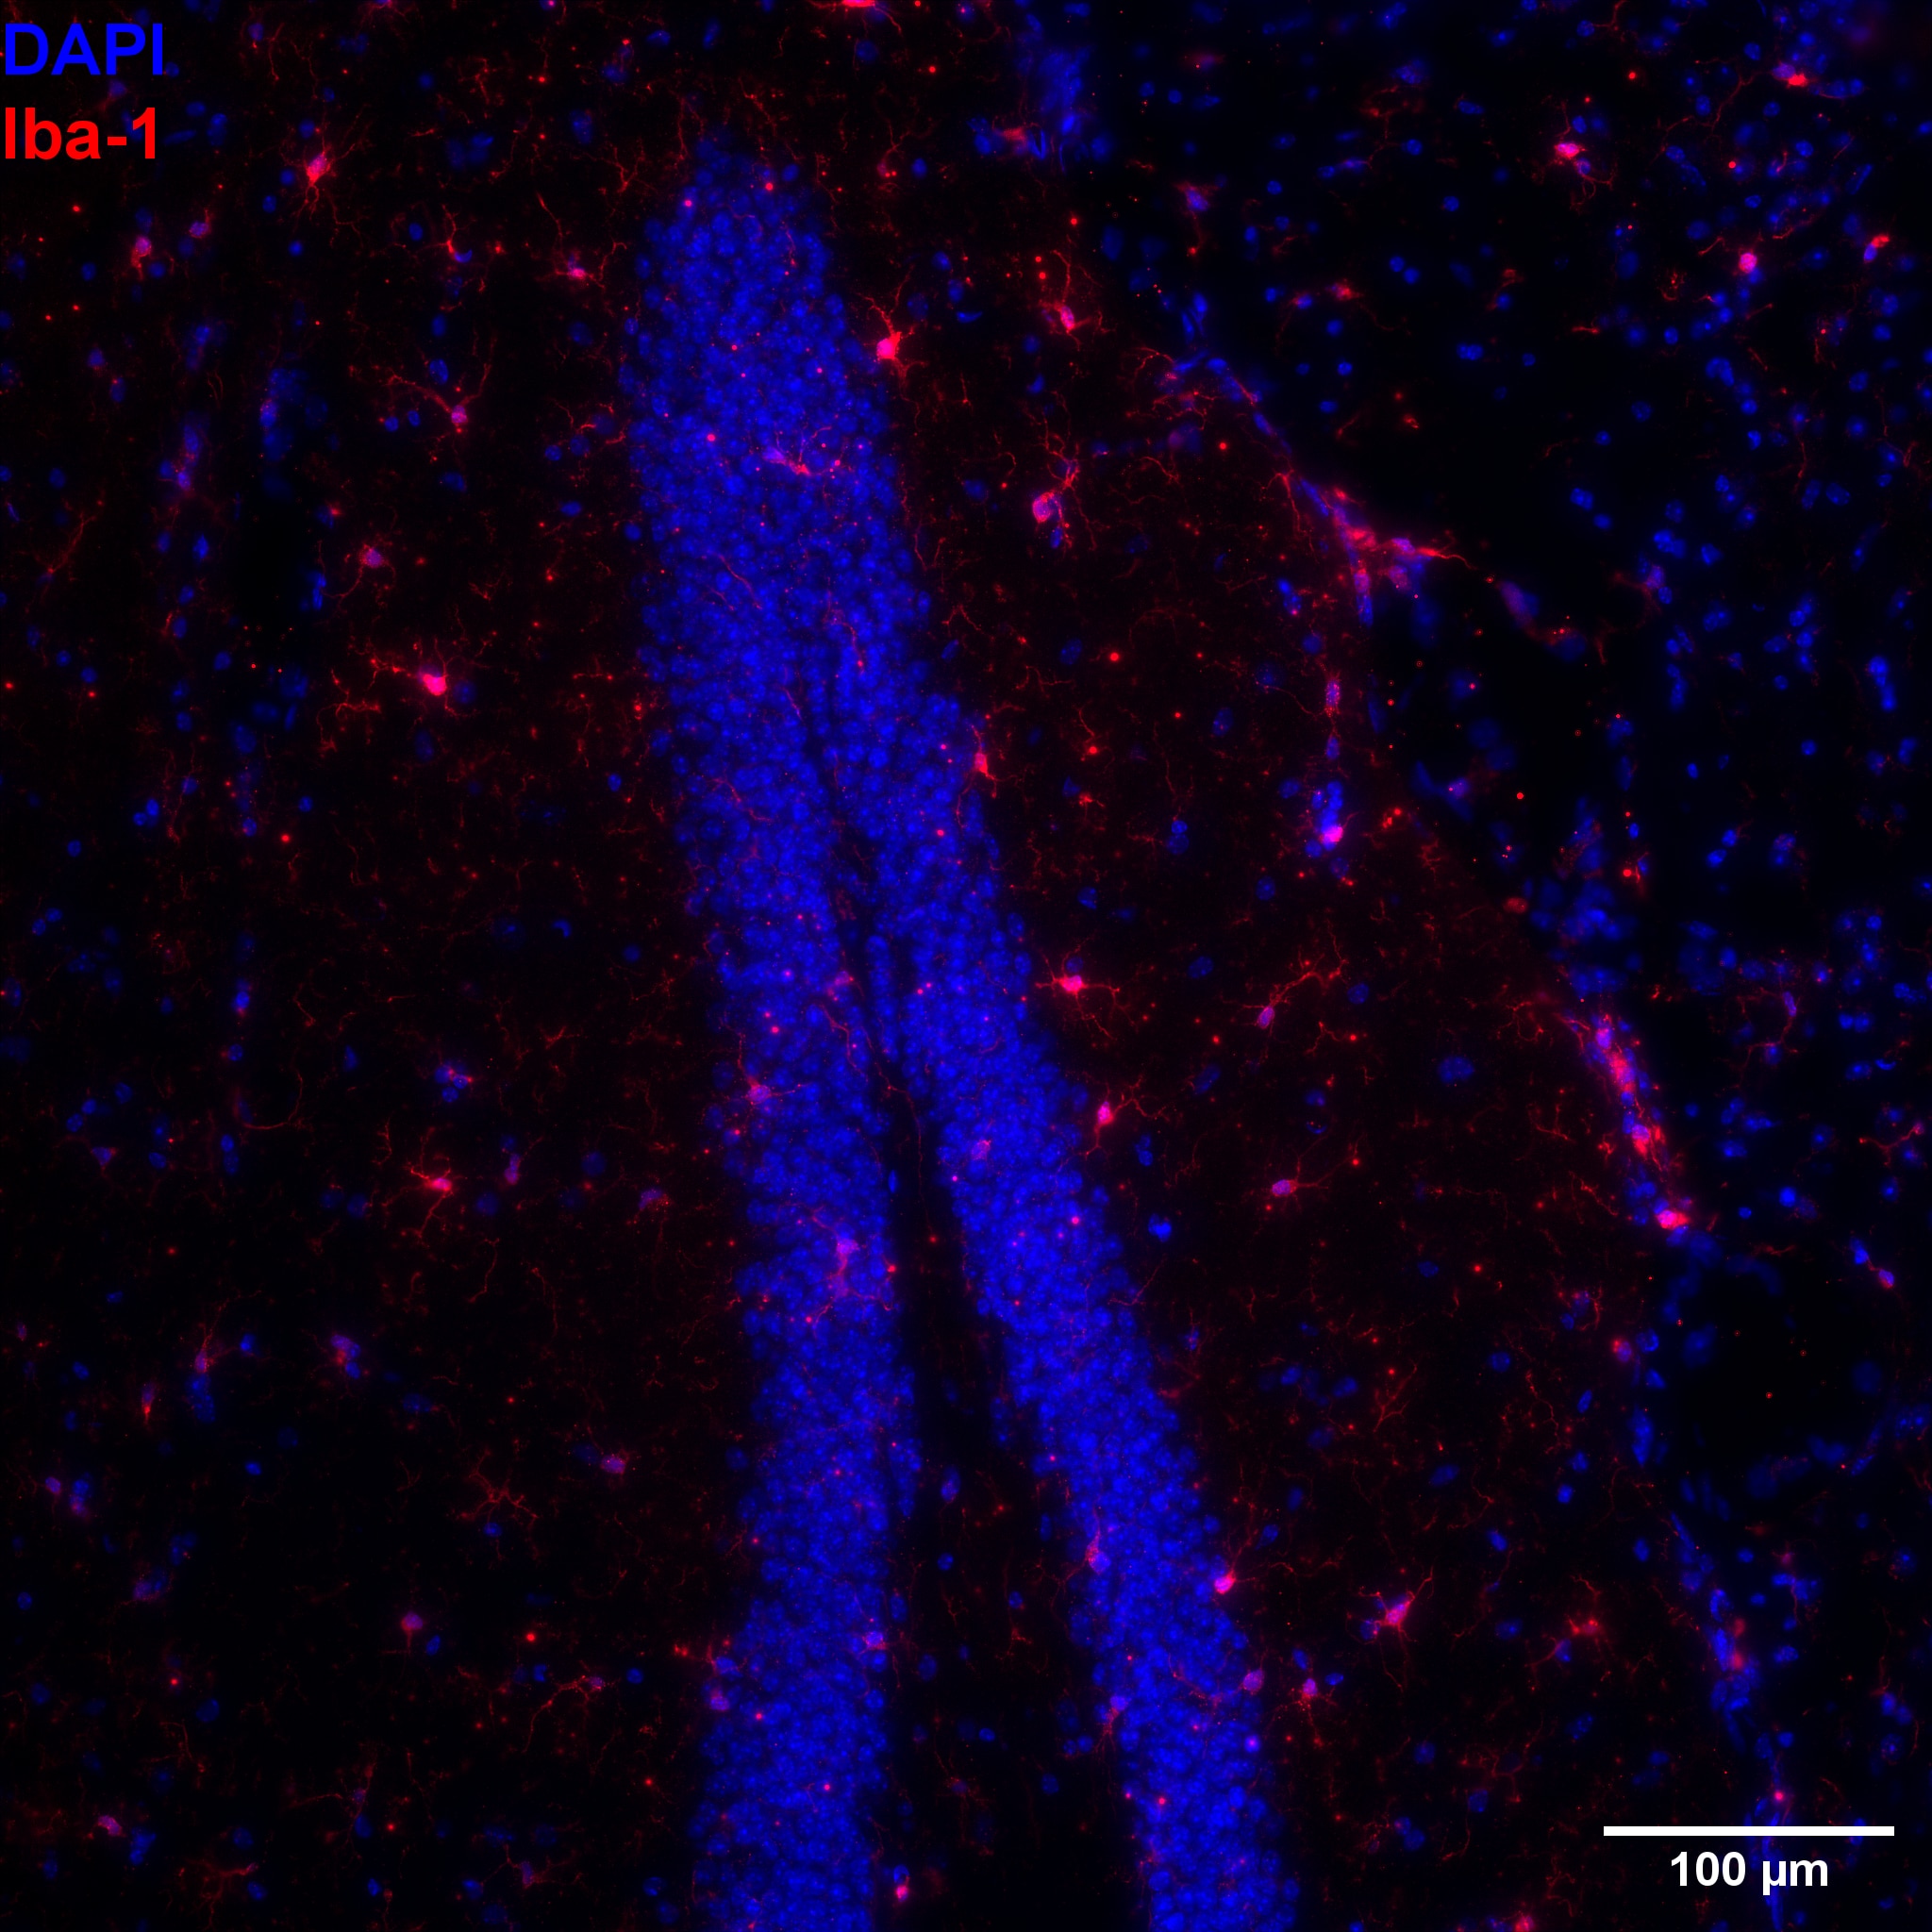
Immunohistochemistry-Frozen: Goat Polyclonal AIF-1/Iba1 Antibody [NB100-1028]
Immunohistochemistry-Frozen: Goat Polyclonal AIF-1/Iba1 Antibody [NB100-1028] - AD Mouse Model. FxFr:10 µm thickness 1:200. Secondary antibody AF647. Image from a verified customer review.
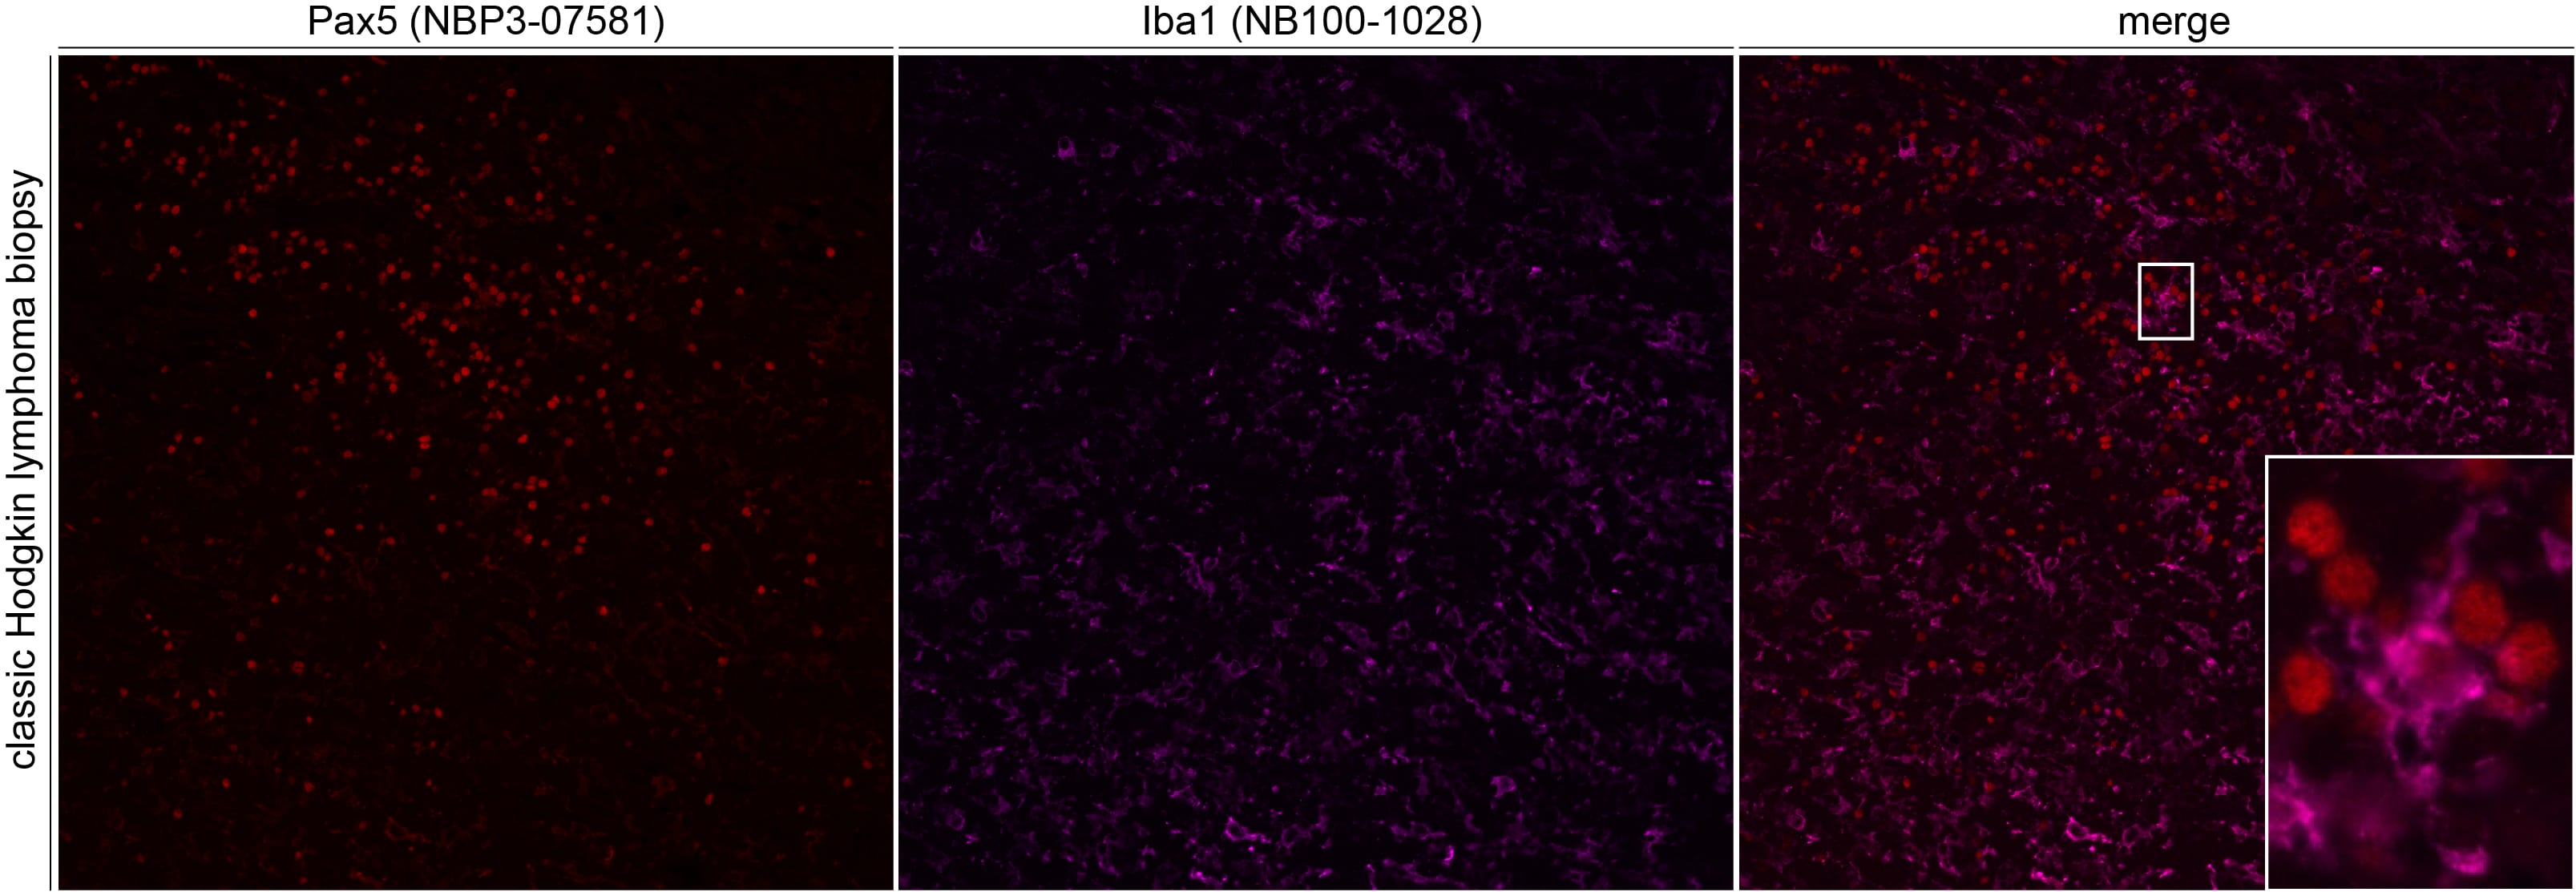
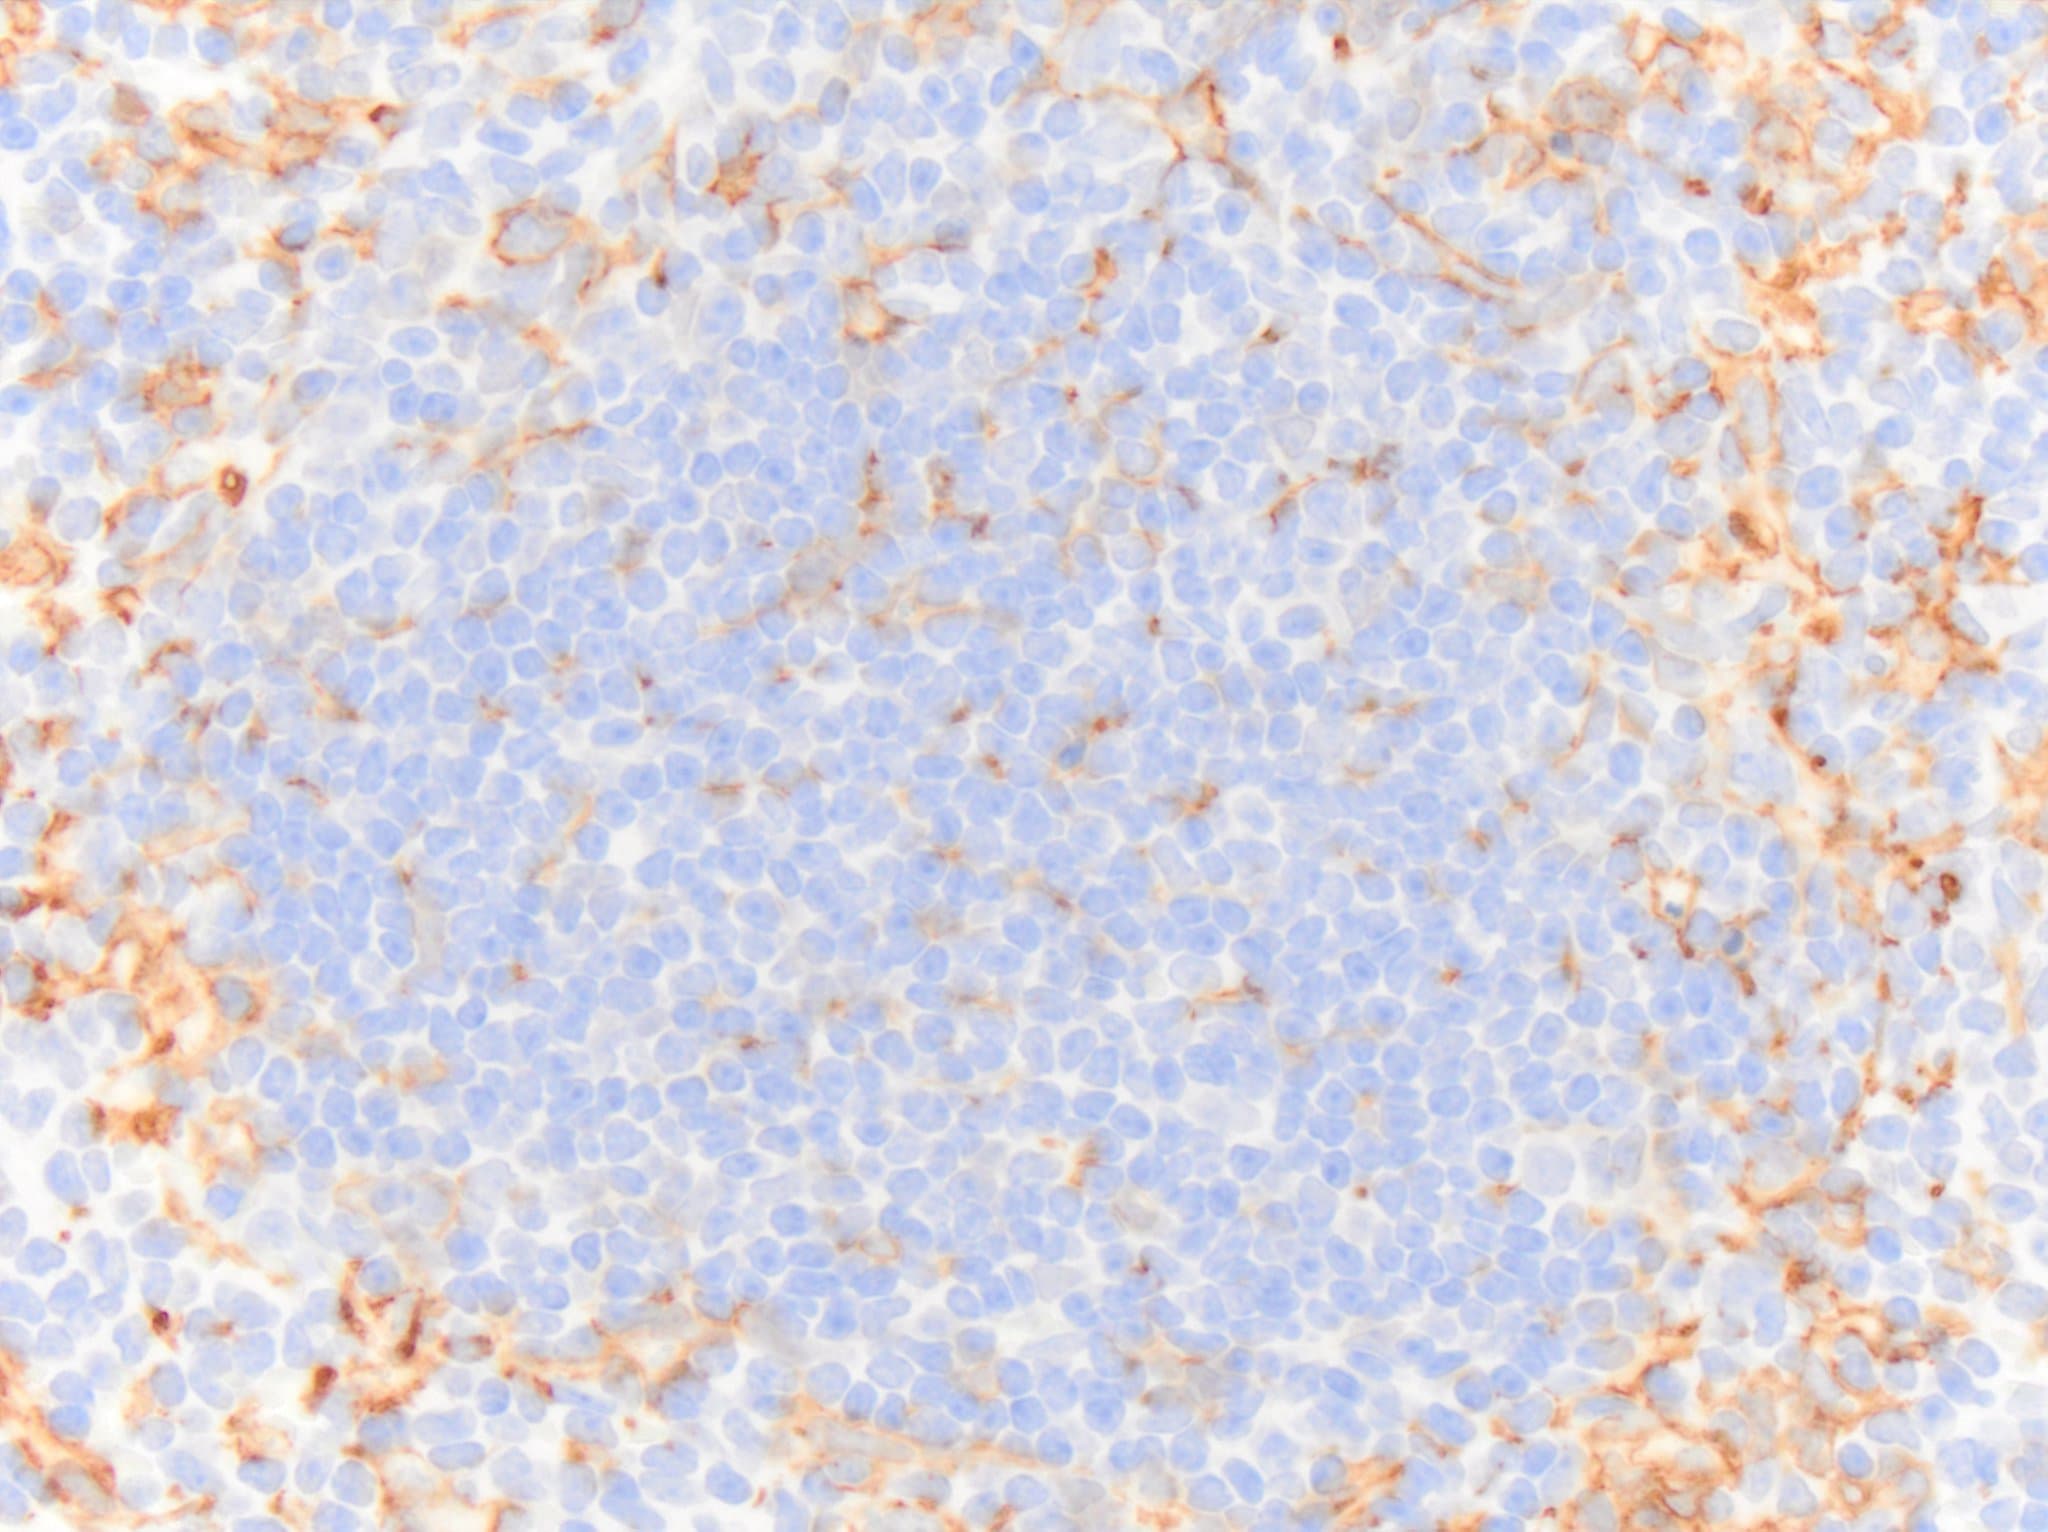
Immunohistochemistry: Goat Polyclonal AIF-1/Iba1 Antibody [NB100-1028]
Immunohistochemistry: Goat Polyclonal AIF-1/Iba1 Antibody [NB100-1028] - Pax5 and Iba1 immunoreactivity in a formalin fixed paraffin embedded classic Hodgkin's lymphoma biopsy. Formalin fixed paraffin embedded sections were deparaffinized and rehydrated. Sections then underwent heat induced epitope retrieval in a citrate-based solution for 20min in a food steamer. Sections were cooled, then blocked in phosphate buffered saline containing 0.2% Triton-X100 and 10% normal donkey serum for 1h at room temperature. Sections were then incubated with the primary antibody for 16h at room temperature. The following day slides were washed three times with PBS containing 0.05% Tween-20. Sections were then incubated with donkey anti-goat (647 conjugate) at 5ug per mL for 45min at room temperature. Slides were then washed as above and mounted with a coverslip. Image from a verified customer review.Applications for AIF-1/Iba1 Antibody
Application
Recommended Usage
Immunohistochemistry-Paraffin
6 - 8 ug/mL
Peptide ELISA
Detection Limit 1:128000
Western Blot
0.1 - 1.0 ug/mL
Application Notes
ICC/IF use reported in scientific literature (PMID: 26335282). Use in IHC-Whole mount reported in scientific literature (PMID: 26676316). This AIF-1/Iba1 antibody is validated for IHC-Whole mount and IHC-F from verified customer reviews. Dual ISH-IHC validation reported in scientific literature (PMID: 31220182). WB: Approx. 16kDa band observed in Human Frontal Cortex, Mouse Brain and Rat Brain lysates and Mouse Lymph node lysates (calculated MW of 16.7kDa according to Human NP_001614.3, 16.9kDa according to Mouse NP_062340.1 and 16.8kDa according to Rat NP_058892.1). Primary incubation 1 hour at room temperature.
Reviewed Applications
Read 28 reviews rated 4.5 using NB100-1028 in the following applications:
Formulation, Preparation, and Storage
Purification
Immunogen affinity purified
Formulation
Tris saline (20 mM Tris pH 7.3, 150 mM NaCl), 0.5% BSA
Preservative
0.02% Sodium Azide
Concentration
0.5 mg/ml
Shipping
The product is shipped with polar packs. Upon receipt, store it immediately at the temperature recommended below.
Stability & Storage
Store at -20C. Avoid freeze-thaw cycles.
Background: AIF-1/Iba1
Several cellular functions have been associated with AIF-1/Iba1 expression including cell growth, cell migration, actin bundling, membrane ruffling, and phagocytic activity (2, 4). Iba1 induces Rac signaling through a PLC-gamma dependent pathway (1). Rac, a member of the Rho family of small GTPases, localizes with Iba1 and F-actin in membrane ruffles and phagocytic cups and plays a role in microglia activation. AIF-1/Iba1 induction in macrophages and microglia occur in association with immunological inflammatory processes in various disease states including endometriosis, cerebral infarction and rheumatoid arthritis (5). Immunodetection of Iba1 through flow cytometry, immunohistochemical or immunocytochemical applications is commonly used for identification and analysis of microglia.
References
1. Imai, Y., & Kohsaka, S. (2002). Intracellular signaling in M-CSF-induced microglia activation: Role of Iba1. GLIA. https://doi.org/10.1002/glia.10149
2. Deininger, M. H., Meyermann, R., & Schluesener, H. J. (2002). The allograft inflammatory factor-1 family of proteins. FEBS Letters. https://doi.org/10.1016/S0014-5793(02)02430-4
3. Utans, U., Quist, W. C., Mcmanus, B. M., Wilson, J. E., Arceci, R. J., Wallace, A. F., & Russell, M. E. (1996). Allograft inflammatory factor-1: A cytokine-responsive macrophage molecule expressed in transplanted human hearts. Transplantation. https://doi.org/10.1097/00007890-199605150-00018
4. Franco-Bocanegra, McAuley, Nicoll, & Boche. (2019). Molecular Mechanisms of Microglial Motility: Changes in Ageing and Alzheimer's Disease. Cells. https://doi.org/10.3390/cells8060639
5. Kimura, M., Kawahito, Y., Obayashi, H., Ohta, M., Hara, H., Adachi, T.,... Yoshikawa, T. (2007). A Critical Role for Allograft Inflammatory Factor-1 in the Pathogenesis of Rheumatoid Arthritis. The Journal of Immunology. https://doi.org/10.4049/jimmunol.178.5.3316
Long Name
Allograft Inflammatory Factor 1
Alternate Names
AIF1, IBA1, IRT1
Gene Symbol
AIF1
UniProt
Additional AIF-1/Iba1 Products
Product Documents for AIF-1/Iba1 Antibody
Certificate of Analysis
To download a Certificate of Analysis, please enter a lot or batch number in the search box below.
Product Specific Notices for AIF-1/Iba1 Antibody
This product is for research use only and is not approved for use in humans or in clinical diagnosis. Primary Antibodies are guaranteed for 1 year from date of receipt.
Related Research Areas
Citations for AIF-1/Iba1 Antibody
 Powered by Bioz
Customer Reviews for AIF-1/Iba1 Antibody (28)
4.5 out of 5
28 Customer Ratings
Have you used AIF-1/Iba1 Antibody?
Submit a review and receive an Amazon gift card!
$25/€18/£15/$25CAN/¥2500 Yen for a review with an image
$10/€7/£6/$10CAN/¥1110 Yen for a review without an image
Submit a review
Customer Images


-(01-mg)_NB100-1028_8541.jpg)
Showing
1
-
5 of
28 reviews
Showing All
Filter By:
-
Application: ImmunofluorescenceSample Tested: Classic Hodgkin's LymphomaSpecies: HumanVerified Customer | Posted 02/26/2025Pax5 and Iba1 immunoreactivity in a formalin fixed paraffin embedded classic Hodgkin's lymphoma biopsy.Formalin fixed paraffin embedded sections were deparaffinized and rehydrated. Sections then underwent heat induced epitope retrieval in a citrate-based solution for 20min in a food steamer. Sections were cooled, then blocked in phosphate buffered saline containing 0.2% Triton-X100 and 10% normal donkey serum for 1h at room temperature. Sections were then incubated with the primary antibody for 16h at room temperature. The following day slides were washed three times with PBS containing 0.05% Tween-20. Sections were then incubated with donkey anti-goat (647 conjugate) at 5ug per mL for 45min at room temperature. Slides were then washed as above and mounted with a coverslip.

-
Application: Immunohistochemistry-FrozenSample Tested: Brain tissueSpecies: MouseVerified Customer | Posted 12/02/2024Nucleus (Blue, DAPI) ; Microglia (red)AD Mouse Model FxFr ; 10 µm thickness 1:200 Secondary antibody AF647
-
Application: Immunohistochemistry-ParaffinSample Tested: TonsilSpecies: HumanVerified Customer | Posted 04/24/2024Iba1 immunoreactivity in an FFPE section of human tonsil. NB100 1028 was diluted to 1ug per mL and was left on tissue sections for 30m at room temperature. Secondary was horse anti goat HRP polymer.Section underwent heat induced epitope retrieval in a vegetable steamer for 20m using Target Retrieval Solution.
-
Application: Immunohistochemistry-ParaffinSample Tested: SpleenSpecies: HorseVerified Customer | Posted 04/24/2024Iba1 immunoreactivity in an FFPE section of horse spleen. NB100 1028 was diluted to 1ug per mL and was left on tissue sections for 30m at room temperature. Secondary was horse anti goat HRP polymer.Section underwent heat induced epitope retrieval in a vegetable steamer for 20m using Target Retrieval Solution.
Bio-Techne ResponseThis review was submitted through the legacy Novus Innovators Program, reflecting a new species or application tested on a primary antibody.
-
Application: Immunohistochemistry-ParaffinSample Tested: SpleenSpecies: MouseVerified Customer | Posted 04/24/2024Iba1 immunoreactivity in an FFPE section of mouse spleen. NB100 1028 was diluted to 1ug per mL and was left on tissue sections for 30m at room temperature. Secondary was horse anti goat HRP polymer.Section underwent heat induced epitope retrieval in a vegetable steamer for 20m using Target Retrieval Solution.
-
Application: Immunohistochemistry-FrozenSample Tested: BrainSpecies: MouseVerified Customer | Posted 04/27/2023Iba1 staining of AD mouse model (hippocampus).
-
Application: Immunohistochemistry-FrozenSample Tested: 20 um Mouse brain TissueSpecies: MouseVerified Customer | Posted 04/25/2023LPS injected mouse brain tissue, 20 um thickness, frozen. Iba-1 antibody, 1:200. Secondary antibody CY3. Mounted with DAPI mount.
-
Application: Immunohistochemistry-ParaffinSample Tested: BrainSpecies: CanineVerified Customer | Posted 10/29/2021AIF-1/Iba1 in dog brain. Primary used at 1ug/mL and incubated with tissue for 30minutes at room temperature.
-
Application: Immunohistochemistry-ParaffinSample Tested: LiverSpecies: CanineVerified Customer | Posted 07/03/2021Dog liver stained for Iba1 (brown) and counterstained with Richard-Allan Scientific hematoxylin.Following deparaffinization, pre-heated >=90C Target Retrieval Solution - Dako S1699 - was added to slides and then the slide container was placed into a vegetable steamer for 20min. Following antigen retrieval, slides were cooled for 15min, washed with 1X PBS, then placed in 3 percent hydrogen peroxide diluted in methanol. Following peroxide quench, slides were sequentially incubated - 10min each at room temperature with washes in between - in avidin and biotin solution -abcam ab64212- then Dako Serum-Free Protein Block - Dako X0909. After incubation with the protein block, slides were incubated with the primary antibody diluted 1:500 in Dako Antibody Diluent - Dako S3022 - for 30 min at room temperature. Slides were then incubated with rabbit anti-goat - Vector Labs BA5000 - diluted at 1:200 in Dako Serum-Free Protein Block - Dako X0909. Slides were then incubated with VECTASTAIN Elite ABC-HRP Reagent - Vector Labs PK-7100 - for 30min at room temperature. Staining was then developed using Dako DAB as a chromogen.
-
Application: Immunohistochemistry-ParaffinSample Tested: Adult mouse brain tissueSpecies: MouseVerified Customer | Posted 08/12/2020Dapi and IBA1 red1/100 dilution Overnight in PBS at 4*C
-
Application: Immunohistochemistry-ParaffinSample Tested: Brain Tissue Sections, Human Brain Tissue and Brain tissueSpecies: HumanVerified Customer | Posted 01/17/2020Brown arrow= IBa1 positive cells Green arrow= mTOR positive cells Black arrow= mTOR and IBA1 positive cells
-
Application: Immunohistochemistry-PFA fixed, free floatingSample Tested: PFA fixed mouse brain and SCID mouse cortex injected with human glioblastoma cellsSpecies: MouseVerified Customer | Posted 12/14/2019Reactive microglia (green) in peritumoral area of IC injected human glioma cells in mouse brain. NeuN (red)-stained neurons, Dapi1:250
-
Application: ImmunocytochemistrySample Tested: adult mouse neural stem cellsSpecies: MouseVerified Customer | Posted 11/21/2019
-
Application: Whole-mount tissue immunolabelingSample Tested: Dorsal root ganglionSpecies: MouseVerified Customer | Posted 08/12/2019Iba1 expression in reactive macrophages. Maximum intensity z-projection from 3D images.Good signal to noise ratio for 3D imaging.
Bio-Techne ResponseThis review was submitted through the legacy Novus Innovators Program, reflecting a new species or application tested on a primary antibody.
-
Application: Immunohistochemistry-FrozenSample Tested: optic nerveSpecies: FelineVerified Customer | Posted 07/15/2019Imaging was performed using an epifluorescence microscope. Optic nerve microglia were immunolabeled with IBA1 (green). DAPI (blue).
-
Application: Immunohistochemistry-FrozenSample Tested: Mouse brainSpecies: MouseVerified Customer | Posted 05/15/2019Mouse brain cryo sections were stained with anti-Iba-1 (1:100) followed by anti goat Alexa Fluor 555 and DAPI. No microglia sepcific staining. High exposure times (3.5 sec, compare image) revealed unspecific stainings of blood vessels.
-
Application: Immunohistochemistry-FrozenSample Tested: mouse spinal cordSpecies: MouseVerified Customer | Posted 11/29/2018AIF-1/Iba1 immunoreacitiy in a mouse spinal cord after focal injection of lysolecitithin into the ventral column white matter
-
Application: Immunohistochemistry-ParaffinSample Tested: Optic nerveSpecies: CanineVerified Customer | Posted 08/07/2018NB100-1028 immunofluorescent signal was detected using Alexa Fluor 568 conjugated secondary antibody (Red). DAPI (Blue).
-
Application: ImmunofluorescenceSample Tested: Mouse brainSpecies: MouseVerified Customer | Posted 04/23/2018mus hypothalamus
-
Application: immunohistochemistry free floating tissueSample Tested: Mouse brainSpecies: Mouse and HumanVerified Customer | Posted 03/16/2018
-
Application: ImmunocytochemistrySample Tested: brain and spinal cordSpecies: MouseVerified Customer | Posted 04/01/2017
-
Application: Immunohistochemistry-FrozenSample Tested: Spinal cordSpecies: MouseVerified Customer | Posted 09/22/2016Mouse Microglia Staining in Frozen Sections
-
Application: ImmunofluorescenceSample Tested: mouse spinal cordSpecies: MouseVerified Customer | Posted 05/11/2016
-
Application: Immunohistochemistry-FrozenSample Tested: Rat frozen 4% paraformalehyde fixed brain sectionsSpecies: RatVerified Customer | Posted 10/08/2015Iba-1 staining rat hippocampus 40x
-
Application: Immunohistochemistry-ParaffinSample Tested: mouse brainSpecies: MouseVerified Customer | Posted 06/30/2014Iba-1 in mouse brain
-
Application: ImmunofluorescenceSample Tested:Species: MouseVerified Customer | Posted 07/22/2013Iba1 in C57BL/6 Cortex
-
Application: ImmunofluorescenceSample Tested: brain and spinal cordSpecies: RatVerified Customer | Posted 07/16/2012
-
Application: ImmunofluorescenceVerified Customer | Posted 06/26/2012confocal laser scanning microscope Nikon eC1 plus
There are no reviews that match your criteria.
Protocols
Find general support by application which include: protocols, troubleshooting, illustrated assays, videos and webinars.
- Antigen Retrieval Protocol (PIER)
- Antigen Retrieval for Frozen Sections Protocol
- Appropriate Fixation of IHC/ICC Samples
- Cellular Response to Hypoxia Protocols
- Chromogenic IHC Staining of Formalin-Fixed Paraffin-Embedded (FFPE) Tissue Protocol
- Chromogenic Immunohistochemistry Staining of Frozen Tissue
- ClariTSA™ Fluorophore Kits
- Detection & Visualization of Antibody Binding
- ELISA Sample Preparation & Collection Guide
- ELISA Troubleshooting Guide
- Fluorescent IHC Staining of Frozen Tissue Protocol
- Graphic Protocol for Heat-induced Epitope Retrieval
- Graphic Protocol for the Preparation and Fluorescent IHC Staining of Frozen Tissue Sections
- Graphic Protocol for the Preparation and Fluorescent IHC Staining of Paraffin-embedded Tissue Sections
- Graphic Protocol for the Preparation of Gelatin-coated Slides for Histological Tissue Sections
- How to Run an R&D Systems DuoSet ELISA
- How to Run an R&D Systems Quantikine ELISA
- How to Run an R&D Systems Quantikine™ QuicKit™ ELISA
- ICC Cell Smear Protocol for Suspension Cells
- ICC Immunocytochemistry Protocol Videos
- ICC for Adherent Cells
- IHC Sample Preparation (Frozen sections vs Paraffin)
- ISH-IHC Protocol for Chromogenic Detection on Formalin Fixed Paraffin Embedded (FFPE) Tissue
- Immunocytochemistry (ICC) Protocol
- Immunocytochemistry Troubleshooting
- Immunofluorescence of Organoids Embedded in Cultrex Basement Membrane Extract
- Immunofluorescent IHC Staining of Formalin-Fixed Paraffin-Embedded (FFPE) Tissue Protocol
- Immunohistochemistry (IHC) and Immunocytochemistry (ICC) Protocols
- Immunohistochemistry Frozen Troubleshooting
- Immunohistochemistry Paraffin Troubleshooting
- Preparing Samples for IHC/ICC Experiments
- Preventing Non-Specific Staining (Non-Specific Binding)
- Primary Antibody Selection & Optimization
- Protocol for Heat-Induced Epitope Retrieval (HIER)
- Protocol for Making a 4% Formaldehyde Solution in PBS
- Protocol for VisUCyte™ HRP Polymer Detection Reagent
- Protocol for the Fluorescent ICC Staining of Cell Smears - Graphic
- Protocol for the Fluorescent ICC Staining of Cultured Cells on Coverslips - Graphic
- Protocol for the Preparation & Fixation of Cells on Coverslips
- Protocol for the Preparation and Chromogenic IHC Staining of Frozen Tissue Sections
- Protocol for the Preparation and Chromogenic IHC Staining of Frozen Tissue Sections - Graphic
- Protocol for the Preparation and Chromogenic IHC Staining of Paraffin-embedded Tissue Sections
- Protocol for the Preparation and Chromogenic IHC Staining of Paraffin-embedded Tissue Sections - Graphic
- Protocol for the Preparation and Fluorescent ICC Staining of Cells on Coverslips
- Protocol for the Preparation and Fluorescent ICC Staining of Non-adherent Cells
- Protocol for the Preparation and Fluorescent ICC Staining of Stem Cells on Coverslips
- Protocol for the Preparation and Fluorescent IHC Staining of Frozen Tissue Sections
- Protocol for the Preparation and Fluorescent IHC Staining of Paraffin-embedded Tissue Sections
- Protocol for the Preparation of Gelatin-coated Slides for Histological Tissue Sections
- Protocol for the Preparation of a Cell Smear for Non-adherent Cell ICC - Graphic
- Quantikine HS ELISA Kit Assay Principle, Alkaline Phosphatase
- Quantikine HS ELISA Kit Principle, Streptavidin-HRP Polymer
- R&D Systems Quality Control Western Blot Protocol
- Sandwich ELISA (Colorimetric) – Biotin/Streptavidin Detection Protocol
- Sandwich ELISA (Colorimetric) – Direct Detection Protocol
- TUNEL and Active Caspase-3 Detection by IHC/ICC Protocol
- The Importance of IHC/ICC Controls
- Troubleshooting Guide: ELISA
- Troubleshooting Guide: Immunohistochemistry
- Troubleshooting Guide: Western Blot Figures
- Western Blot Conditions
- Western Blot Protocol
- Western Blot Protocol for Cell Lysates
- Western Blot Troubleshooting
- Western Blot Troubleshooting Guide
- View all Protocols, Troubleshooting, Illustrated assays and Webinars
FAQs for AIF-1/Iba1 Antibody
Showing
1
-
2 of
2 FAQs
Showing All
-
Q: The experimental method in the NB100-1028 instruction is not clear. We use frozen sections of brain tissue. But we can't produce satisfactory results. Could you provide us with a set of experimental methods in detail to help us get the results of the experiment?
A:
With regards to this AIF-1/Iba1 Antibody NB100-1028, we unfortunately do not have any suggested protocol for this product. If you would like, you can please refer to our general protocol
-
Q: What is the volume of the sample size (NB100-1028SS)?
A: According to our datasheet, NB100-1028SS is a package containing 0.02 mg, with the concentration of 0.5 mg/ml. Therefore, the vial should contain 40 ul.
-
Q: The experimental method in the NB100-1028 instruction is not clear. We use frozen sections of brain tissue. But we can't produce satisfactory results. Could you provide us with a set of experimental methods in detail to help us get the results of the experiment?
A:
With regards to this AIF-1/Iba1 Antibody NB100-1028, we unfortunately do not have any suggested protocol for this product. If you would like, you can please refer to our general protocol
-
Q: What is the volume of the sample size (NB100-1028SS)?
A: According to our datasheet, NB100-1028SS is a package containing 0.02 mg, with the concentration of 0.5 mg/ml. Therefore, the vial should contain 40 ul.
Loading...