
Key Product Details
Species Reactivity
Validated:
Mouse
Cited:
Human, Mouse, Drosophila, Frog - Xenopus (African Clawed Frog), Transgenic Mouse
Applications
Validated:
Immunohistochemistry, Western Blot
Cited:
Immunohistochemistry, Immunohistochemistry-Paraffin, Western Blot, Immunocytochemistry/Immunofluorescence, Immunocytochemistry, Immunoprecipitation, Chromatin Immunoprecipitation, IF/ICC
Label
Unconjugated
Antibody Source
Polyclonal Goat IgG
Loading...
Product Specifications
Immunogen
E. coli-derived recombinant mouse GLI-2
Met1-Glu416
Accession # NP_001074594
Met1-Glu416
Accession # NP_001074594
Specificity
Detects mouse GLI-2 in direct ELISAs and Western blots.
Clonality
Polyclonal
Host
Goat
Isotype
IgG
Scientific Data Images for Mouse GLI-2 Antibody
GLI‑2 in Mouse Embryo.
GLI-2 was detected in immersion fixed frozen sections of mouse embryo (15 d.p.c.) using Goat Anti-Mouse GLI-2 Antigen Affinity-purified Polyclonal Antibody (Catalog # AF3635) at 15 µg/mL overnight at 4 °C. Tissue was stained using the Anti-Goat HRP-DAB Cell & Tissue Staining Kit (brown; Catalog # CTS008) and counterstained with hematoxylin (blue). Lower panel shows a lack of labeling when primary antibodies are omitted and tissue is stained only with secondary antibody followed by incubation with detection reagents. Specific staining was localized to developing muscle. View our protocol for Chromogenic IHC Staining of Frozen Tissue Sections.
Detection of GLI-2 by Western Blot
The PY-type nuclear localization signal (PY-NLS) is required for Gli activation.(A) Western blot of cell lysates from the indicated cell lines indicated that Myc-Gli2WT and Myc-Gli2mPY were expressed at comparable levels that were slightly higher than that of endogenous Gli2. (B–C) Normalized mRNA levels of endogenous Gli1 (B) or Patch1 (C) measured by quantitative reverse transcription PCR (RT-qPCR) in control (green fluorescent protein [GFP] short hairpin RNA [shRNA]) or Gli2-depeleted NIH3T3 cells with or without lentiviral infection of the indicated Gli2 constructs. (D) Fractionation of Myc-Gli2WT and Myc-Gli2mPY from the indicated cell lines treated with or without SAG. Quantification of protein level is shown in the bottom panel. (E–F) Immunostaining (E) and quantification (F) of ciliary-localized Myc-Gli2WT or Myc-Gli2mPY in NIH3T3mGli2-shRNA cells treated with or without sonic hedgehog (Shh). N = 50 cells were examined for each Gli construct. Data are means ± SD from 2 independent experiments. **P < 0.01. (G) Gli-luciferase assay was performed in NIH3T3 cells transfected with the indicated constructs. Data are means ± SD from 2 independent experiments. *P < 0.05, NS: not significant. The underlying data for this figure can be found in S1 Data. Image collected and cropped by CiteAb from the following open publication (https://pubmed.ncbi.nlm.nih.gov/28777795), licensed under a CC-BY license. Not internally tested by R&D Systems.
Detection of Mouse GLI-2 by Western Blot
HPP-9 is a long-acting Hedgehog pathway inhibitor.a SHH-GFP cells were treated for 25 h with DMSO, 1 μM HPI-1, or 1 μM HPP-9, before the medium was changed to various dilutions of ShhN-conditioned medium for 27 h. Nuclear GFP levels were quantified using fluorescence microscopy. Representative curves of three independent experiments are shown, with 9–16 images analyzed per condition. b GLI1 and GLI2 levels of cells pre-incubated with DMSO or 1 μM HPP-9 were determined. Representative blots of three independent experiments are shown. c, d The effect of 1 μM HPP-9 or HPI-1 (pre-)incubation on GLI2 ciliary trafficking was assessed through fluorescence microscopy. Representative images for GLI2 trafficking are shown in (c), and all data is quantified in (d). N independent experiments as indicated in the bars, n = 300–500 cilia analyzed per condition. Mean ± SD is plotted, two-way ANOVA, p as indicated. Scalebar 2 μm. e SHH-GFP cells were incubated with the indicated compounds for 25 h, before the medium was changed to ShhN-conditioned medium with or without competitors for 27 h. Nuclear BRD protein levels were determined using high-content fluorescence microscopy. Data shown is from N independent experiments as indicated, with n = 9–16 images analyzed per condition in each experiment. Source data are provided as a Source Data file. Image collected and cropped by CiteAb from the following open publication (https://pubmed.ncbi.nlm.nih.gov/37393376), licensed under a CC-BY license. Not internally tested by R&D Systems.
Detection of Mouse GLI-2 by Western Blot
Biological evaluation of HPP-9 and its inactive analog.a Chemical structures of HPP-9 and the methylated analog inact-HPP-9. b Representative micrographs showing the dose-dependent inhibition of an Shh-driven GFP reporter by HPP-9, resulting in the dose-response curves shown in (c). Scalebar 30 μm. b, c Curves and images are representative of N independent experiments (as indicated in the table below the graph), with n = 9 or 18 images analyzed per experiment. d, e NIH-3T3 cells were incubated with increasing concentrations of HPP-9 or HPI-1 in the presence of ShhN and lysates were probed for GLI1, GLI2, and GLI3. d shows a representative immunoblot illustrating that both compounds inhibit GLI1 and GLI2 but have no effect on GLI3 processing. e Quantification (mean ± SEM) of GLI1 (N = 3) and GLI2 full-length levels (N = 2) of N independent experiments. f–h qPCR for Ptch1 (f), Gli1 (g), and Gli2 (h) shows that HPP-9 reduces the expression of Hh pathway target genes, while also decreasing basal Gli2 transcript levels without affecting the fold-induction upon pathway stimulation (−: no ShhN, +: with ShhN). Data shown is the mean (f) or mean ± SD (g, h) for N independent experiments as indicated in the bar. f, g One-way ANOVA with Dunnett’s test, p as indicated in the graph, compared to DMSO + ShhN. Source data are provided as a Source Data file. Image collected and cropped by CiteAb from the following open publication (https://pubmed.ncbi.nlm.nih.gov/37393376), licensed under a CC-BY license. Not internally tested by R&D Systems.
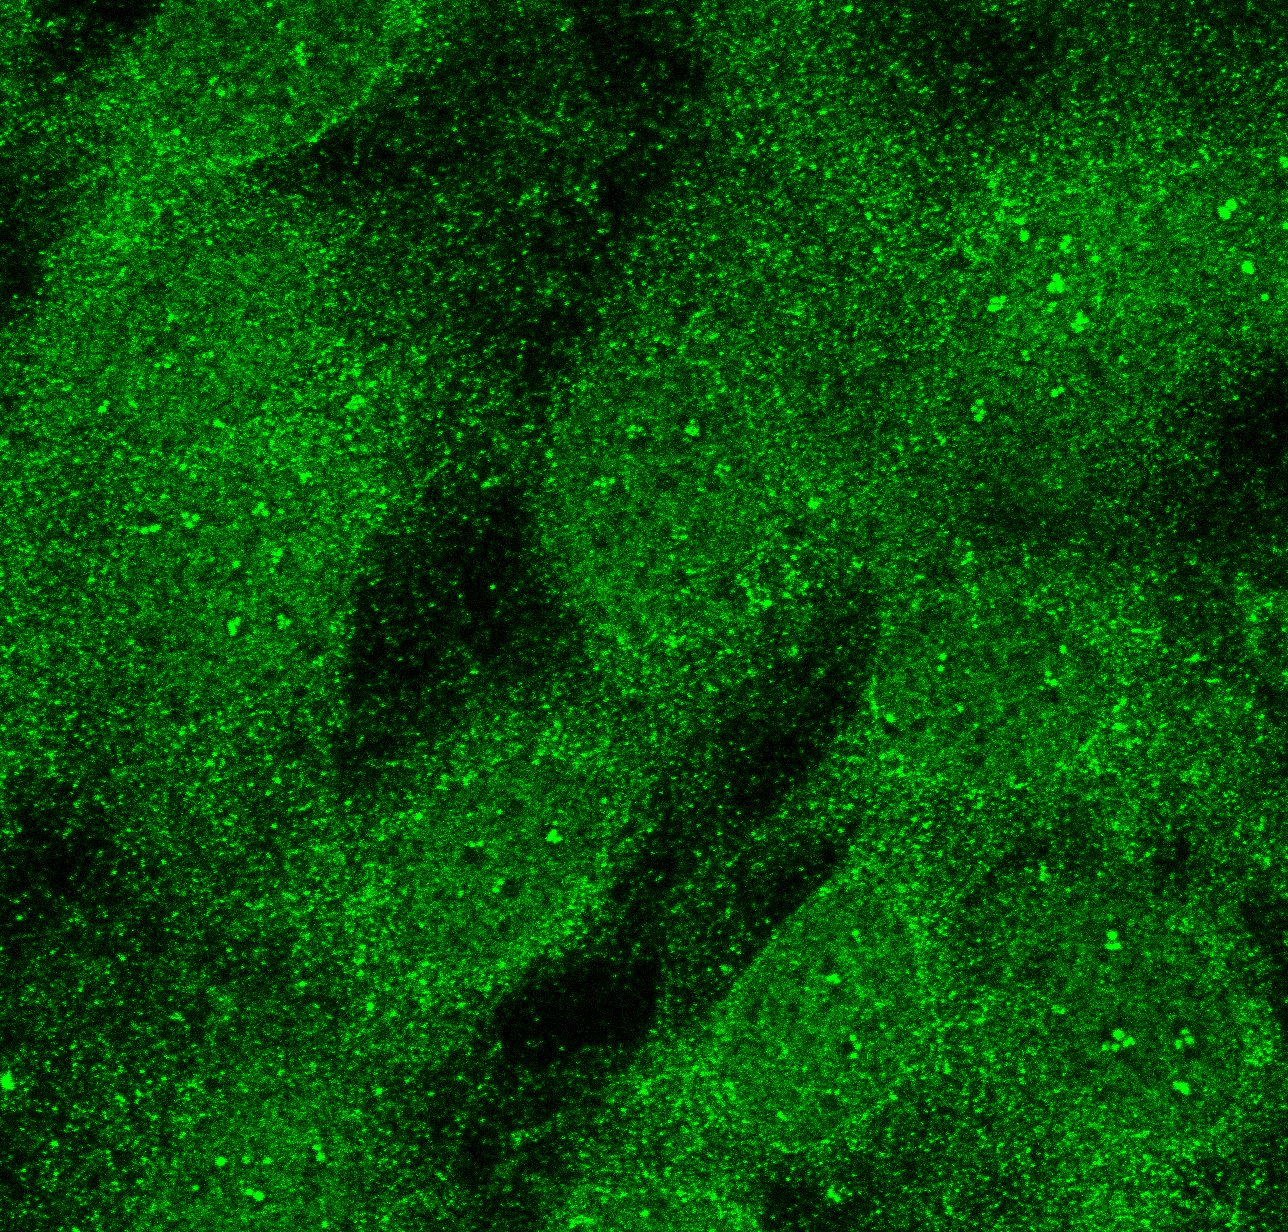
Detection of Mouse GLI-2 by Western Blot
HPP-9 is a long-acting Hedgehog pathway inhibitor.a SHH-GFP cells were treated for 25 h with DMSO, 1 μM HPI-1, or 1 μM HPP-9, before the medium was changed to various dilutions of ShhN-conditioned medium for 27 h. Nuclear GFP levels were quantified using fluorescence microscopy. Representative curves of three independent experiments are shown, with 9–16 images analyzed per condition. b GLI1 and GLI2 levels of cells pre-incubated with DMSO or 1 μM HPP-9 were determined. Representative blots of three independent experiments are shown. c, d The effect of 1 μM HPP-9 or HPI-1 (pre-)incubation on GLI2 ciliary trafficking was assessed through fluorescence microscopy. Representative images for GLI2 trafficking are shown in (c), and all data is quantified in (d). N independent experiments as indicated in the bars, n = 300–500 cilia analyzed per condition. Mean ± SD is plotted, two-way ANOVA, p as indicated. Scalebar 2 μm. e SHH-GFP cells were incubated with the indicated compounds for 25 h, before the medium was changed to ShhN-conditioned medium with or without competitors for 27 h. Nuclear BRD protein levels were determined using high-content fluorescence microscopy. Data shown is from N independent experiments as indicated, with n = 9–16 images analyzed per condition in each experiment. Source data are provided as a Source Data file. Image collected and cropped by CiteAb from the following open publication (https://pubmed.ncbi.nlm.nih.gov/37393376), licensed under a CC-BY license. Not internally tested by R&D Systems.Applications for Mouse GLI-2 Antibody
Application
Recommended Usage
Immunohistochemistry
5-15 µg/mL
Sample: Immersion fixed frozen sections of mouse embryo (15 d.p.c.)
Sample: Immersion fixed frozen sections of mouse embryo (15 d.p.c.)
Western Blot
0.1 µg/mL
Sample: Recombinant Mouse GLI‑2
Sample: Recombinant Mouse GLI‑2
Reviewed Applications
Read 5 reviews rated 3.4 using AF3635 in the following applications:
Formulation, Preparation, and Storage
Purification
Antigen Affinity-purified
Reconstitution
Reconstitute at 0.2 mg/mL in sterile PBS. For liquid material, refer to CoA for concentration.
Loading...
Formulation
Lyophilized from a 0.2 μm filtered solution in PBS with Trehalose. *Small pack size (SP) is supplied either lyophilized or as a 0.2 µm filtered solution in PBS.
Shipping
Lyophilized product is shipped at ambient temperature. Liquid small pack size (-SP) is shipped with polar packs. Upon receipt, store immediately at the temperature recommended below.
Stability & Storage
Use a manual defrost freezer and avoid repeated freeze-thaw cycles.
- 12 months from date of receipt, -20 to -70 °C as supplied.
- 1 month, 2 to 8 °C under sterile conditions after reconstitution.
- 6 months, -20 to -70 °C under sterile conditions after reconstitution.
Calculators
Background: GLI-2
Long Name
GLI-Kruppel family member GLI2
Alternate Names
GLI2, THP2
Gene Symbol
GLI2
UniProt
Additional GLI-2 Products
Product Documents for Mouse GLI-2 Antibody
Certificate of Analysis
To download a Certificate of Analysis, please enter a lot or batch number in the search box below.
Note: Certificate of Analysis not available for kit components.
Product Specific Notices for Mouse GLI-2 Antibody
For research use only
Related Research Areas
Citations for Mouse GLI-2 Antibody
 Powered by Bioz
Customer Reviews for Mouse GLI-2 Antibody (5)
3.4 out of 5
5 Customer Ratings
Have you used Mouse GLI-2 Antibody?
Submit a review and receive an Amazon gift card!
$25/€18/£15/$25CAN/¥2500 Yen for a review with an image
$10/€7/£6/$10CAN/¥1110 Yen for a review without an image
Submit a review
Customer Images
Showing
1
-
5 of
5 reviews
Showing All
Filter By:
-
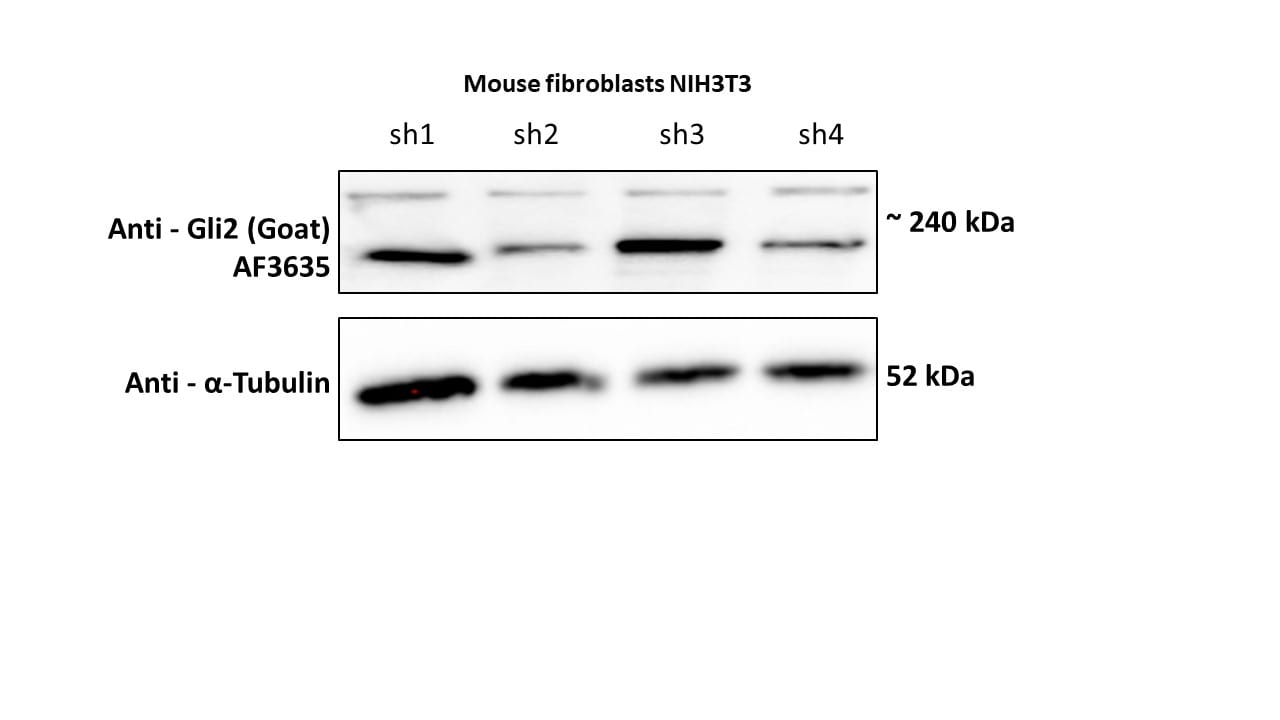
Application: Western BlotSample Tested: NIH-3T3 mouse embryonic fibroblast cell lineSpecies: MouseVerified Customer | Posted 08/02/2020

-
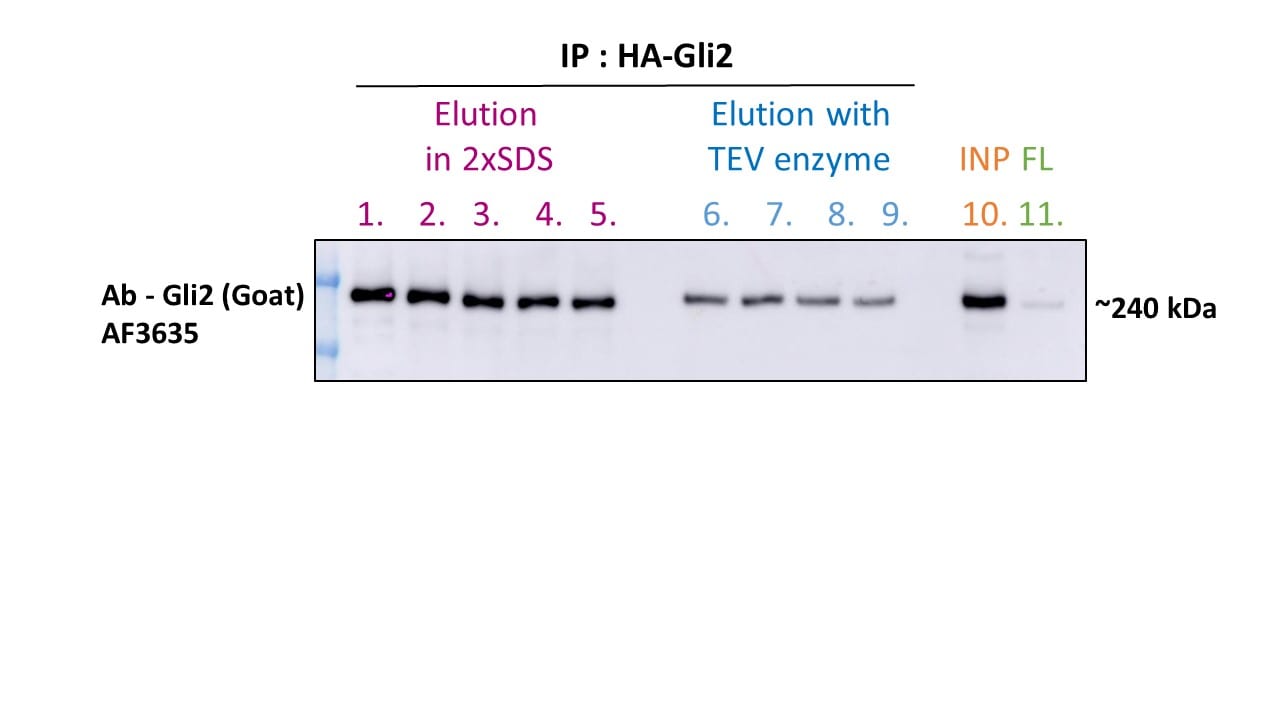
Application: ImmunoprecipitationSample Tested: NIH-3T3 mouse embryonic fibroblast cell lineSpecies: MouseVerified Customer | Posted 07/22/2020
-
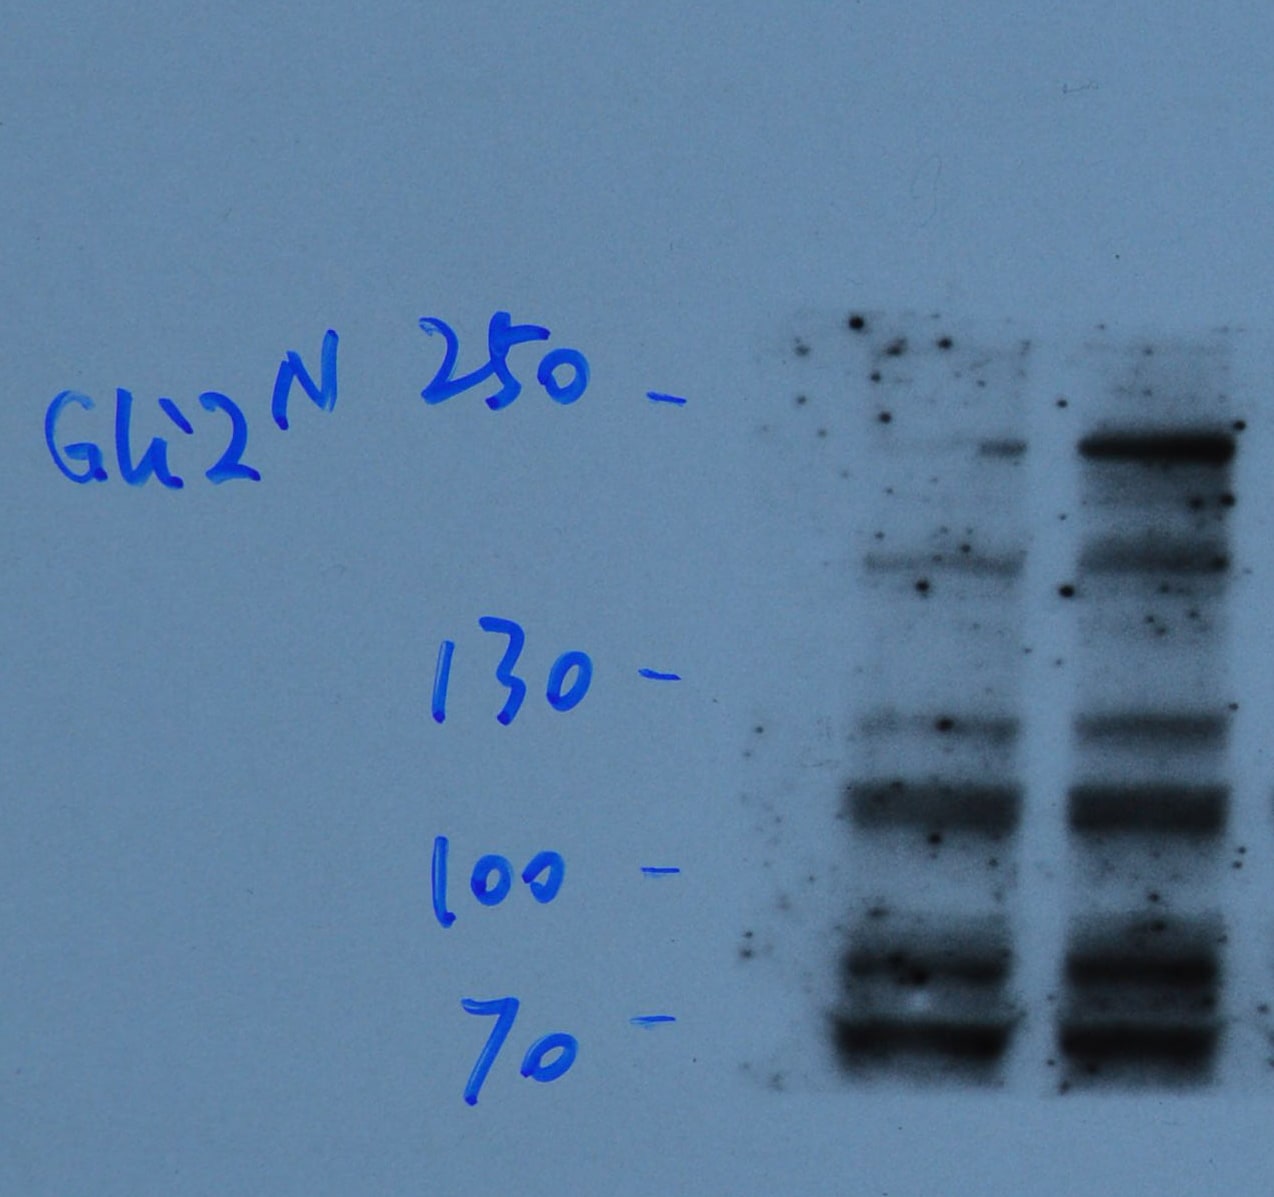
Application: Western BlotSample Tested: MEF (fibroblast)Species: MouseVerified Customer | Posted 07/08/2019This antibody recognizes many bands, and the major expected bands are not stronger (or maybe much weaker) than those non-specific bands.
Bio-Techne ResponseThank you for reviewing our product. We are sorry to hear that this antibody did not perform as expected. We have been in touch with the customer to resolve this issue according to our Product Guarantee and to the customer’s satisfaction.
-
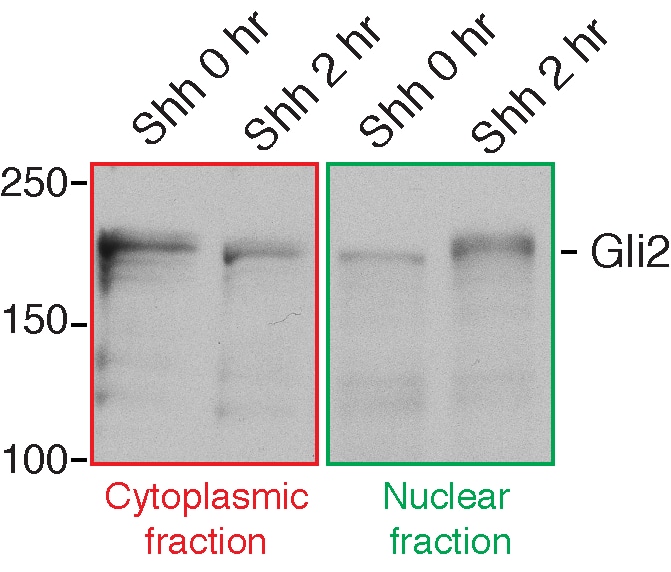
Application: Western BlotSample Tested: NIH-3T3 cellsSpecies: MouseVerified Customer | Posted 11/13/2015Gli2 Western blot
-
Application: ImmunofluorescenceSample Tested: NIH-3T3 cellsSpecies: MouseVerified Customer | Posted 11/13/2015Immunofluorescence staining of Gli2
There are no reviews that match your criteria.
Protocols
Find general support by application which include: protocols, troubleshooting, illustrated assays, videos and webinars.
- Antigen Retrieval Protocol (PIER)
- Antigen Retrieval for Frozen Sections Protocol
- Appropriate Fixation of IHC/ICC Samples
- Cellular Response to Hypoxia Protocols
- Chromogenic IHC Staining of Formalin-Fixed Paraffin-Embedded (FFPE) Tissue Protocol
- Chromogenic Immunohistochemistry Staining of Frozen Tissue
- ClariTSA™ Fluorophore Kits
- Detection & Visualization of Antibody Binding
- Fluorescent IHC Staining of Frozen Tissue Protocol
- Graphic Protocol for Heat-induced Epitope Retrieval
- Graphic Protocol for the Preparation and Fluorescent IHC Staining of Frozen Tissue Sections
- Graphic Protocol for the Preparation and Fluorescent IHC Staining of Paraffin-embedded Tissue Sections
- Graphic Protocol for the Preparation of Gelatin-coated Slides for Histological Tissue Sections
- IHC Sample Preparation (Frozen sections vs Paraffin)
- Immunofluorescent IHC Staining of Formalin-Fixed Paraffin-Embedded (FFPE) Tissue Protocol
- Immunohistochemistry (IHC) and Immunocytochemistry (ICC) Protocols
- Immunohistochemistry Frozen Troubleshooting
- Immunohistochemistry Paraffin Troubleshooting
- Preparing Samples for IHC/ICC Experiments
- Preventing Non-Specific Staining (Non-Specific Binding)
- Primary Antibody Selection & Optimization
- Protocol for Heat-Induced Epitope Retrieval (HIER)
- Protocol for Making a 4% Formaldehyde Solution in PBS
- Protocol for VisUCyte™ HRP Polymer Detection Reagent
- Protocol for the Preparation & Fixation of Cells on Coverslips
- Protocol for the Preparation and Chromogenic IHC Staining of Frozen Tissue Sections
- Protocol for the Preparation and Chromogenic IHC Staining of Frozen Tissue Sections - Graphic
- Protocol for the Preparation and Chromogenic IHC Staining of Paraffin-embedded Tissue Sections
- Protocol for the Preparation and Chromogenic IHC Staining of Paraffin-embedded Tissue Sections - Graphic
- Protocol for the Preparation and Fluorescent IHC Staining of Frozen Tissue Sections
- Protocol for the Preparation and Fluorescent IHC Staining of Paraffin-embedded Tissue Sections
- Protocol for the Preparation of Gelatin-coated Slides for Histological Tissue Sections
- R&D Systems Quality Control Western Blot Protocol
- TUNEL and Active Caspase-3 Detection by IHC/ICC Protocol
- The Importance of IHC/ICC Controls
- Troubleshooting Guide: Immunohistochemistry
- Troubleshooting Guide: Western Blot Figures
- Western Blot Conditions
- Western Blot Protocol
- Western Blot Protocol for Cell Lysates
- Western Blot Troubleshooting
- Western Blot Troubleshooting Guide
- View all Protocols, Troubleshooting, Illustrated assays and Webinars
Loading...