Best Seller

Mouse IgG1 Isotype Control (11711)

R&D Systems | Catalog # MAB002

R&D Systems

Key Product Details

Species Reactivity

Mouse

Applications

Control

Label

Unconjugated

Antibody Source

Monoclonal Mouse IgG1 kappa Clone # 11711
Loading...

Product Specifications

Immunogen

KLH

Specificity

Selected for use as mouse IgG

Clonality

Monoclonal

Host

Mouse

Isotype

IgG1 kappa

Endotoxin Level

<0.10 EU per 1 μg of the antibody by the LAL method.

Scientific Data Images for Mouse IgG1 Isotype Control (11711)

Detection of Mouse IgG1Isotype Isotype Control by Flow Cytometry

Detection of Mouse IgG1Isotype Control by Flow Cytometry

Human peripheral blood mononuclear cells (PBMCs) were stained with Mouse Anti-Human LILRA6/CD85b Monoclonal Antibody (Catalog # MAB8656, filled histogram) or Mouse IgG1Isotype Control Antibody (Catalog # MAB002, open histogram), followed by Allophycocyanin-conjugated Anti-Mouse IgG Secondary Antibody (Catalog # F0101B).
Detection of Human IgG1 by Flow Cytometry

Detection of Human IgG1 by Flow Cytometry

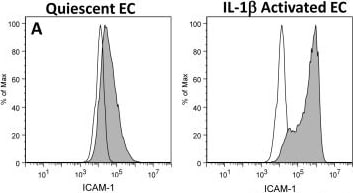
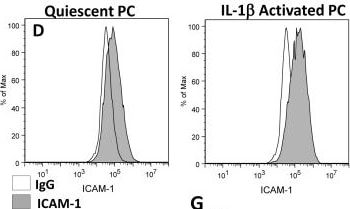
EC and PC ICAM-1 expression and effects of CD18 blocking on neutrophil adhesion.ICAM-1 expression on (A) EC or (D) PC monolayers before and after 4 hr IL-1 beta activation was assessed by flow cytometry (IgG labeled control white). ICAM-1 expression on (B,C) EC and (E,F) PC following 4 hr IL-1 beta activation was imaged using confocal microscopy. Scale bars are 20 µm. (G) Neutrophil adhesion inhibition to IL-1 beta activated EC or PC monolayers. Freshly isolated neutrophils were pre-incubated with anti-Mac-1 or anti-LFA-1 antibodies and seeded onto EC or PC monolayers (activated for 4 with IL-1 beta ) in Sykes-Moore chambers and allowed to adhere prior to counting. Bars represent average neutrophil adhesion ± SEM. *P<0.05, when compared to the no block control. Image collected and cropped by CiteAb from the following publication (https://dx.plos.org/10.1371/journal.pone.0060025), licensed under a CC-BY license. Not internally tested by R&D Systems.
Detection of Human IgG1 by Flow Cytometry

Detection of Human IgG1 by Flow Cytometry

EC and PC ICAM-1 expression and effects of CD18 blocking on neutrophil adhesion.ICAM-1 expression on (A) EC or (D) PC monolayers before and after 4 hr IL-1 beta activation was assessed by flow cytometry (IgG labeled control white). ICAM-1 expression on (B,C) EC and (E,F) PC following 4 hr IL-1 beta activation was imaged using confocal microscopy. Scale bars are 20 µm. (G) Neutrophil adhesion inhibition to IL-1 beta activated EC or PC monolayers. Freshly isolated neutrophils were pre-incubated with anti-Mac-1 or anti-LFA-1 antibodies and seeded onto EC or PC monolayers (activated for 4 with IL-1 beta ) in Sykes-Moore chambers and allowed to adhere prior to counting. Bars represent average neutrophil adhesion ± SEM. *P<0.05, when compared to the no block control. Image collected and cropped by CiteAb from the following publication (https://dx.plos.org/10.1371/journal.pone.0060025), licensed under a CC-BY license. Not internally tested by R&D Systems.
Detection of Human IgG1 by Control

Detection of Human IgG1 by Control

miR-720 maintains the migratory and invasive properties of MDA-MB-231 cells. MDA-MB-231 cells were transfected with 50 nM anti-miR-720 or anti-miR-negative control (Ctrl) for 48 h. Either RNA was isolated (a) or transfected cells subjected to functional assays (b–e). a miR-720 levels. RNA was subjected to RT-qPCR for miR-720. Control condition (Ctrl) was set to 1.0 (mean ± SD from three independent experiments). b Migration assay. Transfected cells were subjected to a migration assay in a Boyden chamber over a 24-h period. The cells that migrated through the chamber were quantified using crystal violet staining. Ctrl was set to 100 % (mean ± SD from three independent experiments). c Matrigel assay. Transfected cells were grown in Matrigel for 11–15 days and then photographed using a Nikon eclipse TS100 microscope at 10× magnification. Scale bar = 100 μm. Representative images of two independent experiments with similar results are shown (left panels). The number of branched colonies were counted. The count in the control sample was set to 1.0 (right panel). d Transendothelial migration assay. Transfected MDA-MB-231 cells were plated in a Boyden chamber that had been coated with a confluent monolayer of HUVEC cells, and the cancer cells that invaded through the HUVEC layer over a 24-h period were quantified using crystal violet staining. Ctrl value for transendothelial (transendo.) migration was set to 100 % (mean ± SD from three independent experiments) and relative (Rel.) migration values given. e ATP assay. Transfected cells were grown for 24 h and ATP levels were measured using an ATPlite 1Step assay. Ctrl was set to 100 % (mean ± SD from three independent experiments). *P < 0.05, ***P < 0.001, Student’s t test. Not sig. not significant Image collected and cropped by CiteAb from the following publication (https://pubmed.ncbi.nlm.nih.gov/27039296), licensed under a CC-BY license. Not internally tested by R&D Systems.
Detection of Mouse Mouse IgG1 Isotype Control by Flow Cytometry

Detection of Mouse Mouse IgG1 Isotype Control by Flow Cytometry

Monoclonal ASM antibody (23A12C3) inhibits pathogenic Th17 cell differentiation and protects neuropathological features in APP/PS1 mice. e Representative flow cytometry plot and graph displaying the calculated percentage and mean fluorescent intensity of Th17 cells (CD4+ IL17A+) differentiated from CD4+ T cell in each group (Control, n = 5; Smpd1ox/ox serum/con IgG ab, n = 10; Smpd1ox/ox serum/23A12C3, n = 8). f Western blotting for p-Stat3, p-JNK, p-AKT, p-mTOR in Th17 cells differentiated from CD4+ T cell in each group (n = 4/group). g ASM activity in plasma (n = 5/group). h Percentage of Th17 cells in the spleen, blood, and brain by flow cytometry (n = 5/group). i Quantification of microglia (Iba-1) and astrocyte (GFAP) (n = 5/group). j mRNA levels of inflammatory markers in the cortex and hippocampus (n = 4/group). k Representative immunofluorescence images and quantification of ThioS (A beta plaques) in cortex and hippocampus. Scale bars, 50 μm. (n = 5/group). l Quantification of 6E10 (n = 5/group). m The results of Morris water maze test (n = 10/group). n, o At probe trial day 11, time spent in target platform (n) and the number of times each animal entered the small target zone (o) were analyzed (n = 10/group). p The results of fear-conditioning test (n = 10/group). d–j, m–p One-way analysis of variance, Tukey’s post hoc test. k, l, n Two-tailed student’s t test. All error bars indicate s.e.m. All in vivo data analysis was done at 9-mo-old mice. Source data are provided as a Source Data file. Image collected and cropped by CiteAb from the following publication (https://pubmed.ncbi.nlm.nih.gov/36959217), licensed under a CC-BY license. Not internally tested by R&D Systems.
Detection of IgG1 by Flow Cytometry

Detection of IgG1 by Flow Cytometry

EC and PC ICAM-1 expression and effects of CD18 blocking on neutrophil adhesion.ICAM-1 expression on (A) EC or (D) PC monolayers before and after 4 hr IL-1 beta activation was assessed by flow cytometry (IgG labeled control white). ICAM-1 expression on (B,C) EC and (E,F) PC following 4 hr IL-1 beta activation was imaged using confocal microscopy. Scale bars are 20 µm. (G) Neutrophil adhesion inhibition to IL-1 beta activated EC or PC monolayers. Freshly isolated neutrophils were pre-incubated with anti-Mac-1 or anti-LFA-1 antibodies and seeded onto EC or PC monolayers (activated for 4 with IL-1 beta ) in Sykes-Moore chambers and allowed to adhere prior to counting. Bars represent average neutrophil adhesion ± SEM. *P<0.05, when compared to the no block control. Image collected and cropped by CiteAb from the following open publication (https://pubmed.ncbi.nlm.nih.gov/23555870), licensed under a CC-BY license. Not internally tested by R&D Systems.
Detection of IgG1 by Immunohistochemistry

Detection of IgG1 by Immunohistochemistry

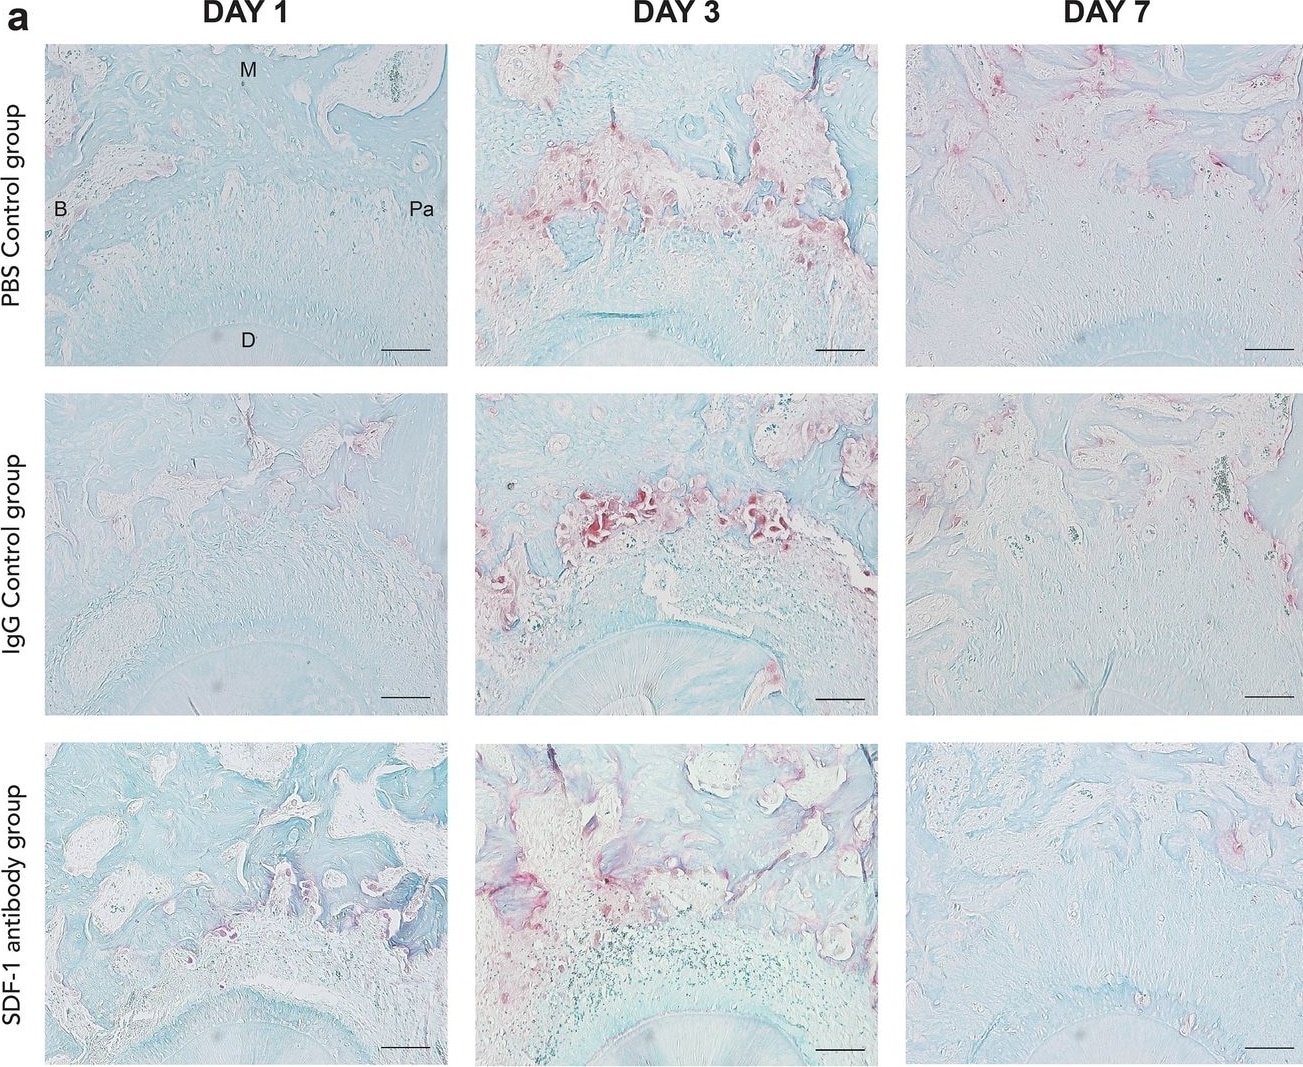
Representative image of tartrate-resistant acid phosphatase (TRAP) staining at the compression side of M2 mesial roots on day 1, 3, and 7. TRAP-positive multinucleated cells were observed abundantly on day 3 in both control groups, whereas less were observed on days 1 and 7 in all groups. Focusing on the compression side of the mesio-palatal root on day 3 of all three groups, the stromal cell-derived factor 1 (SDF-1) antibody group demonstrated less TRAP-positive multinuclear osteoclasts in the PDL compared to the two control groups (a). Number of TRAP-stained cells at the compression side of M2 mesial root on days 1, 3, and 7. Statistically significant differences can be seen on day 3 between the SDF-1 antibody group and the two control groups (b). Scale bars = 50 μm. Abbreviations: B; buccal, M; mesial, Pa; palatal, D; distal. Values are presented as mean ± standard deviation (n = 3). *** p < 0.001. Image collected and cropped by CiteAb from the following open publication (https://www.nature.com/articles/s41598-024-55632-2), licensed under a CC-BY license. Not internally tested by R&D Systems.
Detection of IgG1 by Western Blot

Detection of IgG1 by Western Blot

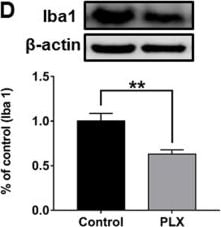
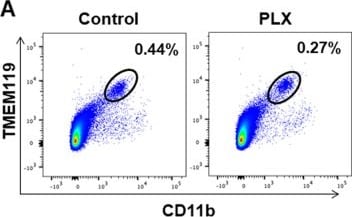
FACS analysis of PFC samples from vehicle or PLX3397 treated mice.a FACS analysis of CD11b-gated cells stained with antibody to TMEM119 in PFC samples of control mice and PLX3397 treated mice. b Iba1 and TGF-beta 1 expression in TMEM119+CD11b+ microglia were analyzed. Red histograms indicate control group and blue histograms indicate PLX3397 treated group. c The fluorescence intensity of both Iba1 and TGF-beta 1 in TMEM119+CD11b+ microglia in the PFC of PLX3397 treated mice was significantly (Iba1: P = 0.0186, TGF-beta 1: P = 0.0002) lower than that of control mice. d Western blot analysis of Iba1 in the PFC samples of control mice and PLX3397 treated mice. Representative bands of Western blot analysis. The expression of Iba1 in the PFC of PLX3397 treated mice was significantly (P = 0.0023) lower than that of control mice. Data are shown as mean ± SEM. (control group: n = 10, PLX group n = 9). *P < 0.05, **P < 0.01, ***P < 0.001. Image collected and cropped by CiteAb from the following open publication (https://pubmed.ncbi.nlm.nih.gov/32066676), licensed under a CC-BY license. Not internally tested by R&D Systems.
Detection of IgG1 by Flow Cytometry

Detection of IgG1 by Flow Cytometry

FACS analysis of PFC samples from vehicle or PLX3397 treated mice.a FACS analysis of CD11b-gated cells stained with antibody to TMEM119 in PFC samples of control mice and PLX3397 treated mice. b Iba1 and TGF-beta 1 expression in TMEM119+CD11b+ microglia were analyzed. Red histograms indicate control group and blue histograms indicate PLX3397 treated group. c The fluorescence intensity of both Iba1 and TGF-beta 1 in TMEM119+CD11b+ microglia in the PFC of PLX3397 treated mice was significantly (Iba1: P = 0.0186, TGF-beta 1: P = 0.0002) lower than that of control mice. d Western blot analysis of Iba1 in the PFC samples of control mice and PLX3397 treated mice. Representative bands of Western blot analysis. The expression of Iba1 in the PFC of PLX3397 treated mice was significantly (P = 0.0023) lower than that of control mice. Data are shown as mean ± SEM. (control group: n = 10, PLX group n = 9). *P < 0.05, **P < 0.01, ***P < 0.001. Image collected and cropped by CiteAb from the following open publication (https://pubmed.ncbi.nlm.nih.gov/32066676), licensed under a CC-BY license. Not internally tested by R&D Systems.
Detection of IgG1 by Immunohistochemistry

Detection of IgG1 by Immunohistochemistry

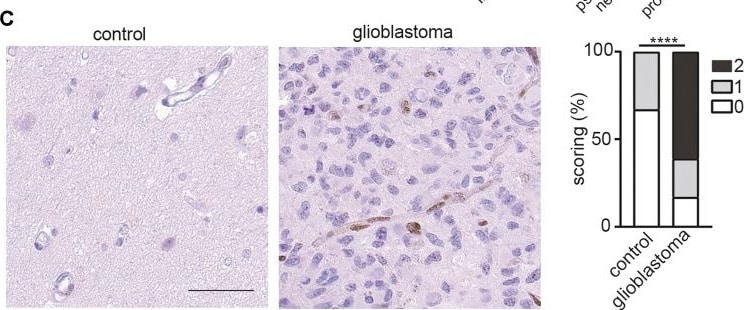
ETS1 is upregulated in tumor endothelial cells in human glioblastoma. (A) Bar plots showing ETS1 expression in tumor endothelial cells (red) and non-malignant brain endothelial cells (blue) (GSE162631). (B) Expression of ETS1 in Ivy GAP RNA-seq of distinct GBM anatomic structures (One-way ANOVA with Tukey’s multiple comparisons test; *p < 0.05, ****p < 0.0001). (C) Immunohistochemical staining and quantification of ETS1 in human GBM and paired non-malignant brain tissue (bar: 50 μm) (n = 18, Mann-Whitney test, ****p < 0.0001). Image collected and cropped by CiteAb from the following open publication (https://pubmed.ncbi.nlm.nih.gov/34867089), licensed under a CC-BY license. Not internally tested by R&D Systems.
Detection of IgG1 by Immunohistochemistry

Detection of IgG1 by Immunohistochemistry

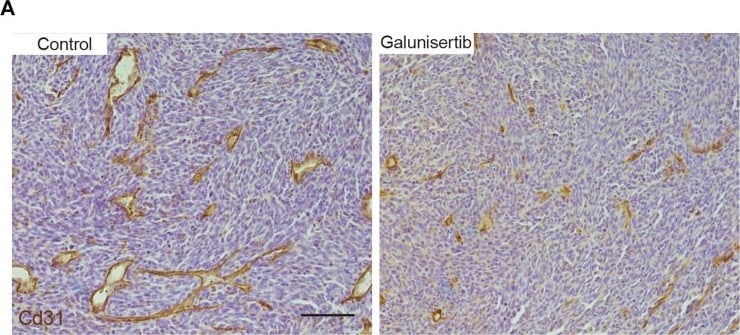
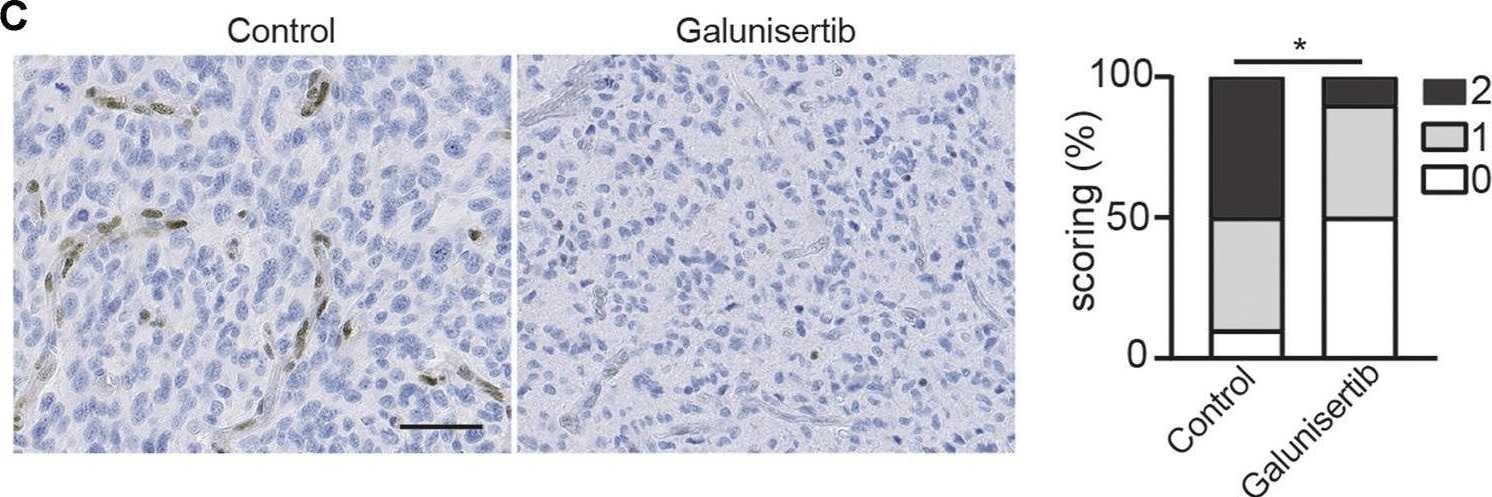
TGF beta inhibition decreases angiogenesis and vascular abnormality in CT-2A glioma. (A) Immunohistochemical staining and quantification of CD31 in CT-2A glioma tumor-bearing mice treated with or without galunisertib (bar: 100 μm). (B, C) Stereological quantification of vessel area (B) and mean vessel diameters (C) in CT-2A glioma tumor-bearing mice treated with or without galunisertib (bar: 100 μm) (n = 10/group, unpaired t test, *p < 0.05). (D) Quantification of mRNA expression of vascular abnormality associated gene including Mcam, Angpt2, Kdr, Vegfa, Sox4, Itga1 and Notch4 in CT-2A glioma tumor-bearing mice treated with or without galunisertib (n = 7/group, unpaired t test, *p < 0.05, **p < 0.01). Image collected and cropped by CiteAb from the following open publication (https://pubmed.ncbi.nlm.nih.gov/34867089), licensed under a CC-BY license. Not internally tested by R&D Systems.
Detection of IgG1 by Flow Cytometry

Detection of IgG1 by Flow Cytometry

EC and PC ICAM-1 expression and effects of CD18 blocking on neutrophil adhesion.ICAM-1 expression on (A) EC or (D) PC monolayers before and after 4 hr IL-1 beta activation was assessed by flow cytometry (IgG labeled control white). ICAM-1 expression on (B,C) EC and (E,F) PC following 4 hr IL-1 beta activation was imaged using confocal microscopy. Scale bars are 20 µm. (G) Neutrophil adhesion inhibition to IL-1 beta activated EC or PC monolayers. Freshly isolated neutrophils were pre-incubated with anti-Mac-1 or anti-LFA-1 antibodies and seeded onto EC or PC monolayers (activated for 4 with IL-1 beta ) in Sykes-Moore chambers and allowed to adhere prior to counting. Bars represent average neutrophil adhesion ± SEM. *P<0.05, when compared to the no block control. Image collected and cropped by CiteAb from the following open publication (https://pubmed.ncbi.nlm.nih.gov/23555870), licensed under a CC-BY license. Not internally tested by R&D Systems.
Detection of IgG1 by Western Blot

Detection of IgG1 by Western Blot

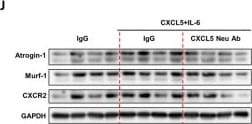
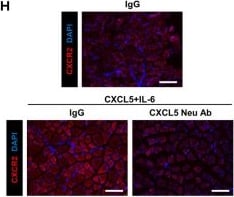
A Schematic of the protocol to investigate CXCL5 neutralization in a model of cytokine-induced skeletal muscle wasting. C57BL6/J mice were treated with 40 ng/kg CXCL5 and 80 ng/kg IL-6 for 4 weeks with or without 120 μg/kg CXCL5 neutralizing antibody. 120 μg/kg IgG1 was used as control. B Body weight at the end point of experiment. C Quadriceps muscle mass. D Gastrocnemius muscle mass. E Tibialis anterior (TA) muscle mass. F Laminin staining of the TA muscle (scale bar = 150 µm). G TA myofiber cross sectional area. H CXCR2 staining of the TA muscle (scale bar = 150 µm). I The proportion of CXCR2 positive fibers in TA muscle. J Western blot analysis of atrogin-1, MuRF-1 and CXCR2 expression in the TA muscle. K Densitometry of atrogin-1, MuRF-1 and CXCR2 expression normalized by the expression of GAPDH. For B–I, 7 mice per group were used for the experiments and for J–K, 4 mice per group were used for the experiments and the analysis was carried out two times. The values were indicated as the mean ± SEM. * = p < 0.05 and ** = p < 0.01 indicate significantly increased or decreased compared to IgG1 control. # = p < 0.05 and ## = p < 0.01 indicate significantly decreased compared to CXCL5 + IL-6 + IgG1. Image collected and cropped by CiteAb from the following open publication (https://link.springer.com/10.1186/s12929-025-01192-0), licensed under a CC-BY license. Not internally tested by R&D Systems.
Detection of IgG1 by Immunohistochemistry

Detection of IgG1 by Immunohistochemistry

A Schematic of the protocol to investigate CXCL5 neutralization in a model of cytokine-induced skeletal muscle wasting. C57BL6/J mice were treated with 40 ng/kg CXCL5 and 80 ng/kg IL-6 for 4 weeks with or without 120 μg/kg CXCL5 neutralizing antibody. 120 μg/kg IgG1 was used as control. B Body weight at the end point of experiment. C Quadriceps muscle mass. D Gastrocnemius muscle mass. E Tibialis anterior (TA) muscle mass. F Laminin staining of the TA muscle (scale bar = 150 µm). G TA myofiber cross sectional area. H CXCR2 staining of the TA muscle (scale bar = 150 µm). I The proportion of CXCR2 positive fibers in TA muscle. J Western blot analysis of atrogin-1, MuRF-1 and CXCR2 expression in the TA muscle. K Densitometry of atrogin-1, MuRF-1 and CXCR2 expression normalized by the expression of GAPDH. For B–I, 7 mice per group were used for the experiments and for J–K, 4 mice per group were used for the experiments and the analysis was carried out two times. The values were indicated as the mean ± SEM. * = p < 0.05 and ** = p < 0.01 indicate significantly increased or decreased compared to IgG1 control. # = p < 0.05 and ## = p < 0.01 indicate significantly decreased compared to CXCL5 + IL-6 + IgG1. Image collected and cropped by CiteAb from the following open publication (https://link.springer.com/10.1186/s12929-025-01192-0), licensed under a CC-BY license. Not internally tested by R&D Systems.
Detection of IgG1 by Immunohistochemistry

Detection of IgG1 by Immunohistochemistry

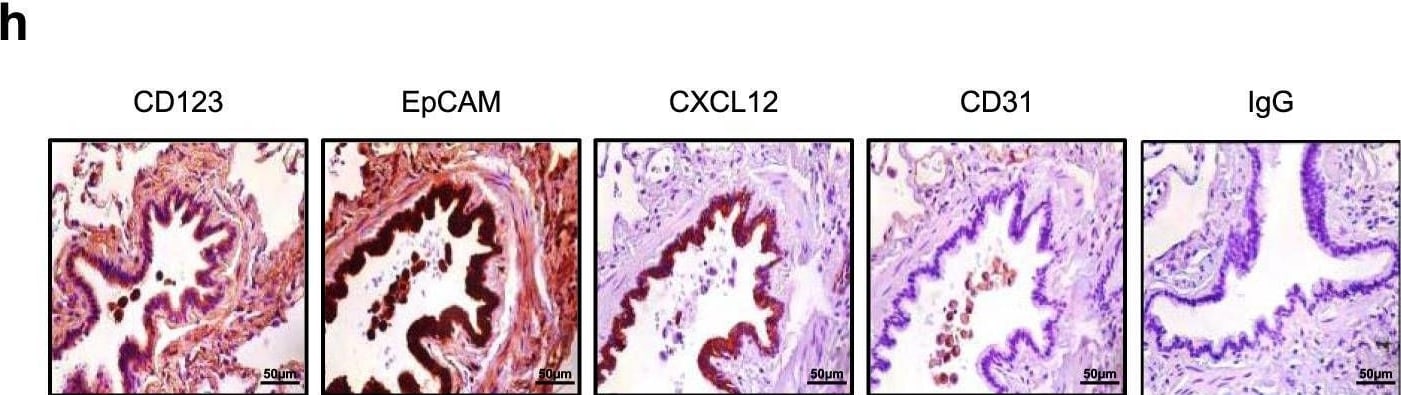
Interleukin-3 promotes the recruitment of pDCs into the lung in a CXCL12-dependent manner.a Relative mRNA expression of Cxcl12 in the lungs of naive mice 24 h after the i.n. injection of PBS or rIL-3. p = 0.0009. n = 11–12. b Level of CXCL12 in the BALF of WT or Cd131−/− mice 24 h after the i.n. injection of PBS or rIL-3. n = 7 for WT (p = 0.0416) and n = 8 for Cd131−/− (p = 0.8046). c Absolute number of pDCs and neutrophils in the lungs of naive mice 24 h after the i.n.injection of PBS, IgG or anti-CXCL12 followed by i.n. injection of PBS (black) or IL-3 (grey). p = 0.0371 for IgG vs alpha CXCL12 and p = 0.437 for PBS vs IgG. n = 8–9. d Correlation between plasma IL-3 and CXCL12 levels of SARS-CoV-2+ patients. n = 181. e Level of CXCL12 in the BALF of patients with pulmonary diseases with high or low IL-3 BALF levels. p = 0.0078. n = 13. f Percentage of pDCs in the BALF of patients with pulmonary diseases with high or low CXCL12 BALF levels. p = 0.0051. n = 12. g Percentage of CXCL12+ epithelial cells in the lungs of patients with pulmonary inflammation. p < 0.0001. n = 16. h Immunohistochemistry of CD123, EpCAM, CXCL12, CD31, and IgG in the lungs of patients with pulmonary inflammation. n = 3 different lungs. Data are mean ± S.E.M., *P < 0.05, **P < 0.01, ***P < 0.001, two-tailed unpaired or Mann–Whitney test were used. Source data are provided as a Source Data file. Image collected and cropped by CiteAb from the following open publication (https://pubmed.ncbi.nlm.nih.gov/33602937), licensed under a CC-BY license. Not internally tested by R&D Systems.
Detection of IgG1 by Flow Cytometry

Detection of IgG1 by Flow Cytometry

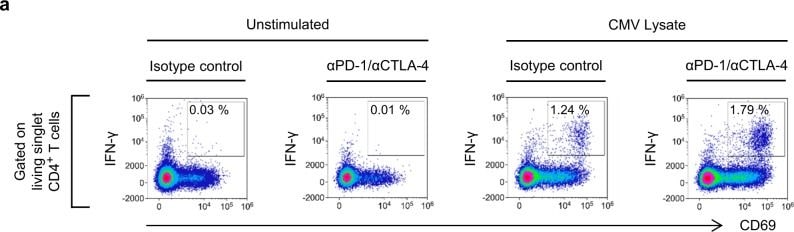
CMV-reactive CD4+ T cells are enriched in patients with CD4+ TEM cell expansion.CMV-reactive CD4+ T cells in patients with unresectable metastatic melanoma were assayed by in vitro stimulation with CMV lysates (blue boxes). Neutralising antibodies (red hatching) were used to detect T cells unable to respond to CMV antigens owing to expression of PD-1 or CTLA-4. T cell responses were quantified by flow cytometry analysis of cytokine expression. a Example data from a CMV IgG+ CD4+ TEM≥16% patient who developed hepatitis. Gating of live, singlet, IFN-gamma -producing CD4+ T cells is illustrated in Supplementary Fig. 11. b Frequencies of IFN-gamma -producing CD4+ T cells in patients categorised according to CMV IgG serostatus and baseline CD4+ TEM frequency (n = 42; two-way ANOVA with Tukey correction for multiple comparisons; n.s. = not significant). Boxplots represent the median, 25th and 75th percentiles, and Tukey whiskers. c Absolute numbers of circulating IFN-gamma -producing CD4+ T cells patients categorised according to CMV IgG serostatus and baseline CD4+ TEM frequency (n = 42; two-way ANOVA with Tukey correction for multiple comparisons; n.s. = not significant). Boxplots represent the median, 25th and 75th percentiles, and Tukey whiskers. Image collected and cropped by CiteAb from the following open publication (https://pubmed.ncbi.nlm.nih.gov/33664251), licensed under a CC-BY license. Not internally tested by R&D Systems.
Detection of IgG1 by Immunohistochemistry

Detection of IgG1 by Immunohistochemistry

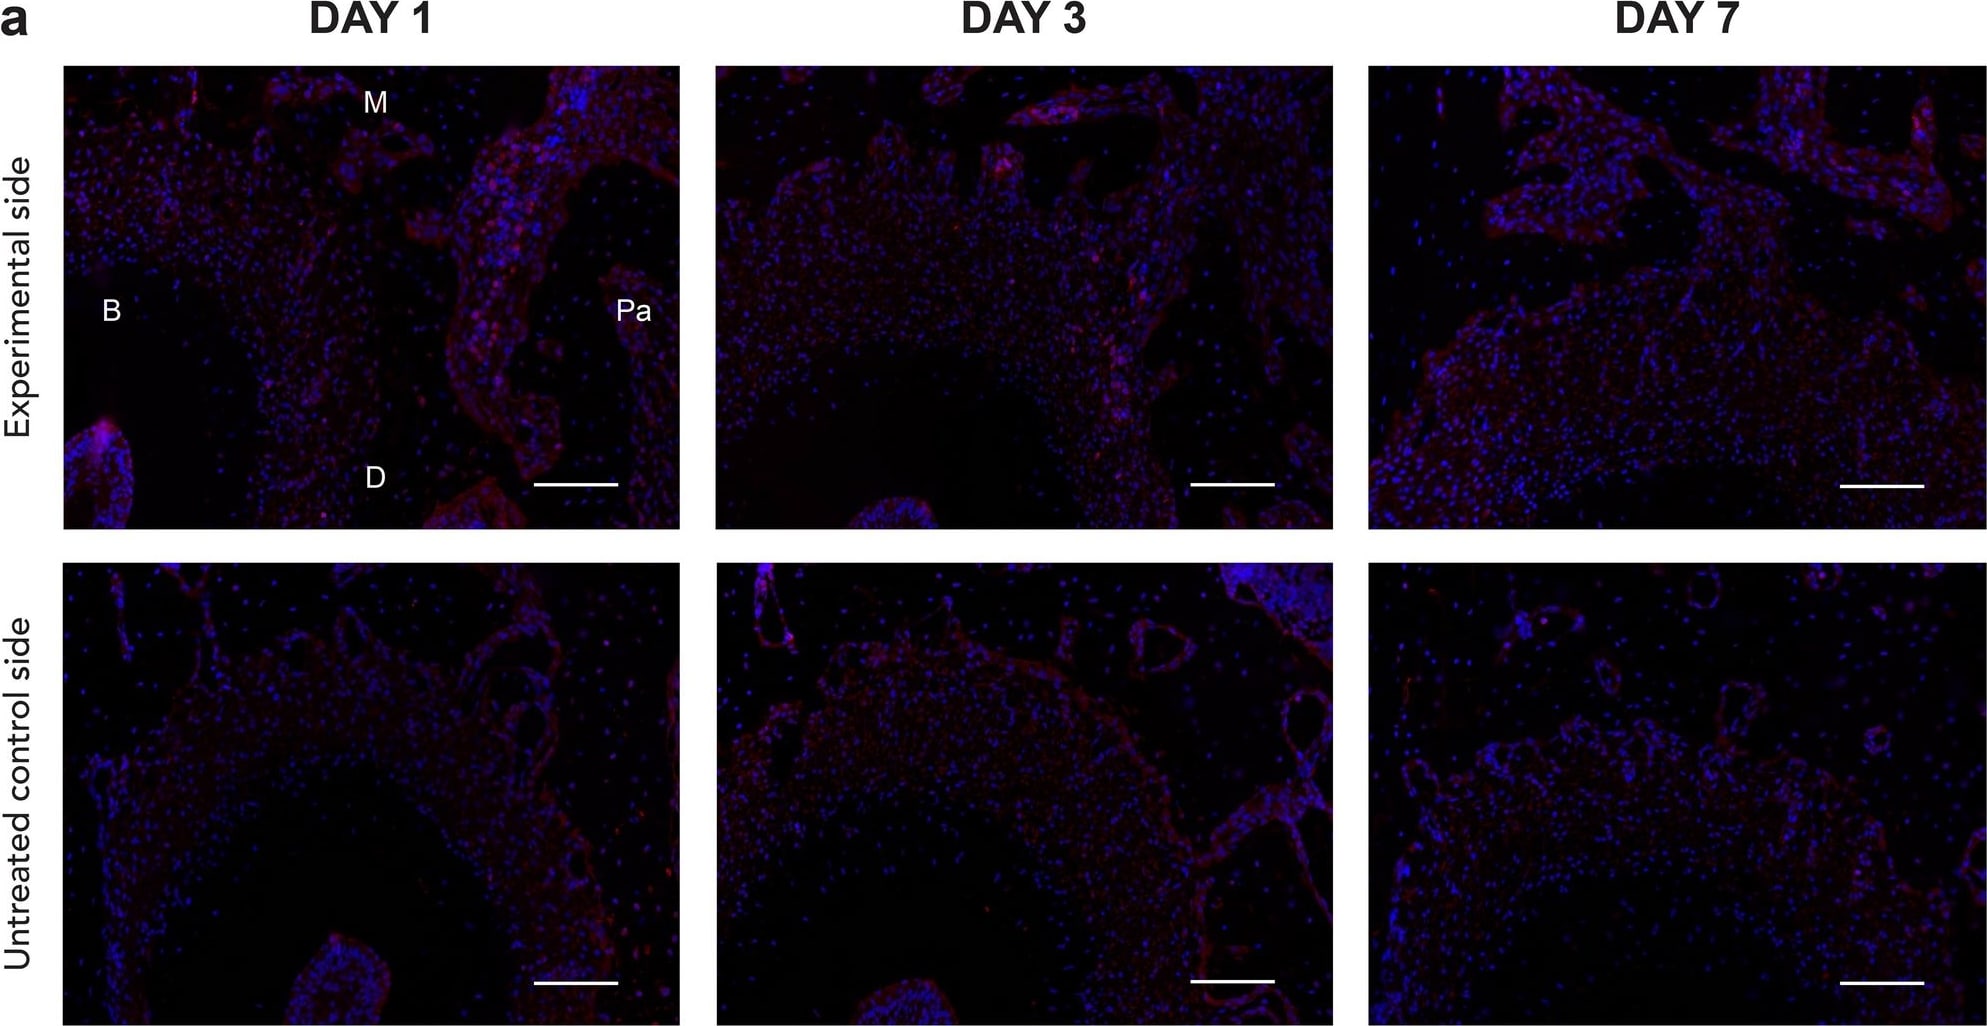
Immunofluorescent evidence of increased stromal cell-derived factor 1 (SDF-1) expression on the experimental side of the left maxillary second molar (M2) mesial root on days 1,3, and 7 (a). SDF-1 immunofluorescence (IF) staining of M2 mesial root at the compression side on day 3 of the experimental side at × 10 and × 20 magnification (b). Positively stained cells with Alexa Fluor® 594 are red, and the nuclei with DAPI are blue. Scale bars = 50 μm. Abbreviations: B, buccal; M, mesial; Pa, palatal; D, distal. Image collected and cropped by CiteAb from the following open publication (https://www.nature.com/articles/s41598-024-55632-2), licensed under a CC-BY license. Not internally tested by R&D Systems.
Detection of IgG1 by Flow Cytometry

Detection of IgG1 by Flow Cytometry

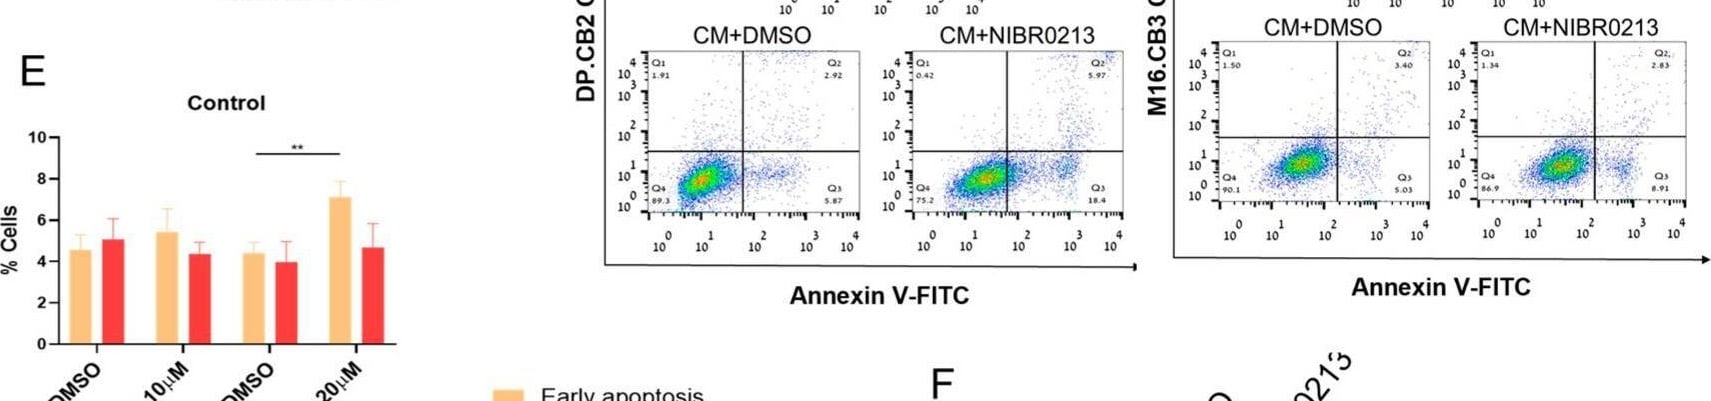
S1P1 regulates the viability of microglia cells and BMMCs. (A,B) Viability of microglia cells treated with NIBR0213 or DMSO for 24 h (A) or of S1P1ctrl and S1P1lo microglia cultured for 24 h (B) was measured by XTT. Bars show mean viability normalized to control + SEM. * p < 0.05. (C) Viability of BMMCs treated with NIBR0213 or DMSO for 24 h, measured by XTT. Bars show mean viability normalized to control + SEM. * p < 0.05, ** p < 0.01. (D,E) Early and late apoptosis of microglia cells exposed to BMMC-conditioned medium (CM) with NIBR0213 or DMSO, assessed by Annexin V/PI staining and flow cytometry. Control microglia cells were treated with NIBR0213 or DMSO in medium. (D) Representative flow cytometry dot plots are shown. (E) Bars show mean percentage of positive cells + SEM. * p < 0.05, ** p < 0.01. (F) Western blot analysis of CH25H in microglia treated with NIBR0213 or DMSO. beta -tubulin served for loading control. Representative blot of CH25H is shown. Bars show mean CH25H expression + SEM. ** p < 0.01. Original western blots are presented in File S1. Image collected and cropped by CiteAb from the following open publication (https://www.mdpi.com/2072-6694/17/19/3175), licensed under a CC-BY license. Not internally tested by R&D Systems.
Detection of IgG1 by Immunohistochemistry

Detection of IgG1 by Immunohistochemistry

Ets1 upregulation in glioblastoma endothelial cells depend on TGF beta signaling. (A) RNA levels of Ets1 in bEND.3 cells treated with VEGFA, TNF alpha or TGF beta (mean + SD of four independent experiments; **p < 0.01; ANOVA with Tukey’s multiple comparisons test). (B) RNA levels of Ets1 in bEND.3 cells treated with conditioned medium from CT-2A glioma cells with TGF beta neutralizing antibody or control antibody (mean + SD of four independent experiments; **p < 0.01; One-way ANOVA with Tukey’s multiple comparisons test). (C) Immunohistochemical staining and quantification of Ets1 in CT-2A glioma tumor-bearing mice treated with/without galunisertib (bar: 50 μm) (n = 10/group, Mann-Whitney test, *p < 0.05). Image collected and cropped by CiteAb from the following open publication (https://pubmed.ncbi.nlm.nih.gov/34867089), licensed under a CC-BY license. Not internally tested by R&D Systems.

Applications for Mouse IgG1 Isotype Control (11711)

Application
Recommended Usage

Control

Negative control for use in conjunction with R&D Systems antibodies. Use at the same concentration as the detection antibody.

Reviewed Applications

Read 24 reviews rated 4.7 using MAB002 in the following applications:

Formulation, Preparation, and Storage

Purification

Protein A or G purified from hybridoma culture supernatant

Reconstitution

Reconstitute at 0.5 mg/mL in sterile PBS.

Formulation

Lyophilized from a 0.2 μm filtered solution in PBS with Trehalose.

Shipping

The product is shipped at ambient temperature. Upon receipt, store it immediately at the temperature recommended below.

Stability & Storage

Use a manual defrost freezer and avoid repeated freeze-thaw cycles.
  • 12 months from date of receipt, -20 to -70 °C as supplied.
  • 1 month, 2 to 8 °C under sterile conditions after reconstitution.
  • 6 months, -20 to -70 °C under sterile conditions after reconstitution.

Calculators

The reconstitution calculator allows you to quickly calculate the volume of a reagent to reconstitute your vial. Simply enter the mass of reagent and the target concentration and the calculator will determine the rest.

=
÷

Background: IgG1

R&D Systems offers a range of secondary antibodies and controls for flow cytometry, immunohistochemistry, and Western blotting. We provide species-specific secondary antibodies that are available with a variety of conjugated labels.

Our NorthernLights fluorescent secondary antibodies are bright and resistant to photobleaching. We are currently offering secondary antibodies recognizing mouse, rat, goat, sheep, and rabbit IgG as well as chicken IgY. These reagents are available with three distinct excitation and emission maxima, making them ideal for multi-color fluorescence microscopy.

Long Name

Immunoglobulin G1

Alternate Names

IgG1, Igh-4, RGD1359539, VH7183

Additional IgG1 Products

Product Documents for Mouse IgG1 Isotype Control (11711)

Certificate of Analysis

To download a Certificate of Analysis, please enter a lot or batch number in the search box below.

Note: Certificate of Analysis not available for kit components.


Can't find your language? Request a SDS in your language here.

Product Specific Notices for Mouse IgG1 Isotype Control (11711)

For research use only

Citations for Mouse IgG1 Isotype Control (11711)

Customer Reviews for Mouse IgG1 Isotype Control (11711) (24)

4.7 out of 5
24 Customer Ratings
5 Stars
67%
4 Stars
33%
3 Stars
0%
2 Stars
0%
1 Stars
0%

Have you used Mouse IgG1 Isotype Control (11711)?

Submit a review and receive an Amazon gift card!

$25/€18/£15/$25CAN/¥2500 for a review with an image

$10/€7/£6/$10CAN/¥1110 for a review without an image

Submit a review
Amazon Gift Card

Customer Images


Showing  1 - 5 of 24 reviews Showing All
Filter By:
  • Mouse IgG1 Isotype Control
    Name: Anonymous
    Application: Cell culture treatment
    Sample Tested: MCF-7 human breast cancer cell line
    Species: Human
    Verified Customer | Posted 05/30/2025
    MCF7 were seeded in 96well plates at 5000 cels/well with 10 ug/mL of antibody.
    Mouse IgG1 Isotype Control (11711) MAB002
  • Mouse IgG1 Isotype Control
    Name: Anonymous
    Application: Cell culture treatment - 5000 cells were treated with 10 ug/mL of antibody
    Sample Tested: HCT-116 human colorectal carcinoma cell line
    Species: Human
    Verified Customer | Posted 05/26/2025
    Mouse IgG1 Isotype Control (11711) MAB002
  • Mouse IgG1 Isotype Control
    Name: Lu Bai
    Application: Flow Cytometry
    Sample Tested: Dendritic cells
    Species: Human
    Verified Customer | Posted 10/11/2022
  • Mouse IgG1 Isotype Control
    Name: Anonymous
    Application: ELISA
    Sample Tested: Serum
    Species: Human
    Verified Customer | Posted 08/18/2021
    Mouse IgG1 Isotype Control (11711) MAB002
  • Mouse IgG1 Isotype Control
    Name: Anonymous
    Application: Block/Neutralize
    Sample Tested: A549 human lung carcinoma cell line
    Species: Human
    Verified Customer | Posted 05/05/2021
    Mouse IgG1 Isotype Control (11711) MAB002
  • Mouse IgG1 Isotype Control
    Name: Anonymous
    Application: Flow Cytometry
    Sample Tested: Peripheral blood mononuclear cells (PBMCs)
    Species: Human
    Verified Customer | Posted 01/24/2021
    Mouse IgG1 Isotype Control (11711) MAB002
  • Mouse IgG1 Isotype Control
    Name: Anonymous
    Application: Flow Cytometry
    Sample Tested: K562 human chronic myelogenous leukemia cell line
    Species: Human
    Verified Customer | Posted 10/06/2020
    Mouse IgG1 Isotype Control (11711) MAB002
  • Mouse IgG1 Isotype Control
    Name: Anonymous
    Application: ELISA
    Sample Tested: Recombinant protein
    Species: Human
    Verified Customer | Posted 07/08/2020
    used as a negative control
    Mouse IgG1 Isotype Control (11711) MAB002
  • Mouse IgG1 Isotype Control
    Name: Abby Sukarto
    Application: Flow Cytometry
    Sample Tested: Bone Extracts
    Species: Human
    Verified Customer | Posted 02/13/2020
    Mouse IgG1 Isotype Control (11711) MAB002
  • Mouse IgG1 Isotype Control
    Name: Anonymous
    Application: Flow Cytometry
    Sample Tested: Mouse Breast Cancer Cells
    Species: Mouse
    Verified Customer | Posted 01/15/2020
  • Mouse IgG1 Isotype Control
    Name: Anonymous
    Application: Block/Neutralize
    Sample Tested: SVEC4-10 mouse vascular endothelial cell line
    Species: Mouse
    Verified Customer | Posted 01/06/2020
  • Mouse IgG1 Isotype Control
    Name: Anonymous
    Application: Flow Cytometry
    Sample Tested: Mouse breast cancer cell line
    Species: Mouse
    Verified Customer | Posted 12/08/2019
  • Mouse IgG1 Isotype Control
    Name: Abby Sukarto
    Application: Flow Cytometry
    Sample Tested: Bone Extracts
    Species: Mouse and Human
    Verified Customer | Posted 09/10/2019
    Need optimization of your specific cell types and use the same amount as the primary antibody.
  • Mouse IgG1 Isotype Control
    Name: Anonymous
    Application: Affinity Purification
    Sample Tested: Purified protein
    Species: Human
    Verified Customer | Posted 08/09/2019
    Mouse IgG1 Isotype Control (11711) MAB002
  • Mouse IgG1 Isotype Control
    Name: Anonymous
    Application: Flow Cytometry
    Sample Tested: SK-BR-3 human breast cancer cell line
    Species: Human
    Verified Customer | Posted 10/23/2018
    Mouse IgG1 Isotype Control (11711) MAB002
  • Mouse IgG1 Isotype Control
    Name: Anonymous
    Application: Block/Neutralize
    Sample Tested: Breast cancer cells
    Species: Human
    Verified Customer | Posted 05/20/2018
    We used this as an Isotype Control for our Endothelial Chemotaxis Assay experiments. Conditioned Medium from Breast cancer cells mixed with IgG1 Isotype Control was used to compare Conditioned Medium containing cytokines (IL6, IL8, IL1B) neutralization antibody cocktail. Cancer Res; 78(5) March 1, 2018 (Fig 6F)
  • Name: Anonymous
    Application: Flow Cytometry
    Sample Tested: Blood mononuclear cells (PBMCs)
    Species: Human
    Verified Customer | Posted 03/23/2018
  • Mouse IgG1 Isotype Control
    Name: Tao Huang
    Application: Block/Neutralize
    Sample Tested: IgG1
    Species: Mouse
    Verified Customer | Posted 10/20/2017
  • Mouse IgG1 Isotype Control
    Name: Anonymous
    Application: Block/Neutralize
    Sample Tested: Blood-derived monocytes
    Species: Human
    Verified Customer | Posted 08/01/2017
  • Mouse IgG1 Isotype Control
    Name: A G
    Verified Customer | Posted 05/26/2017
    Mouse IgG1 Isotope control for ICC
    Used in ICC with dog blood cell on a slide.
    Mouse IgG1 Isotype Control (11711) MAB002
  • Mouse IgG1 Isotype Control
    Name: Qing Zhang
    Application: Immunoprecipitation
    Sample Tested: Cancer cell lysates
    Species: Human
    Verified Customer | Posted 05/16/2017
  • Mouse IgG1 Isotype Control
    Name: Anonymous
    Application: Immunocytochemistry/Immunofluorescence
    Sample Tested: Beta TC-6 mouse beta cell insulinoma cell line
    Species: Human and Mouse
    Verified Customer | Posted 08/17/2016
    PFA 4% fixation. Used at 94ug/mL. No signal until 120-250msec of acquisition time.
  • Mouse IgG1 Isotype Control
    Name: Anonymous
    Application: Functional Assay
    Sample Tested: uman primary monocytes
    Species: Human
    Verified Customer | Posted 04/21/2016
  • Mouse IgG1 Isotype Control
    Name: SOjan Abraham
    Application: Flow Cytometry
    Sample Tested: Peripheral blood lymphocytes (PBL)
    Species: Human
    Verified Customer | Posted 01/21/2016

There are no reviews that match your criteria.

Showing  1 - 5 of 24 reviews Showing All

FAQs

No product specific FAQs exist for this product.

View all FAQs for Isotype Controls
Loading...