
Mouse Kallikrein 5 Antibody (880036)
R&D Systems | Catalog # MAB7236

Scientific images may be resized, cropped, or adjusted for brightness or contrast for presentation purposes. These updates are limited to presentation and do not affect the underlying scientific interpretation of the data. Where available, additional source data may be provided upon request.
Key Product Details
Species Reactivity
Validated:
Mouse
Cited:
Mouse
Applications
Validated:
Immunohistochemistry, Western Blot
Cited:
Immunohistochemistry, Western Blot
Label
Unconjugated
Antibody Source
Monoclonal Rat IgG2B Clone # 880036
Loading...
Product Specifications
Immunogen
Mouse myeloma cell line NS0-derived recombinant mouse Kallikrein 5
23-293
23-293
Specificity
Detects mouse Kallikrein 5 in ELISA.
Clonality
Monoclonal
Host
Rat
Isotype
IgG2B
Scientific Data Images for Mouse Kallikrein 5 Antibody (880036)
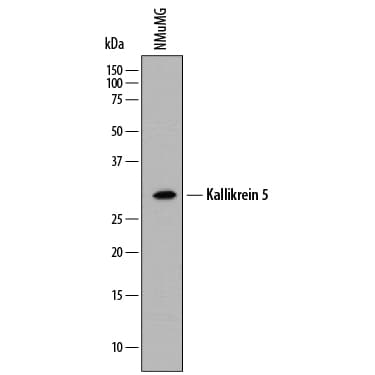
Detection of Mouse Kallikrein 5 by Western Blot.
Western blot shows lysates of NMuMG mouse mammary gland epithelial cell line. PVDF membrane was probed with 2 µg/mL of Rat Anti-Mouse Kallikrein 5 Monoclonal Antibody (Catalog # MAB7236) followed by HRP-conjugated Anti-Rat IgG Secondary Antibody (Catalog # HAF005). A specific band was detected for Kallikrein 5 at approximately 30 kDa (as indicated). This experiment was conducted under reducing conditions and using Immunoblot Buffer Group 1.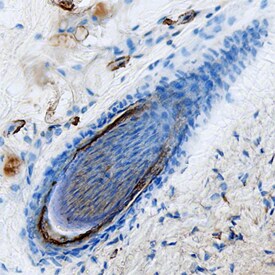
Kallikrein 5 in Hair Follicle of Mouse Skin.
Kallikrein 5 was detected in immersion fixed frozen sections of mouse skin using Rat Anti-Mouse Kallikrein 5 Monoclonal Antibody (Catalog # MAB7236) at 25 µg/mL overnight at 4 °C. Tissue was stained using the Anti-Rat HRP-DAB Cell & Tissue Staining Kit (brown; Catalog # CTS017) and counterstained with hematoxylin (blue). Specific staining was localized to the inner sheath cuticle of hair follicles. View our protocol for Chromogenic IHC Staining of Frozen Tissue Sections.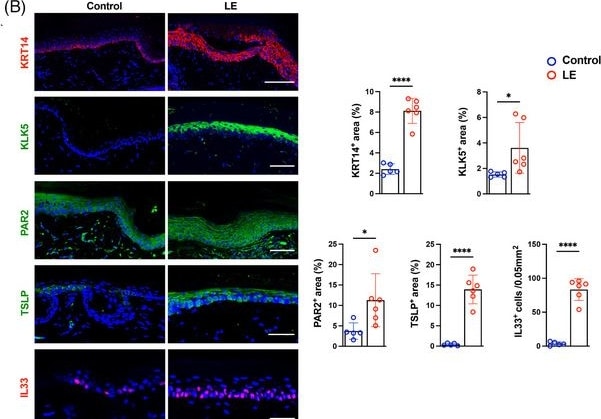
Detection of aitzzckyosadfm9rkedu.jpg by Immunohistochemistry
Keratinocyte expression of Th2‐inducing cytokines occurs rapidly after lymphatic injury. (A) Representative H&E (top) and immunofluorescent staining for LYVE1 and CD3e (bottom), and quantification (right) of control (skin incision) tail skin and tail skin harvested 2 or 6 week after skin and lymphatic excision. Scale bar: 100 µm. Each circle represents the average of three HPF views for each mouse (n = 5–8). *p < .05, ****p < .0001. p Values were calculated by one‐way ANOVA. (B) Representative immunofluorescent images (left) and quantification (right) of KRT14, KLK5, PAR2, TSLP, IL‐33, Ki67 and IL1 alpha staining in tail skin harvested 2 week after surgery from control and lymphedema (LE) mice. Scale bar: 100 µm. Each circle represents the average of three HPF views for each mouse (n = 5–6). *p < .05, ****p < .0001. p Values were calculated by unpaired Student's t‐test. (C) Relative mRNA expression by qPCR tail skin harvested 2 week after surgery from control and LE mice (n = 5). mRNA expression was normalised to beta ‐actin expression. Each box represents one mouse. *p < .05, **p < .01, ***p < .001. p Values were calculated by Mann–Whitney test. Fold changes from control are shown in parentheses. (D) Representative western blot (left) and quantification (right; relative to beta ‐actin) of KLK5 and PAR2 in tail skin harvested 2 week after surgery from control and LE mice (left). Each circle represents each mouse (n = 5–6). *p < .05, **p < .01. p Values were calculated by Mann–Whitney test. (E) TSLP and IL‐33 ELISA from protein lysates of control and LE tail skin (n = 5–7). Each circle represents one mouse. p Values were calculated by Mann–Whitney test. Image collected and cropped by CiteAb from the following open publication (https://pubmed.ncbi.nlm.nih.gov/42226615), licensed under a CC-BY license. Not internally tested by R&D Systems.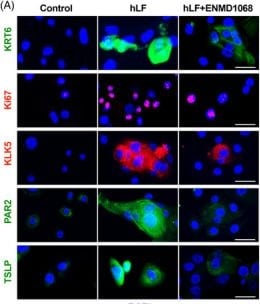
Detection of iklcw0hc3jaunbd2kt9w.jpg by Immunocytochemistry/ Immunofluorescence
LF induces proliferation and increases the expression of PAR2 and Th2‐inducing cytokines in h‐keratinocytes. (A) Representative immunofluorescent images of KRT6, Ki67, KLK5, PAR2 and TSLP staining in h‐keratinocytes cultured with PBS (control), hLF or hLF+ENMD1068. Scale bar: 50 µm. (B) Quantification of the KRT6, Ki67, KLK5, PAR2 and TSLP areas in h‐keratinocytes cultured with PBS (control), hLF or hLF+ENMD1068. Each circle represents the average quantification of two HPF views for each experiment. LF from two different lymphedema patients was used (n = 6; 3 for each LF). *p < .05, **p < .01, ***p < .001, ****p < .0001. p Values were calculated by one‐way ANOVA. (C) Relative mRNA expression by qPCR in cultured h‐keratinocytes treated with PBS (control), hLF or hLF+ENMD (n = 3). mRNA expression was normalised by beta ‐actin expression. Each box represents each experiment with independently cultured h‐keratinocytes. Fold changes are relative to control for LF and relative to LF for LF+ENMD. *p indicates LF compared with control, and #p indicates LF+ENMD compared with LF. *p < .05, #p < .05, ***p < .001, ###p < .001. p Values were calculated by Mann–Whitney test. (D) Relative mRNA expression by qPCR in cultured h‐keratinocytes treated with PBS (control), AEBSF, hLF or hLF+AEBSF (n = 6). mRNA expression was normalised by beta ‐actin expression. Each box represents each experiment with independently cultured h‐keratinocytes. Fold changes are relative to control for AEBSF, LF and LF+AEBSF. *p indicates LF compared with LF+AEBSF. *p < .05, #p < .05, ***p < .001. p Values were calculated by two‐way ANOVA. Image collected and cropped by CiteAb from the following open publication (https://pubmed.ncbi.nlm.nih.gov/42226615), licensed under a CC-BY license. Not internally tested by R&D Systems.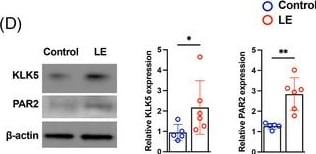
Detection of k0dh2dsr0tyqlt53m49z.jpg by Western Blot
Keratinocyte expression of Th2‐inducing cytokines occurs rapidly after lymphatic injury. (A) Representative H&E (top) and immunofluorescent staining for LYVE1 and CD3e (bottom), and quantification (right) of control (skin incision) tail skin and tail skin harvested 2 or 6 week after skin and lymphatic excision. Scale bar: 100 µm. Each circle represents the average of three HPF views for each mouse (n = 5–8). *p < .05, ****p < .0001. p Values were calculated by one‐way ANOVA. (B) Representative immunofluorescent images (left) and quantification (right) of KRT14, KLK5, PAR2, TSLP, IL‐33, Ki67 and IL1 alpha staining in tail skin harvested 2 week after surgery from control and lymphedema (LE) mice. Scale bar: 100 µm. Each circle represents the average of three HPF views for each mouse (n = 5–6). *p < .05, ****p < .0001. p Values were calculated by unpaired Student's t‐test. (C) Relative mRNA expression by qPCR tail skin harvested 2 week after surgery from control and LE mice (n = 5). mRNA expression was normalised to beta ‐actin expression. Each box represents one mouse. *p < .05, **p < .01, ***p < .001. p Values were calculated by Mann–Whitney test. Fold changes from control are shown in parentheses. (D) Representative western blot (left) and quantification (right; relative to beta ‐actin) of KLK5 and PAR2 in tail skin harvested 2 week after surgery from control and LE mice (left). Each circle represents each mouse (n = 5–6). *p < .05, **p < .01. p Values were calculated by Mann–Whitney test. (E) TSLP and IL‐33 ELISA from protein lysates of control and LE tail skin (n = 5–7). Each circle represents one mouse. p Values were calculated by Mann–Whitney test. Image collected and cropped by CiteAb from the following open publication (https://pubmed.ncbi.nlm.nih.gov/42226615), licensed under a CC-BY license. Not internally tested by R&D Systems.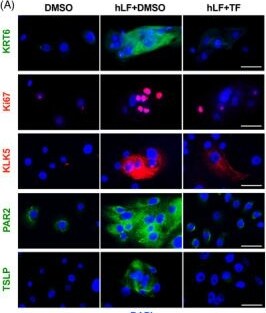
Detection of Kallikrein 5 by Immunocytochemistry/ Immunofluorescence
TF treatment inhibits hLF‐induced keratinocyte proliferation in vitro. (A) Representative immunofluorescent images of KRT6, Ki67, KLK5, PAR2 and TSLP staining of h‐keratinocytes cultured with DMSO, hLF+DMSO or hLF+TF (25 µM in DMSO). Scale bar: 50 µm. (B) Quantification of the KRT6, Ki67, KLK5, PAR2 and TSLP areas in h‐keratinocytes cultured with DMSO, hLF+DMSO or hLF+TF. Each circle represents the average quantification of two HPF views for each experiment (n = 6). *p < .05, **p < .01, ***p < .001, ****p < .0001. p Values were calculated by one‐way ANOVA. Proliferation (MTT assay) of (C) h‐keratinocytes, (D) fibroblasts and (E) lymphatic endothelial cells cultured with DMSO only or TF (n = 10). Each circle represents an individual experiment. ****p < .0001. p Values were calculated by one‐way ANOVA. Image collected and cropped by CiteAb from the following open publication (https://pubmed.ncbi.nlm.nih.gov/42226615), licensed under a CC-BY license. Not internally tested by R&D Systems.Applications for Mouse Kallikrein 5 Antibody (880036)
Application
Recommended Usage
Immunohistochemistry
8-25 µg/mL
Sample: Immersion fixed frozen sections of mouse skin
Sample: Immersion fixed frozen sections of mouse skin
Western Blot
2 µg/mL
Sample: NMuMG mouse mammary gland epithelial cell line
Sample: NMuMG mouse mammary gland epithelial cell line
Formulation, Preparation, and Storage
Purification
Protein A or G purified from hybridoma culture supernatant
Reconstitution
Reconstitute at 0.5 mg/mL in sterile PBS. For liquid material, refer to CoA for concentration.
Loading...
Formulation
Lyophilized from a 0.2 μm filtered solution in PBS with Trehalose. *Small pack size (SP) is supplied either lyophilized or as a 0.2 µm filtered solution in PBS.
Shipping
Lyophilized product is shipped at ambient temperature. Liquid small pack size (-SP) is shipped with polar packs. Upon receipt, store immediately at the temperature recommended below.
Stability & Storage
Use a manual defrost freezer and avoid repeated freeze-thaw cycles.
- 12 months from date of receipt, -20 to -70 °C as supplied.
- 1 month, 2 to 8 °C under sterile conditions after reconstitution.
- 6 months, -20 to -70 °C under sterile conditions after reconstitution.
Calculators
Background: Kallikrein 5
References
- Brattsand M. and T. Egelrud (1999) J. Biol. Chem. 274:30033.
- Yousef G.M. et al. (2003) Cancer Res. 63:3958.
- Kim H. et al. (2001) Br. J. Cancer 84:543.
Alternate Names
KLK-L2, KLK5, SCTE
Gene Symbol
KLK5
Additional Kallikrein 5 Products
Product Documents for Mouse Kallikrein 5 Antibody (880036)
Certificate of Analysis
To download a Certificate of Analysis, please enter a lot or batch number in the search box below.
Note: Certificate of Analysis not available for kit components.
Product Specific Notices for Mouse Kallikrein 5 Antibody (880036)
For research use only
Citations for Mouse Kallikrein 5 Antibody (880036)
 Powered by Bioz
Customer Reviews for Mouse Kallikrein 5 Antibody (880036)
There are currently no reviews for this product. Be the first to review Mouse Kallikrein 5 Antibody (880036) and earn rewards!
Have you used Mouse Kallikrein 5 Antibody (880036)?
Submit a review and receive an Amazon gift card!
$25/€18/£15/$25CAN/¥2500 for a review with an image
$10/€7/£6/$10CAN/¥1110 for a review without an image
Submit a review
Protocols
Find general support by application which include: protocols, troubleshooting, illustrated assays, videos and webinars.
- Antigen Retrieval Protocol (PIER)
- Antigen Retrieval for Frozen Sections Protocol
- Appropriate Fixation of IHC/ICC Samples
- Cellular Response to Hypoxia Protocols
- Chromogenic IHC Staining of Formalin-Fixed Paraffin-Embedded (FFPE) Tissue Protocol
- Chromogenic Immunohistochemistry Staining of Frozen Tissue
- ClariTSA™ Fluorophore Kits
- Detection & Visualization of Antibody Binding
- Fluorescent IHC Staining of Frozen Tissue Protocol
- Graphic Protocol for Heat-induced Epitope Retrieval
- Graphic Protocol for the Preparation and Fluorescent IHC Staining of Frozen Tissue Sections
- Graphic Protocol for the Preparation and Fluorescent IHC Staining of Paraffin-embedded Tissue Sections
- Graphic Protocol for the Preparation of Gelatin-coated Slides for Histological Tissue Sections
- IHC Sample Preparation (Frozen sections vs Paraffin)
- Immunofluorescent IHC Staining of Formalin-Fixed Paraffin-Embedded (FFPE) Tissue Protocol
- Immunohistochemistry (IHC) and Immunocytochemistry (ICC) Protocols
- Immunohistochemistry Frozen Troubleshooting
- Immunohistochemistry Paraffin Troubleshooting
- Preparing Samples for IHC/ICC Experiments
- Preventing Non-Specific Staining (Non-Specific Binding)
- Primary Antibody Selection & Optimization
- Protocol for Heat-Induced Epitope Retrieval (HIER)
- Protocol for Making a 4% Formaldehyde Solution in PBS
- Protocol for VisUCyte™ HRP Polymer Detection Reagent
- Protocol for the Preparation & Fixation of Cells on Coverslips
- Protocol for the Preparation and Chromogenic IHC Staining of Frozen Tissue Sections
- Protocol for the Preparation and Chromogenic IHC Staining of Frozen Tissue Sections - Graphic
- Protocol for the Preparation and Chromogenic IHC Staining of Paraffin-embedded Tissue Sections
- Protocol for the Preparation and Chromogenic IHC Staining of Paraffin-embedded Tissue Sections - Graphic
- Protocol for the Preparation and Fluorescent IHC Staining of Frozen Tissue Sections
- Protocol for the Preparation and Fluorescent IHC Staining of Paraffin-embedded Tissue Sections
- Protocol for the Preparation of Gelatin-coated Slides for Histological Tissue Sections
- R&D Systems Quality Control Western Blot Protocol
- TUNEL and Active Caspase-3 Detection by IHC/ICC Protocol
- The Importance of IHC/ICC Controls
- Troubleshooting Guide: Immunohistochemistry
- Troubleshooting Guide: Western Blot Figures
- Western Blot Conditions
- Western Blot Protocol
- Western Blot Protocol for Cell Lysates
- Western Blot Troubleshooting
- Western Blot Troubleshooting Guide
- View all Protocols, Troubleshooting, Illustrated assays and Webinars
Loading...