TIM-1 (T cell-immunoglobulin-mucin; also KIM-1 and HAVCR) is a 70-80 kDa, type I transmembrane glycoprotein member of the TIM family of immunoglobulin superfamily molecules (1-4). This gene family is involved in the regulation of Th1 and Th2-cell-mediated immunity. In mouse, there are eight known TIM genes (# 1-8) vs. only three genes in human (# 1, 3, and 4) (1, 2). Mouse TIM-1 and -2 are counterparts of human TIM-1 while mouse TIM-5 through 8 have no human counterparts (2). Mouse TIM-1 is synthesized as a 305 amino acid (aa) precursor that contains a 21 aa signal sequence, a 216 aa extracellular domain (ECD), a 21 aa transmembrane segment and a 47 aa cytoplasmic domain (5, 6). The ECD contains one V-type Ig-like domain and a mucin region characterized by multiple T-S-P motifs. The mucin region undergoes extensive O-linked glycosylation. The mouse TIM-1 gene is highly polymorphic and, based on rat, may undergo alternate splicing (4, 6). For instance, HBA mice show a 15 aa deletion in the mucin region that occurs in BALB/c mice (6). This difference is associated with a decreased susceptibility to asthma. Other polymorphisms are also documented (6). In human, TIM-1 is known to circulate as a soluble form. It undergoes constitutive cleavage by an undefined MMP, releasing a 75-85 kDa soluble molecule (5). The same thing might be expected in mouse. The ECD of mouse TIM-1 is 50%, 39%, and 80% aa identical to human, canine and rat TIM-1 ECD, respectively. The only two reported ligands for TIM-1 are TIM-4 and the hepatitis A virus (8, 9). However, others are believed to exist, and based on the ligand for TIM-3, one possibility might be an S-type lectin (10). TIM-1 ligation induces T cell proliferation and promotes cytokine production (1, 10). In particular, it induces IL-4 production, and requires the cytoplasmic tyrosine phosphorylation motif (5).
Best Seller
Mouse TIM-1/KIM-1/HAVCR Antibody
R&D Systems | Catalog # AF1817

Key Product Details
Species Reactivity
Validated:
Mouse
Cited:
Human, Mouse, Rat, Transgenic Mouse
Applications
Validated:
Western Blot
Cited:
Immunohistochemistry, Immunohistochemistry-Paraffin, Immunohistochemistry-Frozen, Western Blot, Neutralization, Flow Cytometry, Immunofluorescence, Immunocytochemistry
Label
Unconjugated
Antibody Source
Polyclonal Goat IgG
Loading...
Product Specifications
Immunogen
Mouse myeloma cell line NS0-derived recombinant mouse TIM‑1/KIM-1/HAVCR
Tyr22-Thr212
Accession # NP_001160104
Tyr22-Thr212
Accession # NP_001160104
Specificity
Detects mouse TIM‑1/KIM-1/HAVCR in direct ELISAs and Western blots. In direct ELISAs and Western blots, less than 5% cross-reactivity with recombinant human TIM-1, recombinant mouse (rm) TIM-2, rmTIM-3, rmTIM-4, rmTIM-6, and rmTIM-7 is observed.
Clonality
Polyclonal
Host
Goat
Isotype
IgG
Scientific Data Images for Mouse TIM-1/KIM-1/HAVCR Antibody
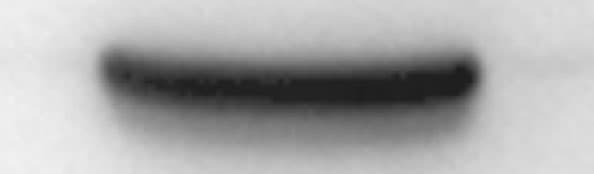
Detection of Mouse TIM‑1/KIM‑1/HAVCR by Western Blot.
Western blot shows lysates of NIH-3T3 mouse embryonic fibroblast cell line. PVDF membrane was probed with 0.25 µg/mL of Goat Anti-Mouse TIM-1/KIM-1/HAVCR Antigen Affinity-purified Polyclonal Antibody (Catalog # AF1817) followed by HRP-conjugated Anti-Goat IgG Secondary Antibody (Catalog # HAF019). A specific band was detected for TIM-1/KIM-1/HAVCR at approximately 70-80 kDa (as indicated). This experiment was conducted under reducing conditions and using Immunoblot Buffer Group 1.
Detection of Mouse TIM-1/KIM-1/HAVCR by Western Blot
Exogenous biological renal support improved renal IRI and decreased mortality and serum Cr, BUN levels in old IRI mice. (A) Survival curves for the old IRI mice at 72 hours. (B) Cr levels in the old mice. (C) BUN levels in the old mice. (D) Representative photographs of kidney sections from the old mice stained with periodic acid–Schiff (400× magnification). (E) Renal tubular injury score. (F) The levels of Kim1 in kidney extracts from the old mice, as measured by western blotting. Gels were performed under the same experimental conditions. (G) Quantitative analyses of the band densities of Kim1 expression. Values are presented as means ± SDs. ▲P < 0.05, ▲▲P < 0.01 vs. O: sham; *P < 0.05, **P < 0.01 vs. O: IRI. BUN, blood urea nitrogen Cr, serum creatinine; SD, standard deviation. Image collected and cropped by CiteAb from the following publication (https://pubmed.ncbi.nlm.nih.gov/30978173), licensed under a CC-BY license. Not internally tested by R&D Systems.
Detection of TIM-1/KIM-1/HAVCR by Immunohistochemistry
Changes in tubular injury and repair after MSC transplantation via the subcapsular and parenchymal routes. A Representative immunofluorescence staining of PCNA (red) and LTL (marker of proximal tubule; green) in the groups after IRI. B Quantitative analysis of PCNA-positive cells in the LTL+ proximal tubules in the groups after IRI. ***p < 0.001, ANOVA corrected with the Bonferroni coefficient. n = 5 per group. C Representative immunofluorescence staining of KIM-1 (red) in the groups after IRI. D Quantitative analysis showing the KIM-1-positive areas in the groups after IRI. ***p < 0.001, ANOVA corrected with the Bonferroni coefficient. n = 5 per group Image collected and cropped by CiteAb from the following open publication (https://pubmed.ncbi.nlm.nih.gov/35337372), licensed under a CC-BY license. Not internally tested by R&D Systems.
Detection of TIM-1/KIM-1/HAVCR by Western Blot
Elucidation of kidney injury markers and MAPK signaling following rhabdomyolysis. Mice were administered 7.5 ml/kg body weight of 50% glycerol in water and harvested after 1 or 3 days. Kidneys were analyzed for the expression of (A) kidney injury molecule-1 (KIM-1), (B) neutrophil gelatinase associated lipocalin (NGAL), and (C) ferritin heavy chain (FtH) by real-time PCR analysis. Each experiment was performed at least three independent times. Results were normalized to GAPDH and presented as mean ± SEM. *p < 0.05 vs. baseline control; #p < 0.05 vs. FtHfl/fl. (D) Kidneys were analyzed for the expression of 4-hydroxynonenal, NGAL, KIM-1, FtH, p-ERK, total ERK, p-JNK, and total JNK by Western blot analysis. Membranes were stripped and re-probed for GAPDH to demonstrate equal loading. (E) Expression of the indicated proteins in the kidneys was analyzed by densitometry, normalized to GAPDH (or total JNK or total ERK) and expressed as mean ± SEM. *p < 0.05 vs. baseline control; #p < 0.05 vs. FtHfl/fl. Image collected and cropped by CiteAb from the following open publication (https://pubmed.ncbi.nlm.nih.gov/36160140), licensed under a CC-BY license. Not internally tested by R&D Systems.
Detection of TIM-1/KIM-1/HAVCR by Western Blot
Downregulation of KLF10 was correlated with cell proliferation and the outcome of cisplatin-induced AKI in vivo. A Flowchart detailing cisplatin treatment regime in C57BL/6 J mice. n = 6 per group. B Representative H&E staining image of kidney sections from the model. C Representative immunofluorescence staining image of Ki67 in the model and counts of positive cells per 40x field (objective lens). D Renal dysfunction was determined in cisplatin (20 mg/kg, ip) treated mouse model. Serum creatinine (SCr) was measured in sera. Degree of renal injury was determined in the model through relative mRNA levels of KIM1, NGAL and IGFBP7 in mouse kidney tissues. Degree of renal cellular proliferation was determined in the model through relative mRNA levels of PCNA, FOXM1 and Ki67 in mice kidney tissues. E Representative immunoblot analysis of KLF10, KIM1 and PCNA in the model. ACTIN served as the standard. F Regression analysis was undertaken to determine correlation between relative protein level of KLF10 in mice kidney tissues and SCr. Relative protein level of KLF10 was examined and normalized by Fiji. G–I Representative immunofluorescence staining image and rate of positive nuclear of KLF10 in the model. *p < 0.05, **p < 0.01, ***p < 0.001, ns no significantly difference vs control group at the same experimental conditions. Image collected and cropped by CiteAb from the following open publication (https://pubmed.ncbi.nlm.nih.gov/36878898), licensed under a CC-BY license. Not internally tested by R&D Systems.
Detection of TIM-1/KIM-1/HAVCR by Western Blot
DMM inhibited UUO-induced renal fibrosis and injury. (A) The schematic of the experimental design. (B) The succinate content in PBS- and DMM-treated UUO kidneys (n = 5). (C) Immunoblots and (D) quantification of Col I and alpha SMA in UUO kidneys from mice treated with or without DMM (n = 3). (E) Representative Masson staining and quantification of UUO kidneys from mice treated with or without DMM (n = 5). (F) Immunoblots and (G) quantification of KIM1 and cleaved caspase-3 in UUO kidneys from mice treated with or without DMM (n = 3). The results represent mean ± SEM. *P < 0.05, **P < 0.01, ***P < 0.001. Image collected and cropped by CiteAb from the following open publication (https://pubmed.ncbi.nlm.nih.gov/40556756), licensed under a CC-BY license. Not internally tested by R&D Systems.
Mouse TIM-1 / KIM-1 / HAVCR ELISA Standard Curve
Recombinant Mouse TIM‑1/KIM‑1/HAVCR (Catalog # 1817-TM) was serially diluted and captured by Rat Anti-Mouse TIM‑1/KIM‑1/HAVCR Monoclonal Antibody (Catalog # MAB1817) coated on a Clear Polystyrene Microplate (Catalog # DY990). Goat Anti-Mouse TIM‑1/KIM‑1/HAVCR Antigen Affinity-purified Polyclonal Antibody (Catalog # AF1817) was biotinylated and incubated with the protein captured on the plate. Detection of the standard curve was achieved by incubating Streptavidin-HRP (Catalog # DY998)Applications for Mouse TIM-1/KIM-1/HAVCR Antibody
Application
Recommended Usage
Western Blot
0.25 µg/mL
Sample: NIH‑3T3 mouse embryonic fibroblast cell line
Sample: NIH‑3T3 mouse embryonic fibroblast cell line
Reviewed Applications
Read 1 review rated 5 using AF1817 in the following applications:
Formulation, Preparation, and Storage
Purification
Antigen Affinity-purified
Reconstitution
Reconstitute at 0.2 mg/mL in sterile PBS. For liquid material, refer to CoA for concentration.
Loading...
Formulation
Lyophilized from a 0.2 μm filtered solution in PBS with Trehalose. *Small pack size (SP) is supplied either lyophilized or as a 0.2 µm filtered solution in PBS.
Shipping
Lyophilized product is shipped at ambient temperature. Liquid small pack size (-SP) is shipped with polar packs. Upon receipt, store immediately at the temperature recommended below.
Stability & Storage
Use a manual defrost freezer and avoid repeated freeze-thaw cycles.
- 12 months from date of receipt, -20 to -70 °C as supplied.
- 1 month, 2 to 8 °C under sterile conditions after reconstitution.
- 6 months, -20 to -70 °C under sterile conditions after reconstitution.
Calculators
Background: TIM-1/KIM-1/HAVCR
References
- Meyers, J.H. et al. (2005) Trends Mol. Med. 11:1471.
- Kuchroo, V.K. et al. (2003) Nat. Rev. Immunol. 3:454.
- Mariat, C. et al. (2005) Phil. Trans. R. Soc. B 360:1681.
- Ichimura, T. et al. (1998) J. Biol. Chem. 273:4135.
- de Souza, A.J. et al. (2005) Proc. Natl. Acad. Sci. USA 102:17113.
- McIntire, J.J. et al. (2001) Nat. Immunol. 2:1109.
- Bailly, V. et al. (2002) J. Biol. Chem. 277:39739.
- Feigelstock, D. et al. (1998) J. Virol. 72:6621.
- Zhu, C. et al. (2005) Nat. Immunol. 6:1245.
- Meyers, J.H. et al. (2005) Nat. Immunol. 6:455.
Long Name
T Cell Immunoglobulin Mucin-1
Alternate Names
CD365, HAVCR1, KIM-1, TIM1
Gene Symbol
HAVCR1
UniProt
Additional TIM-1/KIM-1/HAVCR Products
Product Documents for Mouse TIM-1/KIM-1/HAVCR Antibody
Certificate of Analysis
To download a Certificate of Analysis, please enter a lot or batch number in the search box below.
Note: Certificate of Analysis not available for kit components.
Product Specific Notices for Mouse TIM-1/KIM-1/HAVCR Antibody
For research use only
Related Research Areas
Citations for Mouse TIM-1/KIM-1/HAVCR Antibody
 Powered by Bioz
Customer Reviews for Mouse TIM-1/KIM-1/HAVCR Antibody (1)
5 out of 5
1 Customer Rating
Have you used Mouse TIM-1/KIM-1/HAVCR Antibody?
Submit a review and receive an Amazon gift card!
$25/€18/£15/$25CAN/¥2500 Yen for a review with an image
$10/€7/£6/$10CAN/¥1110 Yen for a review without an image
Submit a review
Customer Images
Showing
1
-
1 of
1 review
Showing All
Filter By:
-
Application: Western BlotSample Tested: Kidney tissue (cortex)Species: MouseVerified Customer | Posted 12/02/2016

There are no reviews that match your criteria.
Protocols
Find general support by application which include: protocols, troubleshooting, illustrated assays, videos and webinars.
- Cellular Response to Hypoxia Protocols
- R&D Systems Quality Control Western Blot Protocol
- Troubleshooting Guide: Western Blot Figures
- Western Blot Conditions
- Western Blot Protocol
- Western Blot Protocol for Cell Lysates
- Western Blot Troubleshooting
- Western Blot Troubleshooting Guide
- View all Protocols, Troubleshooting, Illustrated assays and Webinars
Loading...