SREBP1 Antibody - BSA Free
Novus Biologicals | Catalog # NB100-2215
![Simple Western: SREBP1 AntibodyBSA Free [NB100-2215]](https://resources.rndsystems.com/images/products/SREBP1-Antibody-Simple-Western-NB100-2215-img0007.jpg "Simple Western: SREBP1 AntibodyBSA Free [NB100-2215]")
Key Product Details
Validated by
Species Reactivity
Validated:
Cited:
Predicted:
Applications
Validated:
Cited:
Label
Antibody Source
Format
Product Specifications
Immunogen
Reactivity Notes
Localization
Clonality
Host
Isotype
Theoretical MW
Disclaimer note: The observed molecular weight of the protein may vary from the listed predicted molecular weight due to post translational modifications, post translation cleavages, relative charges, and other experimental factors.
Scientific Data Images for SREBP1 Antibody - BSA Free
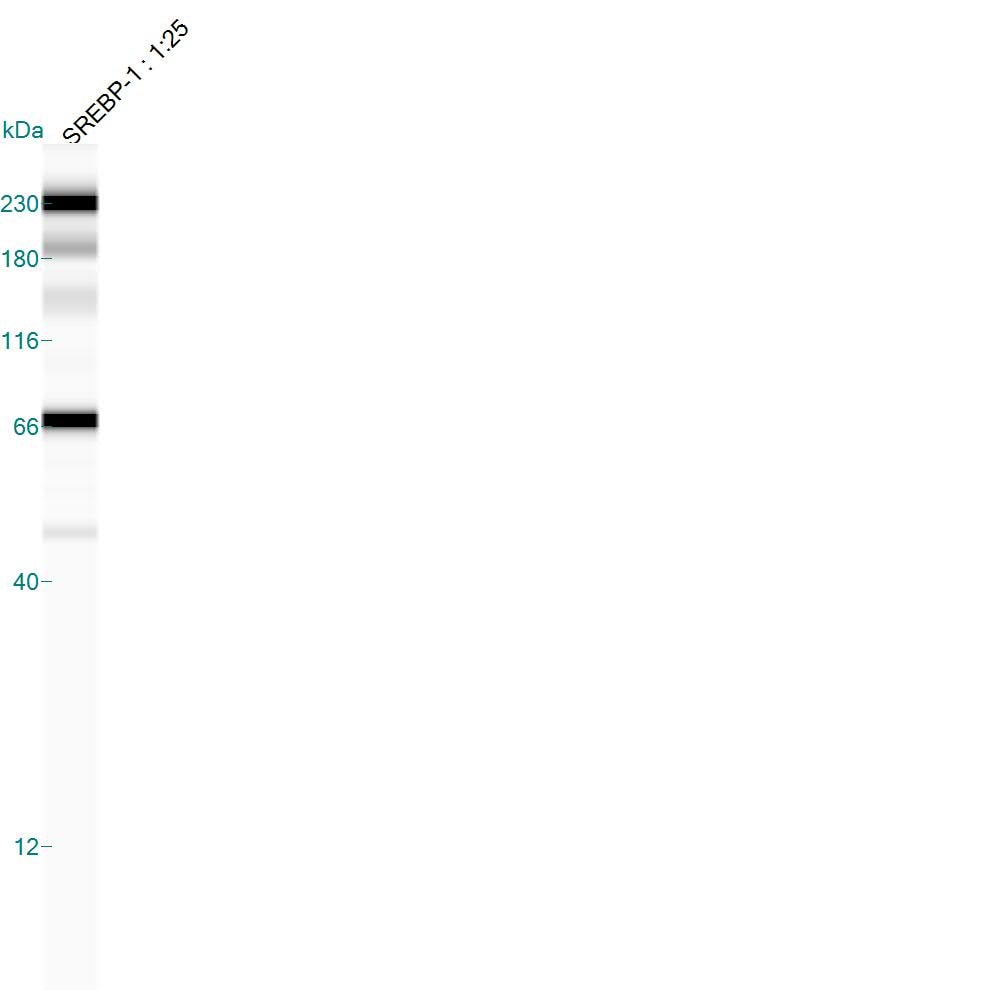
Simple Western: SREBP1 AntibodyBSA Free [NB100-2215]
Simple Western: SREBP1 Antibody [NB100-2215] - Image shows a specific band for SREBP1 in 1 mg/mL of HeLa cell lysate. This experiment was performed under reducing conditions using the 12-230 kDa separation system.![Immunocytochemistry/ Immunofluorescence: SREBP1 Antibody - BSA Free [NB100-2215]](https://resources.rndsystems.com/images/products/SREBP1-Antibody-Immunocytochemistry-Immunofluorescence-NB100-2215-img0011.jpg "Immunocytochemistry/ Immunofluorescence: SREBP1 Antibody - BSA Free [NB100-2215]")
Immunocytochemistry/ Immunofluorescence: SREBP1 Antibody - BSA Free [NB100-2215]
SREBP1-Antibody-Immunocytochemistry-Immunofluorescence-NB100-2215-img0011.jpg![Western Blot: SREBP1 AntibodyBSA Free [NB100-2215]](https://resources.rndsystems.com/images/products/SREBP1-Antibody-Western-Blot-NB100-2215-img0010.jpg "Western Blot: SREBP1 AntibodyBSA Free [NB100-2215]")
![Immunocytochemistry/ Immunofluorescence: SREBP1 Antibody - BSA Free [NB100-2215]](https://resources.rndsystems.com/images/products/SREBP1-Antibody-Immunocytochemistry-Immunofluorescence-NB100-2215-img0006.jpg "Immunocytochemistry/ Immunofluorescence: SREBP1 Antibody - BSA Free [NB100-2215]")
Immunocytochemistry/ Immunofluorescence: SREBP1 Antibody - BSA Free [NB100-2215]
Immunocytochemistry/Immunofluorescence: SREBP1 Antibody [NB100-2215] - SREBP1 antibody was tested in HeLa cells with DyLight488 (green). Nuclei and alpha-tubulin were counterstained with DAPI (blue) and DyLight 550 (red). Nuclear and punctate vesicle staining was observed.![Immunohistochemistry-Paraffin: SREBP1 Antibody - BSA Free [NB100-2215]](https://resources.rndsystems.com/images/products/SREBP1-Antibody-Immunohistochemistry-Paraffin-NB100-2215-img0008.jpg "Immunohistochemistry-Paraffin: SREBP1 Antibody - BSA Free [NB100-2215]")
Immunohistochemistry-Paraffin: SREBP1 Antibody - BSA Free [NB100-2215]
Immunohistochemistry-Paraffin: SREBP1 Antibody [NB100-2215] - nalysis of FFPE tissue section of mouse liver with SREBP1 antibody at 1:200. The antibody generated an expected cytoplasmic-nuclear immunostaining of SREBP1 protein in the hepatocytes.![Western Blot: SREBP1 AntibodyBSA Free [NB100-2215]](https://resources.rndsystems.com/images/products/SREBP1-Antibody-Western-Blot-NB100-2215-img0004.jpg "Western Blot: SREBP1 AntibodyBSA Free [NB100-2215]")
Western Blot: SREBP1 AntibodyBSA Free [NB100-2215]
Western Blot: SREBP1 Antibody [NB100-2215] - Detection of SREBP1. Lane 1: human liver. Lane 2: mouse liver.
Western Blot: SREBP1 Antibody - BSA Free [NB100-2215] -
Western Blot: SREBP1 Antibody - BSA Free [NB100-2215] - MiR-181a overexpression impairs & miR-181a inhibition improves glucose & lipid homeostasis in HepG2 cellsHepG2 cells were divided into 4 groups as follows: a control group, mimics group (HepG2 cells transfected with 10 nM mimics), NEFA group (treated with 1.2 mM NEFA), & miR-181a + NEFA group (transfected with 50 nM miR-181a inhibitors & then treated with 1.2 mM NEFA). B was followed with or without 100 nM insulin. (A) Immunoblot analysis (top) & quantification (bottom) of SIRT1, PGC-1 alpha & acetylated PGC-1 alpha in HepG2 cells. (B) Immunoblotting analysis (top) & quantification (bottom) of insulin-stimulated phosphorylation of AKT in HepG2 cells. (C) Glucose concentration in medium. (D) The glycogen content in HepG2 cells. (E) The mRNA expression levels of G6Pase & PEPCK. (F) Immunoblot analysis (left) & quantification (right) of SREBP-1c & PPAR alpha in HepG2 cells. (G) TG content in HepG2 cells. *P < 0.05, **P < 0.01. All experiments were repeated at least three times & representative results are shown. Image collected & cropped by CiteAb from the following publication (https://pubmed.ncbi.nlm.nih.gov/29207650), licensed under a CC-BY license. Not internally tested by Novus Biologicals.
Western Blot: SREBP1 Antibody - BSA Free [NB100-2215] -
Western Blot: SREBP1 Antibody - BSA Free [NB100-2215] - Effect of restoration of macrophage A2bAR on liver.Liver was collected from WT, A2bAR KO, & CD68-Tg mice after 16 weeks of HFD as described in the methods. Relative mRNA expression was determined using the delta delta CT method with normalization to 18s rRNA. A. mRNA expression of TNF-alpha in liver. A2bAR KO (n = 5) vs WT (n = 7) p-value = 0.0271; A2bAR KO vs CD68-Tg (n = 6) p-value = 0.0210. B. mRNA expression of IL-6 in liver. A2bAR KO (n = 8) vs WT (n = 7) p-value = 0.0159; A2bAR KO vs CD68-Tg (n = 8) p-value = 0.0080. C. mRNA expression of IRS-2 in liver. CD68-Tg (n = 7) vs A2bAR KO (n = 8) p-value = 0.0300. D. Western blot analysis of liver; one representative (of 3 sets) WT, CD68-Tg & A2bAR KO group shown at 15 minutes post-insulin injection, following 16 weeks of HFD. Levels of mature SREBP-1 (68 kDa), & IRS-2 (185 kDa), were probed by Western blot analysis, using beta -actin (43 kDa) as loading control. Quantification of Western Blot results was performed with Image J software (http://rsb.info.nih.gov/ij/) with normalization to beta -actin. WT to A2bAR KO: IRS-2 p-value = 0.0092, SREBP-1 p-value = 0.0154; CD68-Tg to A2bAR KO: IRS-2 p-value = 0.0247, SREBP-1 p-value = 0.0170. Data are averages ± SD. *Student two-tail t-test assuming equal variance was found significant only when p-value <0.05. Image collected & cropped by CiteAb from the following publication (https://pubmed.ncbi.nlm.nih.gov/24892847), licensed under a CC-BY license. Not internally tested by Novus Biologicals.
Western Blot: SREBP1 Antibody - BSA Free [NB100-2215] -
Western Blot: SREBP1 Antibody - BSA Free [NB100-2215] - MiR-181a overexpression or SIRT1 knockdown impairs glucose & lipid metabolism in vivo(Aa & Ab) Immunoblotting analysis (left) & quantification (right) of SIRT1, PGC-1 alpha & acetylated PGC-1 alpha in the liver of mice injected with Ago-181a or Ago-NC or Ad-shRNA NC or Ad-shRNA SIRT1. (B) Glucose tolerance test of mice injected with Ago-181a (n = 7) or Ago-NC (n = 7) or Ad-shRNA NC (n = 6) or Ad-shRNA SIRT1 (n = 6). (C) Insulin tolerance test of mice injected with Ago-181a (n = 7) or Ago-NC (n = 7) or Ad-shRNA NC (n = 6) or Ad-shRNA SIRT1 (n = 6). (D) Representative images of PAS staining (original magnification × 20) of liver sections from mice injected with Ago-181a or Ago-NC or Ad-shRNA NC or Ad-shRNA SIRT1. (Ea & Eb) Immunoblotting analysis (top) & quantification (bottom) of insulin-stimulated phosphorylation of IR, AKT & GSK3 beta in liver of mice injected with Ago-181a or Ago-NC or Ad-shRNA NC or Ad-shRNA SIRT1. (F) Representative images of H&E staining (left, original magnification × 20) & Oil-red staining (right, original magnification × 20) of liver sections from mice injected with Ago-181a or Ago-NC or Ad-shRNA NC or Ad-shRNA SIRT1. (Ga & Gb) Immunoblotting analysis (top) & quantification (bottom) of SREBP-1c & PPAR alpha in the liver of mice injected with Ago-181a or Ago-NC or Ad-shRNA NC or Ad-shRNA SIRT1. *P < 0.05, **P < 0.01. All experiments were repeated at least three times & representative results are shown. Image collected & cropped by CiteAb from the following publication (https://pubmed.ncbi.nlm.nih.gov/29207650), licensed under a CC-BY license. Not internally tested by Novus Biologicals.
Western Blot: SREBP1 Antibody - BSA Free [NB100-2215] -
Western Blot: SREBP1 Antibody - BSA Free [NB100-2215] - MiR-181a overexpression impairs & miR-181a inhibition improves glucose & lipid metabolism in vitro(A, B, C, D & E) Hepatocytes were transfected with 10 nM miR-181a mimics or negative controls in the absence or presence of 100 nM insulin. (A) Immunoblot analysis (left) & quantification (right) of insulin-stimulated phosphorylation of IR, Akt & GSK3 beta in hepatocytes. (B) The mRNA expression levels of G6Pase & PEPCK in hepatocytes. (C) Glucose concentration in medium. (D) Immunoblot analysis (left) & quantification (right) of SREBP-1c & PPAR alpha expression in hepatocytes. (E) TG content in hepatocytes. (F, G, H, I & J) Hepatocytes were transfected with 50 nM miR-181a inhibitors or negative controls in the absence or presence of 100 nM insulin. (F) Immunoblot analysis (left) & quantification (right) of insulin-stimulated phosphorylation of IR, Akt & GSK3 beta in hepatocytes. (G) The expression levels of G6Pase & PEPCK in hepatocytes. (H) Glucose concentration in medium. (I) Immunoblot analysis (left) & quantification (right) of SREBP-1c & PPAR alpha expression in hepatocytes. (J) TG content in hepatocytes. *P < 0.05, **P < 0.01. All experiments were repeated at least three times & representative results are shown. Image collected & cropped by CiteAb from the following publication (https://pubmed.ncbi.nlm.nih.gov/29207650), licensed under a CC-BY license. Not internally tested by Novus Biologicals.
Western Blot: SREBP1 Antibody - BSA Free [NB100-2215] -
Western Blot: SREBP1 Antibody - BSA Free [NB100-2215] - Effect of restoration of macrophage A2bAR on adipose tissue.Visceral (epididymal) adipose tissue was collected from WT, A2bAR KO, & CD68-Tg mice after 16 weeks of HFD as described in the methods. A-C,E. Relative mRNA expression was determined using the delta delta CT method with normalization to 18s rRNA. A. mRNA expression of TNF-alpha in visceral fat. A2bAR KO (n = 7) vs CD68-Tg (n = 9) p-value = 0.0345. B. mRNA expression of IL-6 in visceral fat. A2bAR KO (n = 7) vs WT (n = 7) p-value = 0.0073; A2bAR KO vs CD68-Tg (n = 7) p-value = 0.0141. C. mRNA expression of MCP1 in visceral fat. A2bAR KO (n = 7) vs CD68-Tg (n = 9) p-value = 0.0232. D. Visceral adipose tissue from WT, A2bAR KO, & CD68-Tg mice after 16 weeks of HFD was fixed in 4% paraformaldehyde & paraffin-embedded. Sections immunostained with the macrophage marker F4/80. Representative sections for each genotype at a magnification of 200x & 400x. Arrows point to crown-like structures. E. mRNA expression of IRS-2 in visceral fat. CD68-Tg (n = 8) vs A2bAR KO (n = 8) p-value = 0.0115, WT (n = 6) vs A2bAR KO p-value = 0.0358. F. Western blot analysis of visceral fat; one representative (of 3 sets) WT, CD68-Tg & A2bAR KO group shown at 15 minutes post-insulin injection, following 16 weeks of HFD. WT to A2bAR KO: IRS-2 p-value = 0.0411, SREBP-1 p-value = 0.0103. CD68-Tg to A2bAR KO: IRS-2 p-value = 0.0305, SREBP-1 p-value = 0.0459. Data are averages ± SD. *Student two-tail t-test assuming equal variance was found significant only when p-value <0.05. Image collected & cropped by CiteAb from the following publication (https://pubmed.ncbi.nlm.nih.gov/24892847), licensed under a CC-BY license. Not internally tested by Novus Biologicals.
Western Blot: SREBP1 Antibody - BSA Free [NB100-2215] -
Western Blot: SREBP1 Antibody - BSA Free [NB100-2215] - SIRT1 knockdown impairs & SIRT1 overexpression improves glucose & lipid metabolism in hepatocytes(A) Immunoblot analysis (left) & quantification (right) of insulin-stimulated phosphorylation of IR, Akt & GSK3 beta protein levels in hepatocytes. Hepatocytes were transfected with SIRT1 siRNA with or without 100 nM insulin. (B) Immunoblot analysis (left) & quantification (right) of SREBP-1c & PPAR alpha protein levels in hepatocytes. Hepatocytes were transfected with SIRT1 siRNA. (C) Immunoblot analysis (left) & quantification (right) of SIRT1, PGC-1 alpha & acetylated PGC-1 alpha in hepatocytes. Hepatocytes were infected with Ad-SIRT1. (D) Immunoblotting analysis (left) & quantification (right) of insulin-stimulated phosphorylation of IR, AKT & GSK3 beta in hepatocytes. Hepatocytes were treated with 1.2 mM NEFA or 1.2 mM NEFA & Ad-SIRT1 with or without 100 nM insulin. (E, F & G) Hepatocytes were treated with 1.2 mM NEFA or 1.2 mM NEFA & Ad-SIRT1. (E) Glucose concentration in medium. (F) Immunoblot analysis (top) & quantification (bottom) of SREBP-1c & PPAR alpha in hepatocytes. (G) TG contents in hepatocytes. *P < 0.05, **P < 0.01. All experiments were repeated at least three times & representative results are shown. Image collected & cropped by CiteAb from the following publication (https://pubmed.ncbi.nlm.nih.gov/29207650), licensed under a CC-BY license. Not internally tested by Novus Biologicals.
Immunocytochemistry/ Immunofluorescence: SREBP1 Antibody - BSA Free [NB100-2215] -
The PPAR alpha activator, Irbe, reduces SREBP1 expression and induces the expression and co-localization of PPAR alpha and p21/p27 in Ishikawa cells. (A) Dual immunofluorescent staining for PPAR alpha (red) and SREBP1 (green) show that the Irbe (100 uM) treatment increased the nuclear expression of the PPAR alpha protein while decreasing that of SREBP1. (B, C) Dual immunofluorescent staining for PPAR alpha (red) and p21 (B) or p27 (C) (green) showed that the Irbe treatment increased the expression of both proteins, and their distribution was almost consistent. *p < 0.05. Image collected and cropped by CiteAb from the following open publication (https://pubmed.ncbi.nlm.nih.gov/37305395), licensed under a CC-BY license. Not internally tested by Novus Biologicals.
Immunohistochemistry: SREBP1 Antibody - BSA Free [NB100-2215] -
PPAR alpha expression was lower and SREBP1 and FAS expression was higher in endometrial carcinoma (EMC) than in normal endometrial glands. (Immunohistochemistry). (A) Photomicrographs show hematoxylin and eosin (HE) staining and representative immunostaining for PPAR alpha, SREBP1, and FAS in serial sections of the normal endometrium (PP: proliferation phase; SP: secretory phase) and EMC (G1: grade 1; G2: grade 2; G3: grade 3). (B–D) Graphic demonstration of immunostaining for PPAR alpha (B), SREBP1 (C), and FAS (D). The expression of PPAR alpha was significantly lower in EMC than in the normal endometrium, while the expression of SREBP1 and FAS was significantly higher (* p < 0.01). (E) The graph indicates the H-scores of PPAR alpha, SREBP1, and FAS in non-obese EMC patients with BMI <25 (n = 26) or in obese EMC patients with BMI >25 (n = 24). There was no significant difference. (F) The BMI and H-scores of PPAR alpha, SREBP1, and FAS in each EMC patient are shown in scatter plots. Spearman’s rank correlation coefficient showed a weak inverse correlation between BMI and the PPAR alpha H-score and a moderate or weak correlation between BMI and SREBP1 or FAS. Image collected and cropped by CiteAb from the following open publication (https://pubmed.ncbi.nlm.nih.gov/37305395), licensed under a CC-BY license. Not internally tested by Novus Biologicals.Applications for SREBP1 Antibody - BSA Free
Immunocytochemistry/ Immunofluorescence
Immunohistochemistry
Immunohistochemistry-Paraffin
Microarray
Simple Western
Western Blot
See Simple Western Antibody Database for Simple Western validation: Tested in HeLa lysate 1.0 mg/mL, separated by Size, antibody dilution of 1:25, apparent MW was 62 kDa. Separated by Size-Wes, Sally Sue/Peggy Sue.
Reviewed Applications
Read 3 reviews rated 4.3 using NB100-2215 in the following applications:
Formulation, Preparation, and Storage
Purification
Formulation
Format
Preservative
Concentration
Shipping
Stability & Storage
Background: SREBP1
Long Name
Alternate Names
Gene Symbol
Additional SREBP1 Products
Product Documents for SREBP1 Antibody - BSA Free
Certificate of Analysis
To download a Certificate of Analysis, please enter a lot or batch number in the search box below.
Product Specific Notices for SREBP1 Antibody - BSA Free
This product is for research use only and is not approved for use in humans or in clinical diagnosis. Primary Antibodies are guaranteed for 1 year from date of receipt.
Citations for SREBP1 Antibody - BSA Free
 Powered by Bioz
Customer Reviews for SREBP1 Antibody - BSA Free (3)
Have you used SREBP1 Antibody - BSA Free?
Submit a review and receive an Amazon gift card!
$25/€18/£15/$25CAN/¥2500 Yen for a review with an image
$10/€7/£6/$10CAN/¥1110 Yen for a review without an image
Submit a review
Customer Images
-
Application: Western BlotSample Tested: Mouse spleen, mouse liver, mouse bone marrowSpecies: Rat, Mouse and BovineVerified Customer | Posted 03/20/2018We used WB method to detect rat liver cells and found that antibody specificity(srebp1c) was very good.

-
Application: Simple WesternSample Tested: Human mesenchymal stem cell whole cell lysateSpecies: HumanVerified Customer | Posted 06/14/20150.5 mg/ml of hMSC lysate. This experiment was performed under reducing conditions using the 12-230kDa separation system.
-
Application: Western BlotSample Tested: See PMID 22990467Species: MouseVerified Customer | Posted 12/12/2014
There are no reviews that match your criteria.
Protocols
View specific protocols for SREBP1 Antibody - BSA Free (NB100-2215):
Immunocytochemistry Protocol
Culture cells to appropriate density in 35 mm culture dishes or 6-well plates.
1. Remove culture medium and add 10% formalin to the dish. Fix at room temperature for 30 minutes.
2. Remove the formalin and add ice cold methanol. Incubate for 5-10 minutes.
3. Remove methanol and add washing solution (i.e. PBS). Be sure to not let the specimen dry out. Wash three times for 10 minutes.
4. To block nonspecific antibody binding incubate in 10% normal goat serum from 1 hour to overnight at room temperature.
5. Add primary antibody at appropriate dilution and incubate at room temperature from 2 hours to overnight at room temperature.
6. Remove primary antibody and replace with washing solution. Wash three times for 10 minutes.
7. Add secondary antibody at appropriate dilution. Incubate for 1 hour at room temperature.
8. Remove antibody and replace with wash solution, then wash for 10 minutes. Add Hoechst 33258 to wash solution at 1:25,0000 and incubate for 10 minutes. Wash a third time for 10 minutes.
9. Cells can be viewed directly after washing. The plates can also be stored in PBS containing Azide covered in Parafilm (TM). Cells can also be cover-slipped using Fluoromount, with appropriate sealing.
*The above information is only intended as a guide. The researcher should determine what protocol best meets their needs. Please follow safe laboratory procedures.
Western Blot Protocol
1. Perform SDS-PAGE (4-12%) on samples to be analyzed, loading 35 ug of total protein per lane.
2. Transfer proteins to Nitrocellulose according to the instructions provided by the manufacturer of the transfer apparatus.
3. Rinse membrane with dH2O and then stain the blot using ponceau S for 1-2 minutes to access the transfer of proteins onto the nitrocellulose membrane. Rinse the blot in water to remove excess stain and mark the lane locations and locations of molecular weight markers using a pencil.
4. Rinse the blot in TBS for approximately 5 minutes.
5. Block the membrane using 5% non-fat dry milk + 1% BSA in TBS for 1 hour at room temperature (RT).
6. Rinse the membrane in dH2O and then wash the membrane in wash buffer [TBS + 0.1% Tween] 3 times for 10 minutes each.
7. Dilute the rabbit anti-SREBP1 primary antibody (NB 100-2215) in blocking buffer and incubate 1 hour at RT.
8. Rinse the membrane in dH2O and then wash the membrane in wash buffer [TBS + 0.1% Tween] 3 times for 10 minutes each.
9. Apply the diluted rabbit-IgG HRP-conjugated secondary antibody in blocking buffer (as per manufacturer's instructions) and incubate 1 hour at room temperature.
10. Wash the blot in wash buffer [TBS + 0.1% Tween] 3 times for 10 minutes each (this step can be repeated as required to reduce background).
11. Apply the detection reagent of choice in accordance with the manufacturer's instructions (we used BioFX Super Plus ECL).
Note: Tween-20 can be added to the blocking or antibody dilution buffer at a final concentration of 0.05-0.2%, provided it does not interfere with antibody-antigen binding.
Find general support by application which include: protocols, troubleshooting, illustrated assays, videos and webinars.
- Antigen Retrieval Protocol (PIER)
- Antigen Retrieval for Frozen Sections Protocol
- Appropriate Fixation of IHC/ICC Samples
- Cellular Response to Hypoxia Protocols
- Chromogenic IHC Staining of Formalin-Fixed Paraffin-Embedded (FFPE) Tissue Protocol
- Chromogenic Immunohistochemistry Staining of Frozen Tissue
- ClariTSA™ Fluorophore Kits
- Detection & Visualization of Antibody Binding
- Fluorescent IHC Staining of Frozen Tissue Protocol
- Graphic Protocol for Heat-induced Epitope Retrieval
- Graphic Protocol for the Preparation and Fluorescent IHC Staining of Frozen Tissue Sections
- Graphic Protocol for the Preparation and Fluorescent IHC Staining of Paraffin-embedded Tissue Sections
- Graphic Protocol for the Preparation of Gelatin-coated Slides for Histological Tissue Sections
- ICC Cell Smear Protocol for Suspension Cells
- ICC Immunocytochemistry Protocol Videos
- ICC for Adherent Cells
- IHC Sample Preparation (Frozen sections vs Paraffin)
- Immunocytochemistry (ICC) Protocol
- Immunocytochemistry Troubleshooting
- Immunofluorescence of Organoids Embedded in Cultrex Basement Membrane Extract
- Immunofluorescent IHC Staining of Formalin-Fixed Paraffin-Embedded (FFPE) Tissue Protocol
- Immunohistochemistry (IHC) and Immunocytochemistry (ICC) Protocols
- Immunohistochemistry Frozen Troubleshooting
- Immunohistochemistry Paraffin Troubleshooting
- Preparing Samples for IHC/ICC Experiments
- Preventing Non-Specific Staining (Non-Specific Binding)
- Primary Antibody Selection & Optimization
- Protocol for Heat-Induced Epitope Retrieval (HIER)
- Protocol for Making a 4% Formaldehyde Solution in PBS
- Protocol for VisUCyte™ HRP Polymer Detection Reagent
- Protocol for the Fluorescent ICC Staining of Cell Smears - Graphic
- Protocol for the Fluorescent ICC Staining of Cultured Cells on Coverslips - Graphic
- Protocol for the Preparation & Fixation of Cells on Coverslips
- Protocol for the Preparation and Chromogenic IHC Staining of Frozen Tissue Sections
- Protocol for the Preparation and Chromogenic IHC Staining of Frozen Tissue Sections - Graphic
- Protocol for the Preparation and Chromogenic IHC Staining of Paraffin-embedded Tissue Sections
- Protocol for the Preparation and Chromogenic IHC Staining of Paraffin-embedded Tissue Sections - Graphic
- Protocol for the Preparation and Fluorescent ICC Staining of Cells on Coverslips
- Protocol for the Preparation and Fluorescent ICC Staining of Non-adherent Cells
- Protocol for the Preparation and Fluorescent ICC Staining of Stem Cells on Coverslips
- Protocol for the Preparation and Fluorescent IHC Staining of Frozen Tissue Sections
- Protocol for the Preparation and Fluorescent IHC Staining of Paraffin-embedded Tissue Sections
- Protocol for the Preparation of Gelatin-coated Slides for Histological Tissue Sections
- Protocol for the Preparation of a Cell Smear for Non-adherent Cell ICC - Graphic
- R&D Systems Quality Control Western Blot Protocol
- TUNEL and Active Caspase-3 Detection by IHC/ICC Protocol
- The Importance of IHC/ICC Controls
- Troubleshooting Guide: Immunohistochemistry
- Troubleshooting Guide: Western Blot Figures
- Western Blot Conditions
- Western Blot Protocol
- Western Blot Protocol for Cell Lysates
- Western Blot Troubleshooting
- Western Blot Troubleshooting Guide
- View all Protocols, Troubleshooting, Illustrated assays and Webinars
FAQs for SREBP1 Antibody - BSA Free
-
Q: I am looking for SREBF1 antibodies that can cross-react with zebrafish srebf1. I am wondering whether you have any SREBF1 antibodies that have been tested for zebrafish or have high sequence identity in the immunogen region.
A:
Unfortunately we do not have any antibodies that have been tested in zebrafish. I have included the immunogen sequence for the antibodies it might be worth considering. I am not sure exactly what the zebrafish sequence is, I was unable to find it on uniprot.org, so I was unable to check the homology. The following antibodies all have available sample sizes. If you decide to try one you would qualify for our Innovators Reward Program. NB600-582 - 301-407 aa, NB100-2215 - 300-400 aa, NB100-60545 - 700-800 aa.
-
Q: What dilution should I use for IHC-P?
A: The starting dilution for IHC-P testing with this antibody is 1:200 and the customer can play around the final working dilution depending upon the level of SREBP1 expression in his/her particular tissues. Moreover, SREBP1 is highly expressed in Liver and Adrenal glands, and a section of one of these tissues may be included as positive control in the assay.
-
Q: I am looking for SREBF1 antibodies that can cross-react with zebrafish srebf1. I am wondering whether you have any SREBF1 antibodies that have been tested for zebrafish or have high sequence identity in the immunogen region.
A:
Unfortunately we do not have any antibodies that have been tested in zebrafish. I have included the immunogen sequence for the antibodies it might be worth considering. I am not sure exactly what the zebrafish sequence is, I was unable to find it on uniprot.org, so I was unable to check the homology. The following antibodies all have available sample sizes. If you decide to try one you would qualify for our Innovators Reward Program. NB600-582 - 301-407 aa, NB100-2215 - 300-400 aa, NB100-60545 - 700-800 aa.
-
Q: What dilution should I use for IHC-P?
A: The starting dilution for IHC-P testing with this antibody is 1:200 and the customer can play around the final working dilution depending upon the level of SREBP1 expression in his/her particular tissues. Moreover, SREBP1 is highly expressed in Liver and Adrenal glands, and a section of one of these tissues may be included as positive control in the assay.