
G9a/EHMT2 Antibody (A8620A)
R&D Systems | Catalog # PP-A8620A-00


Scientific images may be resized, cropped, or adjusted for brightness or contrast for presentation purposes. These updates are limited to presentation and do not affect the underlying scientific interpretation of the data. Where available, additional source data may be provided upon request.
Key Product Details
Validated by
Species Reactivity
Validated:
Cited:
Applications
Validated:
Cited:
Label
Antibody Source
Product Specifications
Immunogen
aa 15-114
Specificity
Clonality
Host
Isotype
Scientific Data Images for G9a/EHMT2 Antibody (A8620A)
Detection of Mouse G9a/EHMT2 by Western Blot
G9a is not required for the transcriptional repression of selected early embryonic genes during retinoic acid (RA)-induced differentiation. The indicated mESC lines were untreated (0) or treated with 1 μM RA for 2, 4 or 8 days. (A) Immunoblots were used to determine G9a, Oct3/4 and GAPDH (loading control) protein levels in whole cell extracts. (B) Graph shows the messenger (mRNA) levels for the indicated genes using RT-qPCR analysis with Ubiquitin C (UBC) as the normalization control. All mRNA levels are normalized to the TT2 0 RA sample. Results shown are mean ± SD for three PCR reactions performed on the same cDNA sample and are representative of three independent experiments. Image collected and cropped by CiteAb from the following publication (https://pubmed.ncbi.nlm.nih.gov/25478012), licensed under a CC-BY license. Not internally tested by R&D Systems.
Detection of Human G9a/EHMT2 by Immunohistochemistry
G9a expression is positively correlated with cell proliferation and poor prognosis in HNSCC patients. (A) Correlation between Ki-67 and G9a expression. The expression of two proteins were analyzed by IHC staining of tissue microarray (TMA) containing 46 normal and 108 tumor sections from HNSCC patients. The expression level of both Ki-67 and G9a was measured by relative staining intensity multiplied by percentage. Scale bar, 50 μm. (*, p < 0.05; ***, p < 0.001). (B) Ki-67 and G9a IHC staining of serial section of tumors. Low or high Ki-67 and G9a expression were defined by a threshold of 80 and 143, which is the average of relative staining intensity multiplied by percentage of Ki-67 and G9a. Scale bar, 50 μm. (***, p < 0.001). (C) Kaplan-Meier plot of overall survival of 77 HNSCC patients from a National Taiwan University Hospital cohort stratified by G9a expression level. Image collected and cropped by CiteAb from the following publication (https://pubmed.ncbi.nlm.nih.gov/25027955), licensed under a CC-BY license. Not internally tested by R&D Systems.
Detection of Human G9a/EHMT2 by Immunohistochemistry
G9a expression is positively correlated with cell proliferation and poor prognosis in HNSCC patients. (A) Correlation between Ki-67 and G9a expression. The expression of two proteins were analyzed by IHC staining of tissue microarray (TMA) containing 46 normal and 108 tumor sections from HNSCC patients. The expression level of both Ki-67 and G9a was measured by relative staining intensity multiplied by percentage. Scale bar, 50 μm. (*, p < 0.05; ***, p < 0.001). (B) Ki-67 and G9a IHC staining of serial section of tumors. Low or high Ki-67 and G9a expression were defined by a threshold of 80 and 143, which is the average of relative staining intensity multiplied by percentage of Ki-67 and G9a. Scale bar, 50 μm. (***, p < 0.001). (C) Kaplan-Meier plot of overall survival of 77 HNSCC patients from a National Taiwan University Hospital cohort stratified by G9a expression level. Image collected and cropped by CiteAb from the following publication (https://pubmed.ncbi.nlm.nih.gov/25027955), licensed under a CC-BY license. Not internally tested by R&D Systems.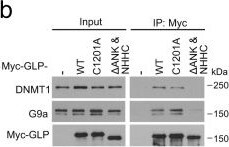
Detection of G9a/EHMT2 by Western Blot
SPOP mutation regulates DNA methylation through GLP/G9a interaction with DNMT proteins.a Diagram showing wild-type GLP, enzymatic inactive mutant C1201A and ANK & NHHC domain double deletion mutant. b Western blots with indicated antibodies in WCL and co-IP samples from 22Rv1 cells transfected with indicated plasmids. c–f 22Rv1 cells infected with lentivirus expressing indicated plasmids and/or shRNAs and transfected with indicated constructs were used for western blot (c), IFC (d) and MeDIP-qPCR (f). ImageJ was used to quantify the optical density (OD)/nuclear area (pixel) of 5mC staining in each group. Data shown means ± SD (n = 50 cells/group) (e). Scale bar, 10 μm. Data shown means ± SD (n = 3 replicates/group) (f). g A working model based on the current findings. Left, WT SPOP recognizes and promotes proteasomal degradation of GLP, thereby destabilizing the GLP/G9a complex, inhibiting GLP/G9a-mediated interaction with DNMTs and DNA methylation, and inducing expression of tumor suppressors such as FOXO3 and inhibition of cell proliferation. Right, PCa-associated SPOP mutations fail to bind and degrade GLP, thereby inducing elevation of the GLP/G9a complex and their interaction with DNMTs, increasing DNA methylation and suppression of expression of tumor suppressors and promoting cell proliferation. However, this process can be reversed by DNA demethylation reagents such as 5-AzaC in SPOP-mutant cells. Statistical significance was determined by unpaired two-tailed Student’s t test in (e, f). Experiments in (b, c) were repeated twice. Source data are provided as a Source Data file. Image collected and cropped by CiteAb from the following open publication (https://pubmed.ncbi.nlm.nih.gov/34588438), licensed under a CC-BY license. Not internally tested by R&D Systems.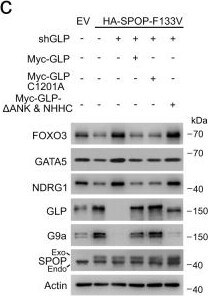
Detection of G9a/EHMT2 by Western Blot
SPOP mutation regulates DNA methylation through GLP/G9a interaction with DNMT proteins.a Diagram showing wild-type GLP, enzymatic inactive mutant C1201A and ANK & NHHC domain double deletion mutant. b Western blots with indicated antibodies in WCL and co-IP samples from 22Rv1 cells transfected with indicated plasmids. c–f 22Rv1 cells infected with lentivirus expressing indicated plasmids and/or shRNAs and transfected with indicated constructs were used for western blot (c), IFC (d) and MeDIP-qPCR (f). ImageJ was used to quantify the optical density (OD)/nuclear area (pixel) of 5mC staining in each group. Data shown means ± SD (n = 50 cells/group) (e). Scale bar, 10 μm. Data shown means ± SD (n = 3 replicates/group) (f). g A working model based on the current findings. Left, WT SPOP recognizes and promotes proteasomal degradation of GLP, thereby destabilizing the GLP/G9a complex, inhibiting GLP/G9a-mediated interaction with DNMTs and DNA methylation, and inducing expression of tumor suppressors such as FOXO3 and inhibition of cell proliferation. Right, PCa-associated SPOP mutations fail to bind and degrade GLP, thereby inducing elevation of the GLP/G9a complex and their interaction with DNMTs, increasing DNA methylation and suppression of expression of tumor suppressors and promoting cell proliferation. However, this process can be reversed by DNA demethylation reagents such as 5-AzaC in SPOP-mutant cells. Statistical significance was determined by unpaired two-tailed Student’s t test in (e, f). Experiments in (b, c) were repeated twice. Source data are provided as a Source Data file. Image collected and cropped by CiteAb from the following open publication (https://pubmed.ncbi.nlm.nih.gov/34588438), licensed under a CC-BY license. Not internally tested by R&D Systems.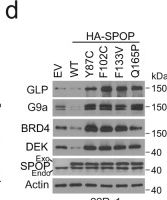
Detection of G9a/EHMT2 by Western Blot
GLP/G9a protein is elevated in SPOP-mutant PCa cells in culture and in patient specimens.a Western blots with indicated antibodies in WCL and co-IP samples from 293T cells transfected with plasmids of empty vector (EV) or indicated SPOP mutants and treated with 20 µM MG132 for 8 h. b Western blots with indicated antibodies in WCL and co-IP samples of anti-Flag antibody from 293T cells transfected with the indicated plasmids and treated with 20 µM MG132 for 8 h. c Western blots of WCL from 293T cells transfected with the indicated plasmids. d Western blots of WCL from 22Rv1 cells stably infected with lentivirus expressing EV, WT or mutant HA-SPOP. e, f Representative IFC images of Myc-SPOP and endogenous GLP staining in 22Rv1 cells transfected with Myc-SPOP F102C (e) and the optical density (OD)/nuclear area (pixel) of GLP staining was quantified using ImageJ (f). Data shown means ± SD (n = 50 cells/group). Scale bar, 10 μm. g, h Representative IHC images of GLP and G9a staining in SPOP-WT and Q165P mutant PDX tumors (g) and the quantitative data of GLP and G9a staining (h). Scale bar in 200X images, 100 μm; Scale bar in 400X images, 50 μm. Data shown means ± SD (n = 3 replicates/group). i, j Representative IHC images of GLP and G9a staining in 84 PCa patient specimens (i) and the quantitative data of GLP and G9a staining (j). Scale bar, 50 μm. Statistical significance was determined by unpaired two-tailed Student’s t test in (f, h). Statistical significance was determined by two-tailed Wilcoxon rank-sum test in (j). Experiments in (a–d) were repeated twice. Source data are provided as a Source Data file. Image collected and cropped by CiteAb from the following open publication (https://pubmed.ncbi.nlm.nih.gov/34588438), licensed under a CC-BY license. Not internally tested by R&D Systems.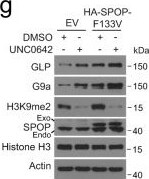
Detection of G9a/EHMT2 by Western Blot
GLP/G9a mediate SPOP mutation-induced hypermethylation independent of its HMTase activity.a Pearson correlation of 5mC and GLP/G9a IHC scores in 84 PCa patient specimens. b–d Western blots of WCL from 22Rv1 cells infected with lentivirus expressing indicated constructs and shRNAs (b). Representative IFC images of 5mC and HA-SPOP F133V staining are shown in (c), and ImageJ was used to quantify the optical density (OD)/nuclear area (pixel) of 5mC signals (d). Data shown means ± SD (n = 50 cells/group). Scale bar, 10 μm. e, f 22Rv1 cells infected with lentivirus expressing indicated constructs and shRNAs were harvested for Western blots with indicated antibodies (e) or used for MTS assay to measure cell proliferation (f). Data shown means ± SD (n = 5 replicates/group). g-i 22Rv1 cells infected with lentivirus expressing EV and SPOP F133V and treated with 2 µM UNC0642 for 24 h for western blots (g). Representative IFC images of 5mC and HA-SPOP F133V staining are shown in (h) and 5mC signals in each group were quantified using ImageJ (i). Data shown means ± SD (n = 50 cells/group). Scale bar, 10 μm. Statistical significance was determined by unpaired two-tailed Student’s t test in (a, d, f, i). Experiments in (b, e, g) were repeated twice. Source data are provided as a Source Data file. Image collected and cropped by CiteAb from the following open publication (https://pubmed.ncbi.nlm.nih.gov/34588438), licensed under a CC-BY license. Not internally tested by R&D Systems.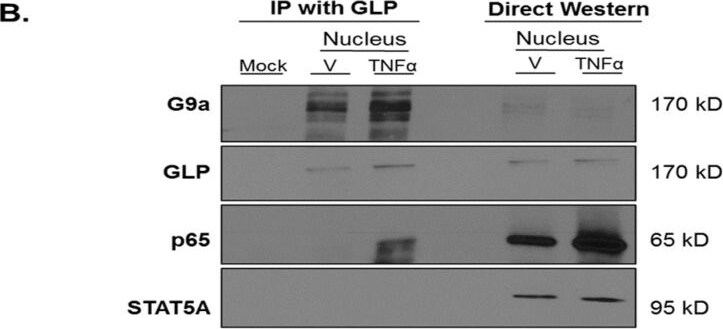
Detection of G9a/EHMT2 by Western Blot
p65 is present in a complex with G9a and GLP under TNF alpha -stimulated conditions in 3T3-L1 adipocytes. Fully differentiated 3T3-L1 adipocytes were treated with 0.75 nM TNF alpha or an equivalent volume of vehicle (0.1% BSA/PBS) for 30 min. (A) Monolayers were collected and subjected to subcellular fractionation. As shown in the left-hand portion of the figure, cytosolic and nuclear protein extracts (300 μg total protein/sample) were immunoprecipitated (IP) with an anti-G9a antibody. The mock sample contained anti-G9a antibody without cell extract and was used as a negative control. (B) The left-hand portion of the figure shows IP of nuclear extract (300 μg total protein/sample) using anti-GLP antibody. The mock sample contained anti-G9a antibody (A) or anti-GLP antibody (B) without protein extract and was used as a negative control in each experiment. The samples on the right-hand portion of (A) or (B) are direct western blot controls containing 25 μg total protein that were analyzed via immunoblotting without IP. This is a representative figure of an experiment independently performed three times. (See Figures S6 and S7 for the original Western blot images). Image collected and cropped by CiteAb from the following open publication (https://pubmed.ncbi.nlm.nih.gov/37237488), licensed under a CC-BY license. Not internally tested by R&D Systems.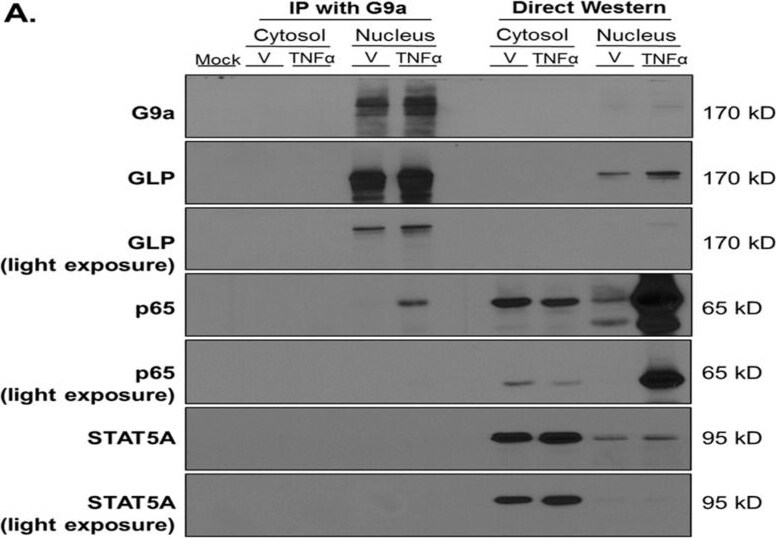
Detection of G9a/EHMT2 by Western Blot
p65 is present in a complex with G9a and GLP under TNF alpha -stimulated conditions in 3T3-L1 adipocytes. Fully differentiated 3T3-L1 adipocytes were treated with 0.75 nM TNF alpha or an equivalent volume of vehicle (0.1% BSA/PBS) for 30 min. (A) Monolayers were collected and subjected to subcellular fractionation. As shown in the left-hand portion of the figure, cytosolic and nuclear protein extracts (300 μg total protein/sample) were immunoprecipitated (IP) with an anti-G9a antibody. The mock sample contained anti-G9a antibody without cell extract and was used as a negative control. (B) The left-hand portion of the figure shows IP of nuclear extract (300 μg total protein/sample) using anti-GLP antibody. The mock sample contained anti-G9a antibody (A) or anti-GLP antibody (B) without protein extract and was used as a negative control in each experiment. The samples on the right-hand portion of (A) or (B) are direct western blot controls containing 25 μg total protein that were analyzed via immunoblotting without IP. This is a representative figure of an experiment independently performed three times. (See Figures S6 and S7 for the original Western blot images). Image collected and cropped by CiteAb from the following open publication (https://pubmed.ncbi.nlm.nih.gov/37237488), licensed under a CC-BY license. Not internally tested by R&D Systems.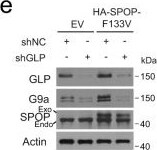
Detection of G9a/EHMT2 by Western Blot
GLP/G9a mediate SPOP mutation-induced hypermethylation independent of its HMTase activity.a Pearson correlation of 5mC and GLP/G9a IHC scores in 84 PCa patient specimens. b–d Western blots of WCL from 22Rv1 cells infected with lentivirus expressing indicated constructs and shRNAs (b). Representative IFC images of 5mC and HA-SPOP F133V staining are shown in (c), and ImageJ was used to quantify the optical density (OD)/nuclear area (pixel) of 5mC signals (d). Data shown means ± SD (n = 50 cells/group). Scale bar, 10 μm. e, f 22Rv1 cells infected with lentivirus expressing indicated constructs and shRNAs were harvested for Western blots with indicated antibodies (e) or used for MTS assay to measure cell proliferation (f). Data shown means ± SD (n = 5 replicates/group). g-i 22Rv1 cells infected with lentivirus expressing EV and SPOP F133V and treated with 2 µM UNC0642 for 24 h for western blots (g). Representative IFC images of 5mC and HA-SPOP F133V staining are shown in (h) and 5mC signals in each group were quantified using ImageJ (i). Data shown means ± SD (n = 50 cells/group). Scale bar, 10 μm. Statistical significance was determined by unpaired two-tailed Student’s t test in (a, d, f, i). Experiments in (b, e, g) were repeated twice. Source data are provided as a Source Data file. Image collected and cropped by CiteAb from the following open publication (https://pubmed.ncbi.nlm.nih.gov/34588438), licensed under a CC-BY license. Not internally tested by R&D Systems.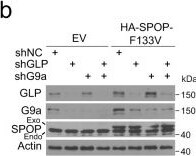
Detection of G9a/EHMT2 by Western Blot
GLP/G9a mediate SPOP mutation-induced hypermethylation independent of its HMTase activity.a Pearson correlation of 5mC and GLP/G9a IHC scores in 84 PCa patient specimens. b–d Western blots of WCL from 22Rv1 cells infected with lentivirus expressing indicated constructs and shRNAs (b). Representative IFC images of 5mC and HA-SPOP F133V staining are shown in (c), and ImageJ was used to quantify the optical density (OD)/nuclear area (pixel) of 5mC signals (d). Data shown means ± SD (n = 50 cells/group). Scale bar, 10 μm. e, f 22Rv1 cells infected with lentivirus expressing indicated constructs and shRNAs were harvested for Western blots with indicated antibodies (e) or used for MTS assay to measure cell proliferation (f). Data shown means ± SD (n = 5 replicates/group). g-i 22Rv1 cells infected with lentivirus expressing EV and SPOP F133V and treated with 2 µM UNC0642 for 24 h for western blots (g). Representative IFC images of 5mC and HA-SPOP F133V staining are shown in (h) and 5mC signals in each group were quantified using ImageJ (i). Data shown means ± SD (n = 50 cells/group). Scale bar, 10 μm. Statistical significance was determined by unpaired two-tailed Student’s t test in (a, d, f, i). Experiments in (b, e, g) were repeated twice. Source data are provided as a Source Data file. Image collected and cropped by CiteAb from the following open publication (https://pubmed.ncbi.nlm.nih.gov/34588438), licensed under a CC-BY license. Not internally tested by R&D Systems.Applications for G9a/EHMT2 Antibody (A8620A)
Direct ELISA
Immunohistochemistry
Immunoprecipitation
Western Blot
Formulation, Preparation, and Storage
Purification
Formulation
Shipping
Stability & Storage
Background: G9a/EHMT2
Long Name
Alternate Names
Gene Symbol
Additional G9a/EHMT2 Products
Product Documents for G9a/EHMT2 Antibody (A8620A)
Certificate of Analysis
To download a Certificate of Analysis, please enter a lot or batch number in the search box below.
Note: Certificate of Analysis not available for kit components.
Product Specific Notices for G9a/EHMT2 Antibody (A8620A)
For research use only
Related Research Areas
Citations for G9a/EHMT2 Antibody (A8620A)
 Powered by Bioz
Customer Reviews for G9a/EHMT2 Antibody (A8620A)
There are currently no reviews for this product. Be the first to review G9a/EHMT2 Antibody (A8620A) and earn rewards!
Have you used G9a/EHMT2 Antibody (A8620A)?
Submit a review and receive an Amazon gift card!
$25/€18/£15/$25CAN/¥2500 for a review with an image
$10/€7/£6/$10CAN/¥1110 for a review without an image
Submit a review
Protocols
Find general support by application which include: protocols, troubleshooting, illustrated assays, videos and webinars.
- Antigen Retrieval Protocol (PIER)
- Antigen Retrieval for Frozen Sections Protocol
- Appropriate Fixation of IHC/ICC Samples
- Cellular Response to Hypoxia Protocols
- Chromogenic IHC Staining of Formalin-Fixed Paraffin-Embedded (FFPE) Tissue Protocol
- Chromogenic Immunohistochemistry Staining of Frozen Tissue
- ClariTSA™ Fluorophore Kits
- Detection & Visualization of Antibody Binding
- ELISA Sample Preparation & Collection Guide
- ELISA Troubleshooting Guide
- Fluorescent IHC Staining of Frozen Tissue Protocol
- Graphic Protocol for Heat-induced Epitope Retrieval
- Graphic Protocol for the Preparation and Fluorescent IHC Staining of Frozen Tissue Sections
- Graphic Protocol for the Preparation and Fluorescent IHC Staining of Paraffin-embedded Tissue Sections
- Graphic Protocol for the Preparation of Gelatin-coated Slides for Histological Tissue Sections
- How to Run an R&D Systems DuoSet ELISA
- How to Run an R&D Systems Quantikine ELISA
- How to Run an R&D Systems Quantikine™ QuicKit™ ELISA
- IHC Sample Preparation (Frozen sections vs Paraffin)
- Immunofluorescent IHC Staining of Formalin-Fixed Paraffin-Embedded (FFPE) Tissue Protocol
- Immunohistochemistry (IHC) and Immunocytochemistry (ICC) Protocols
- Immunohistochemistry Frozen Troubleshooting
- Immunohistochemistry Paraffin Troubleshooting
- Immunoprecipitation Protocol
- Preparing Samples for IHC/ICC Experiments
- Preventing Non-Specific Staining (Non-Specific Binding)
- Primary Antibody Selection & Optimization
- Protocol for Heat-Induced Epitope Retrieval (HIER)
- Protocol for Making a 4% Formaldehyde Solution in PBS
- Protocol for VisUCyte™ HRP Polymer Detection Reagent
- Protocol for the Preparation & Fixation of Cells on Coverslips
- Protocol for the Preparation and Chromogenic IHC Staining of Frozen Tissue Sections
- Protocol for the Preparation and Chromogenic IHC Staining of Frozen Tissue Sections - Graphic
- Protocol for the Preparation and Chromogenic IHC Staining of Paraffin-embedded Tissue Sections
- Protocol for the Preparation and Chromogenic IHC Staining of Paraffin-embedded Tissue Sections - Graphic
- Protocol for the Preparation and Fluorescent IHC Staining of Frozen Tissue Sections
- Protocol for the Preparation and Fluorescent IHC Staining of Paraffin-embedded Tissue Sections
- Protocol for the Preparation of Gelatin-coated Slides for Histological Tissue Sections
- Quantikine HS ELISA Kit Assay Principle, Alkaline Phosphatase
- Quantikine HS ELISA Kit Principle, Streptavidin-HRP Polymer
- R&D Systems Quality Control Western Blot Protocol
- Sandwich ELISA (Colorimetric) – Biotin/Streptavidin Detection Protocol
- Sandwich ELISA (Colorimetric) – Direct Detection Protocol
- TUNEL and Active Caspase-3 Detection by IHC/ICC Protocol
- The Importance of IHC/ICC Controls
- Troubleshooting Guide: ELISA
- Troubleshooting Guide: Immunohistochemistry
- Troubleshooting Guide: Western Blot Figures
- Western Blot Conditions
- Western Blot Protocol
- Western Blot Protocol for Cell Lysates
- Western Blot Troubleshooting
- Western Blot Troubleshooting Guide
- View all Protocols, Troubleshooting, Illustrated assays and Webinars
Associated Pathways
